

Trending Stocks and Expiry Calendar on SAHI
4 min read
Published 6 Nov 2026, 10:00 PM ISTUpdated Sat, 7 Nov, 2026, 05:30 AM IST
Summary
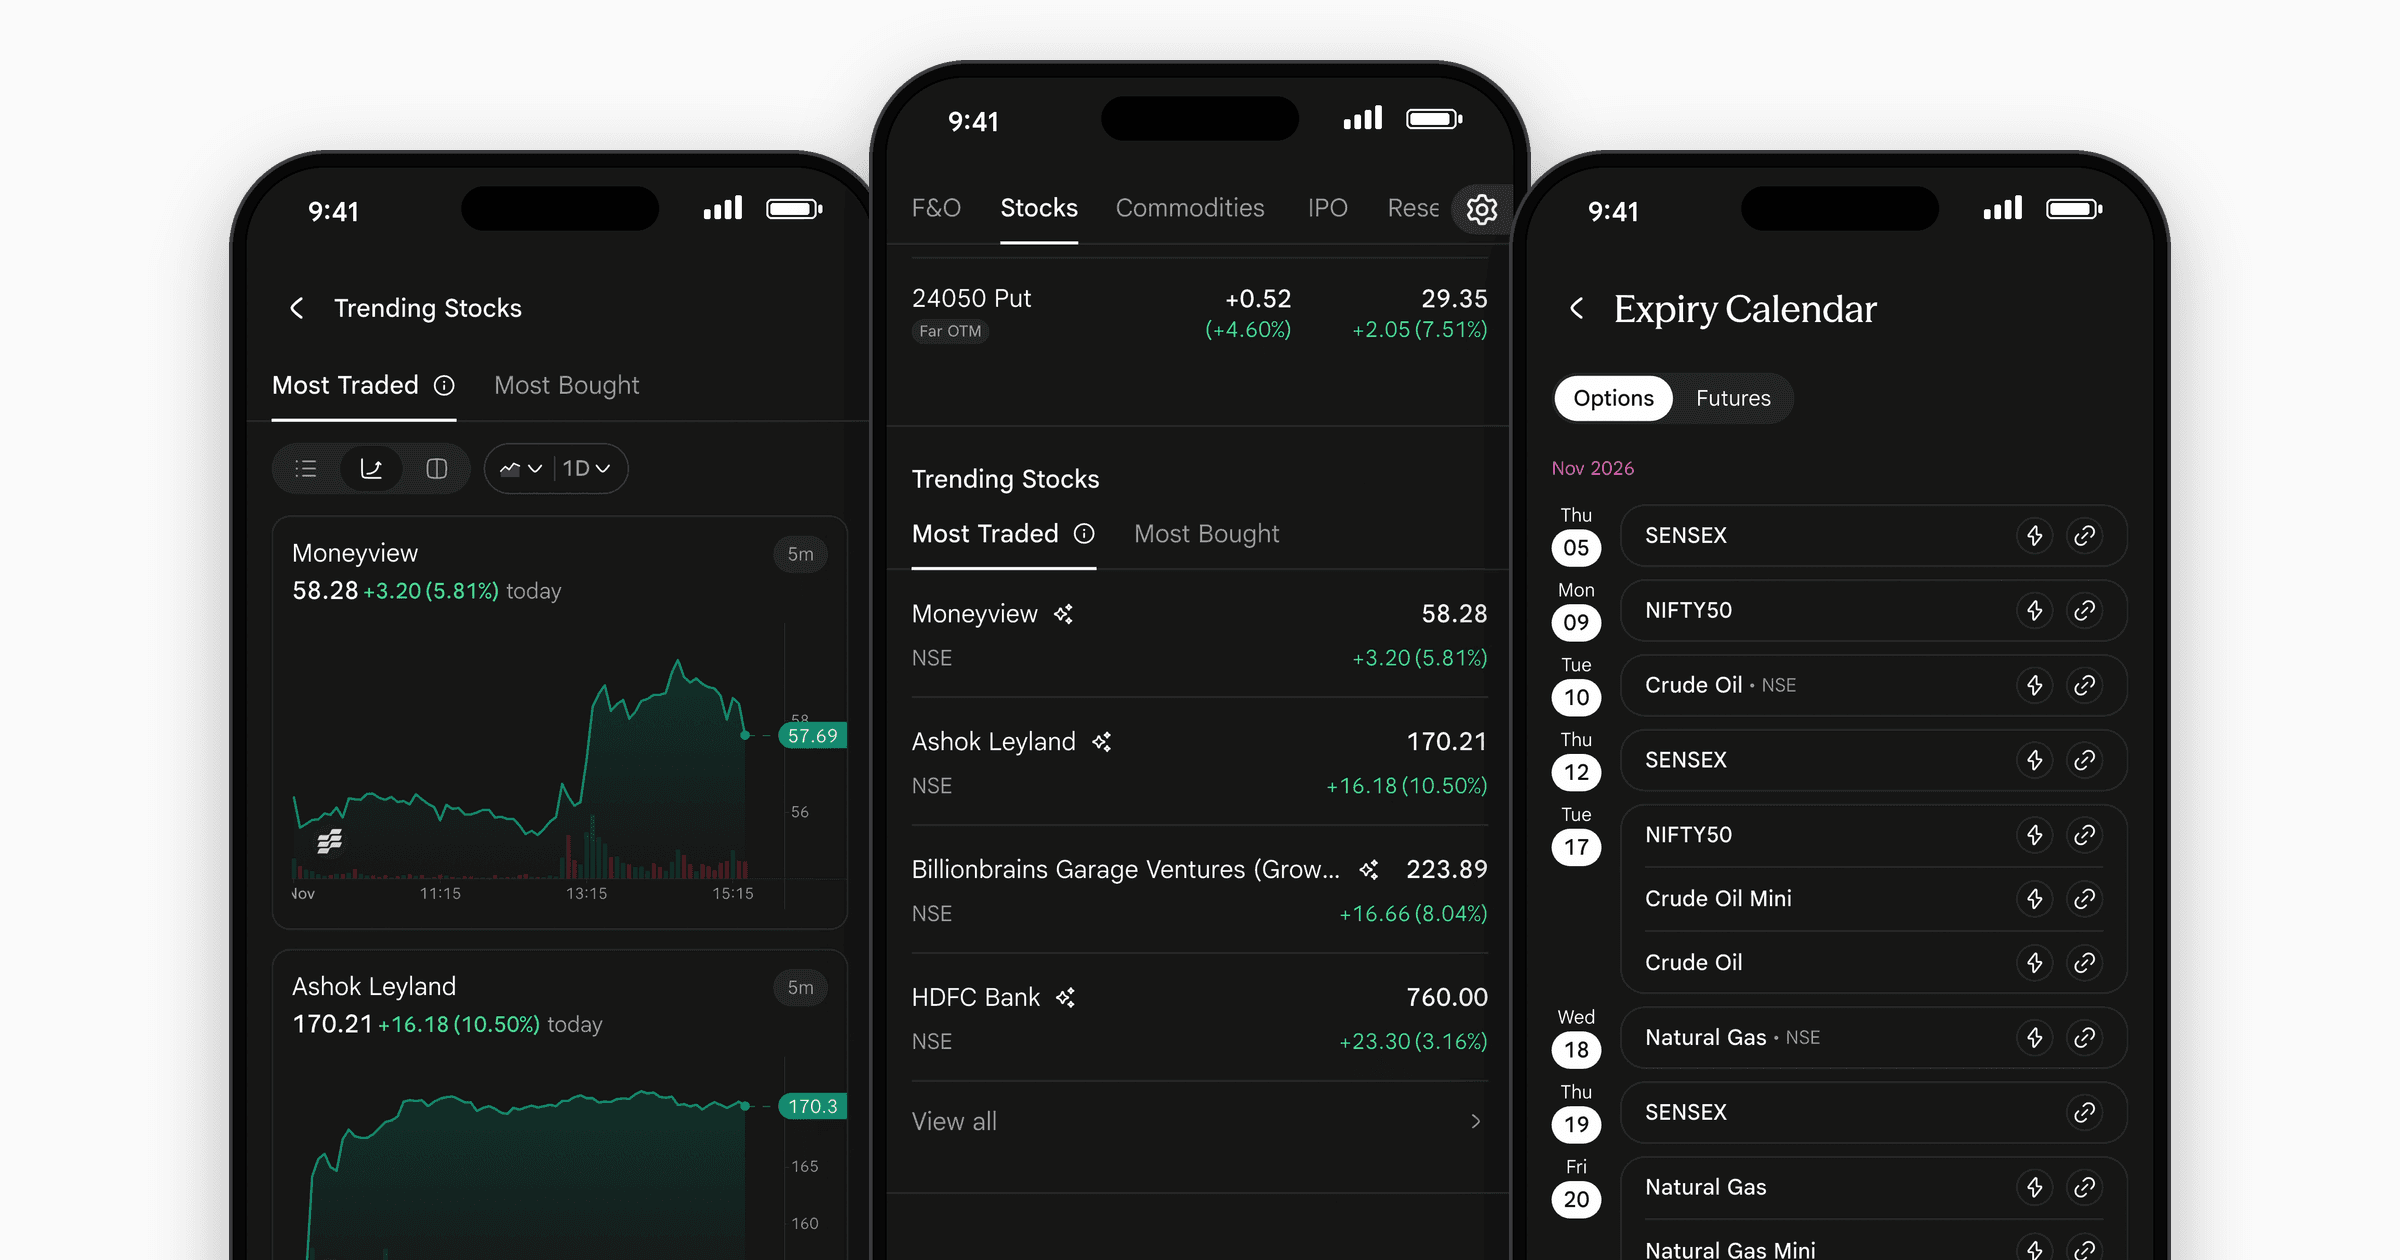
This week on SAHI, you get two new ways to see what the market is doing. Trending Stocks is a new widget on your Stocks tab with two views. Most Traded shows the stocks and ETFs with the most shares traded for the day, updated every 5 minutes. Most Bought shows the stocks and ETFs with the highest delivery quantity over the last 15 trading sessions. Tap View all to open the full list and read it as a list, as charts or as columns. Charts come in seven types, including Line, Candle, Heikin Ashi and Renko. The column view shows LTP, Change, Change %, Traded Volume, Best Bid Price, Best Ask Price and VWAP. Expiry Calendar shows upcoming expiries for indices and commodities in one place, grouped by month. Switch between Options and Futures to see the expiries you trade. Open it from the Expiry button at the top right of Indices on the F&O tab, or at the top right of Top Traded Commodity on the Commodities tab.
Trade Smarter, Not Harder
Receive market breakouts, AI insights, and trading strategies directly in your inbox.
What's New on SAHI
Here's what's new on SAHI this week.
Trending Stocks
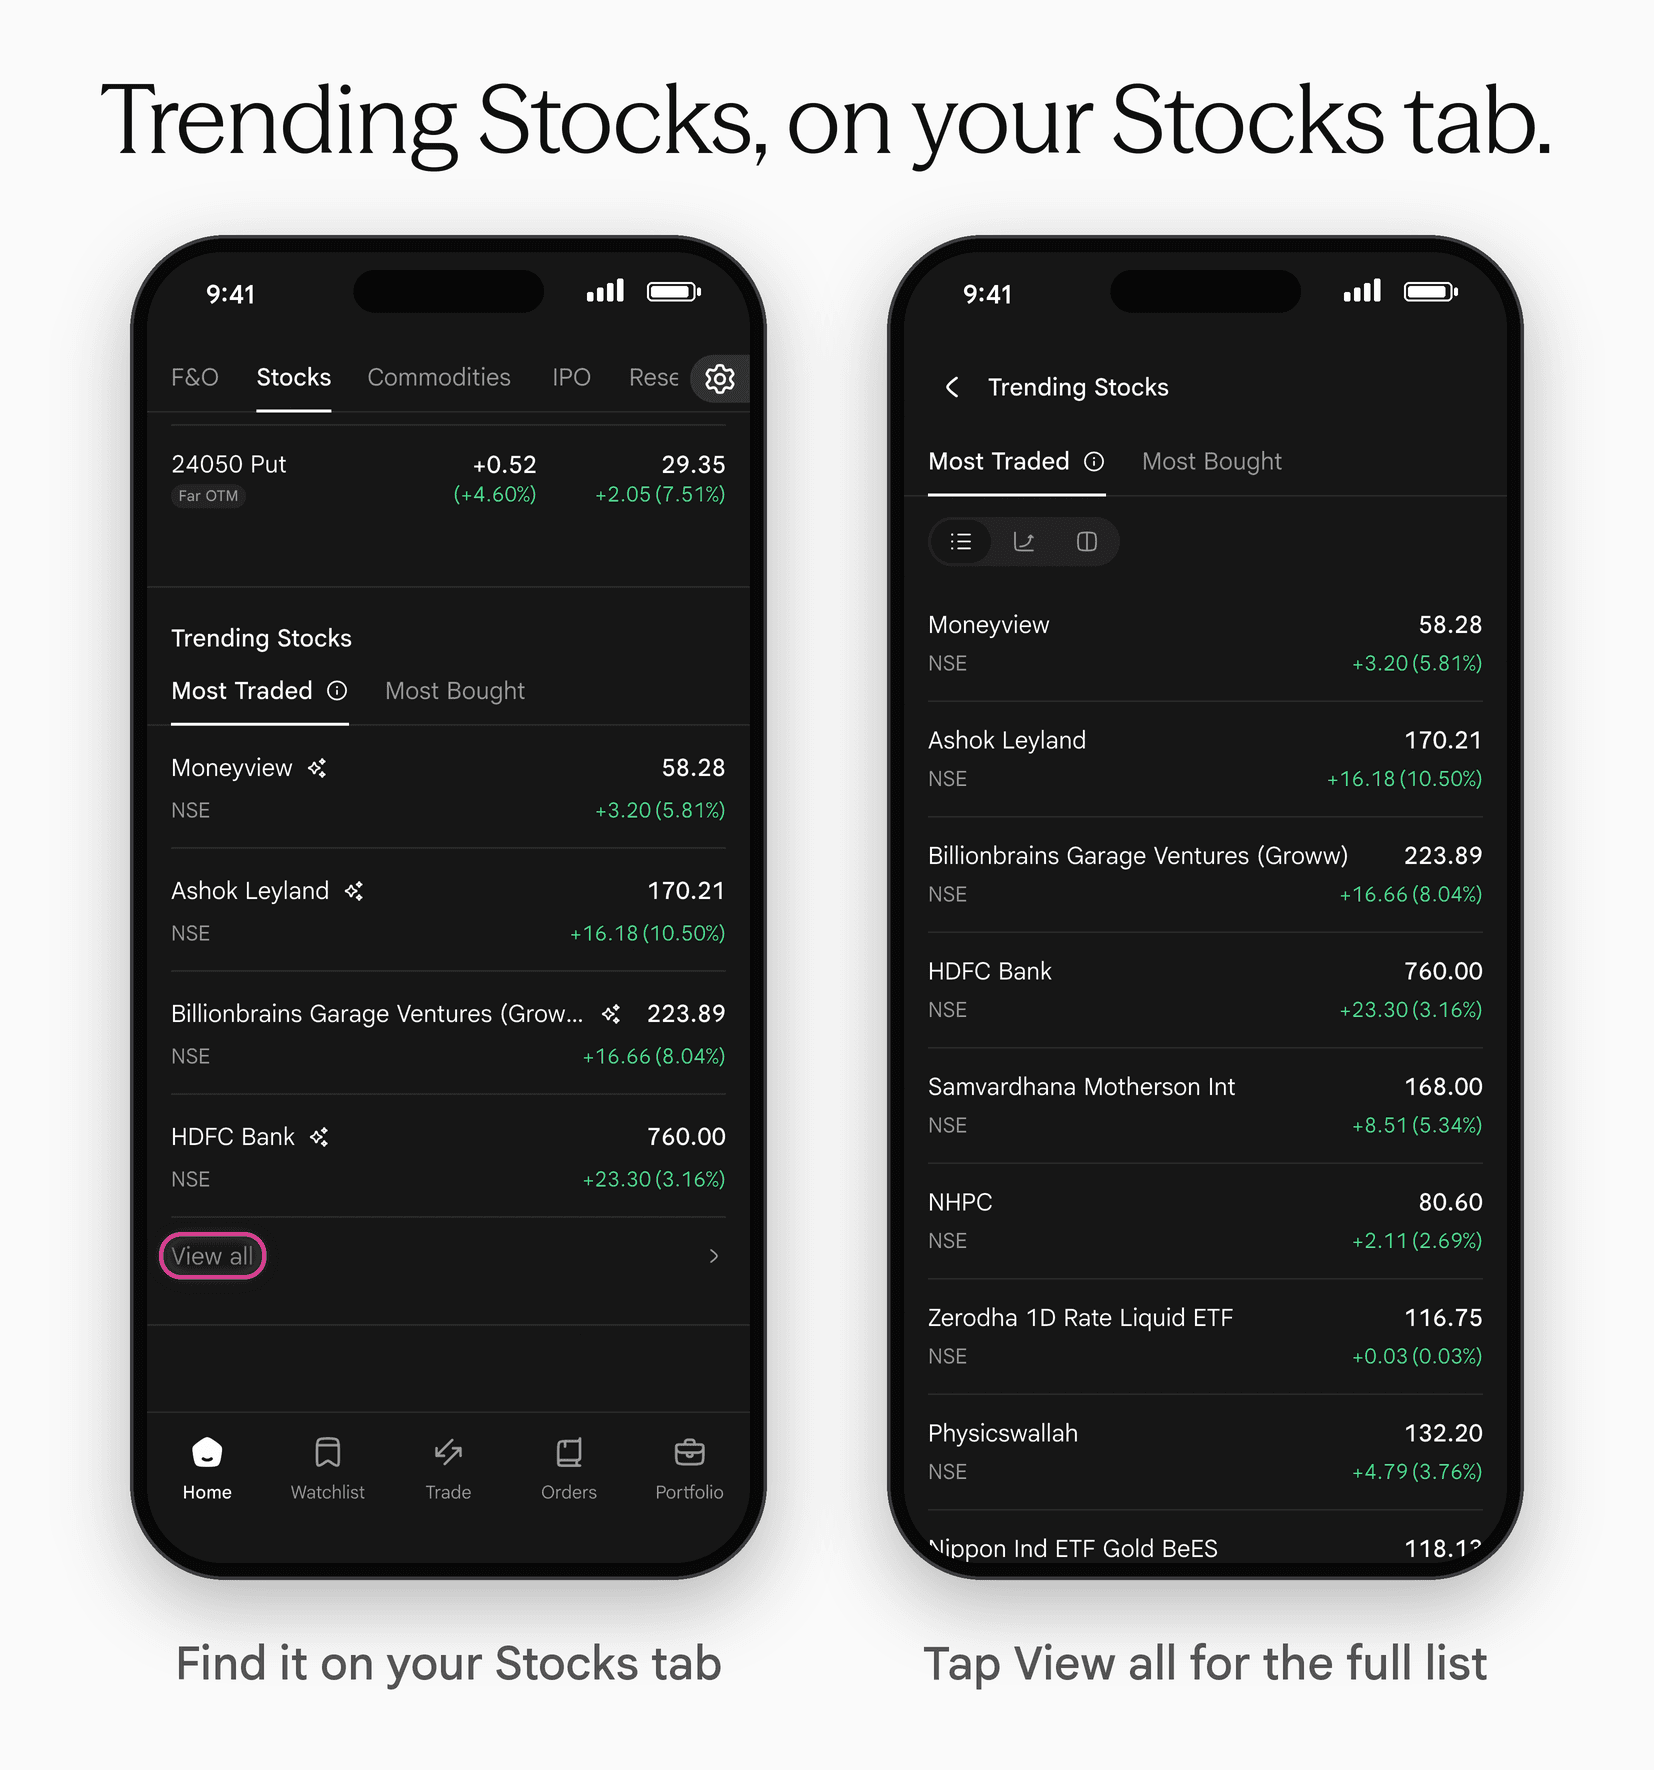
Every trading day, some stocks get more attention than others. Trending Stocks puts them on your Stocks tab, so you can see where the activity is without searching for it.
The widget has two views.
Most Traded
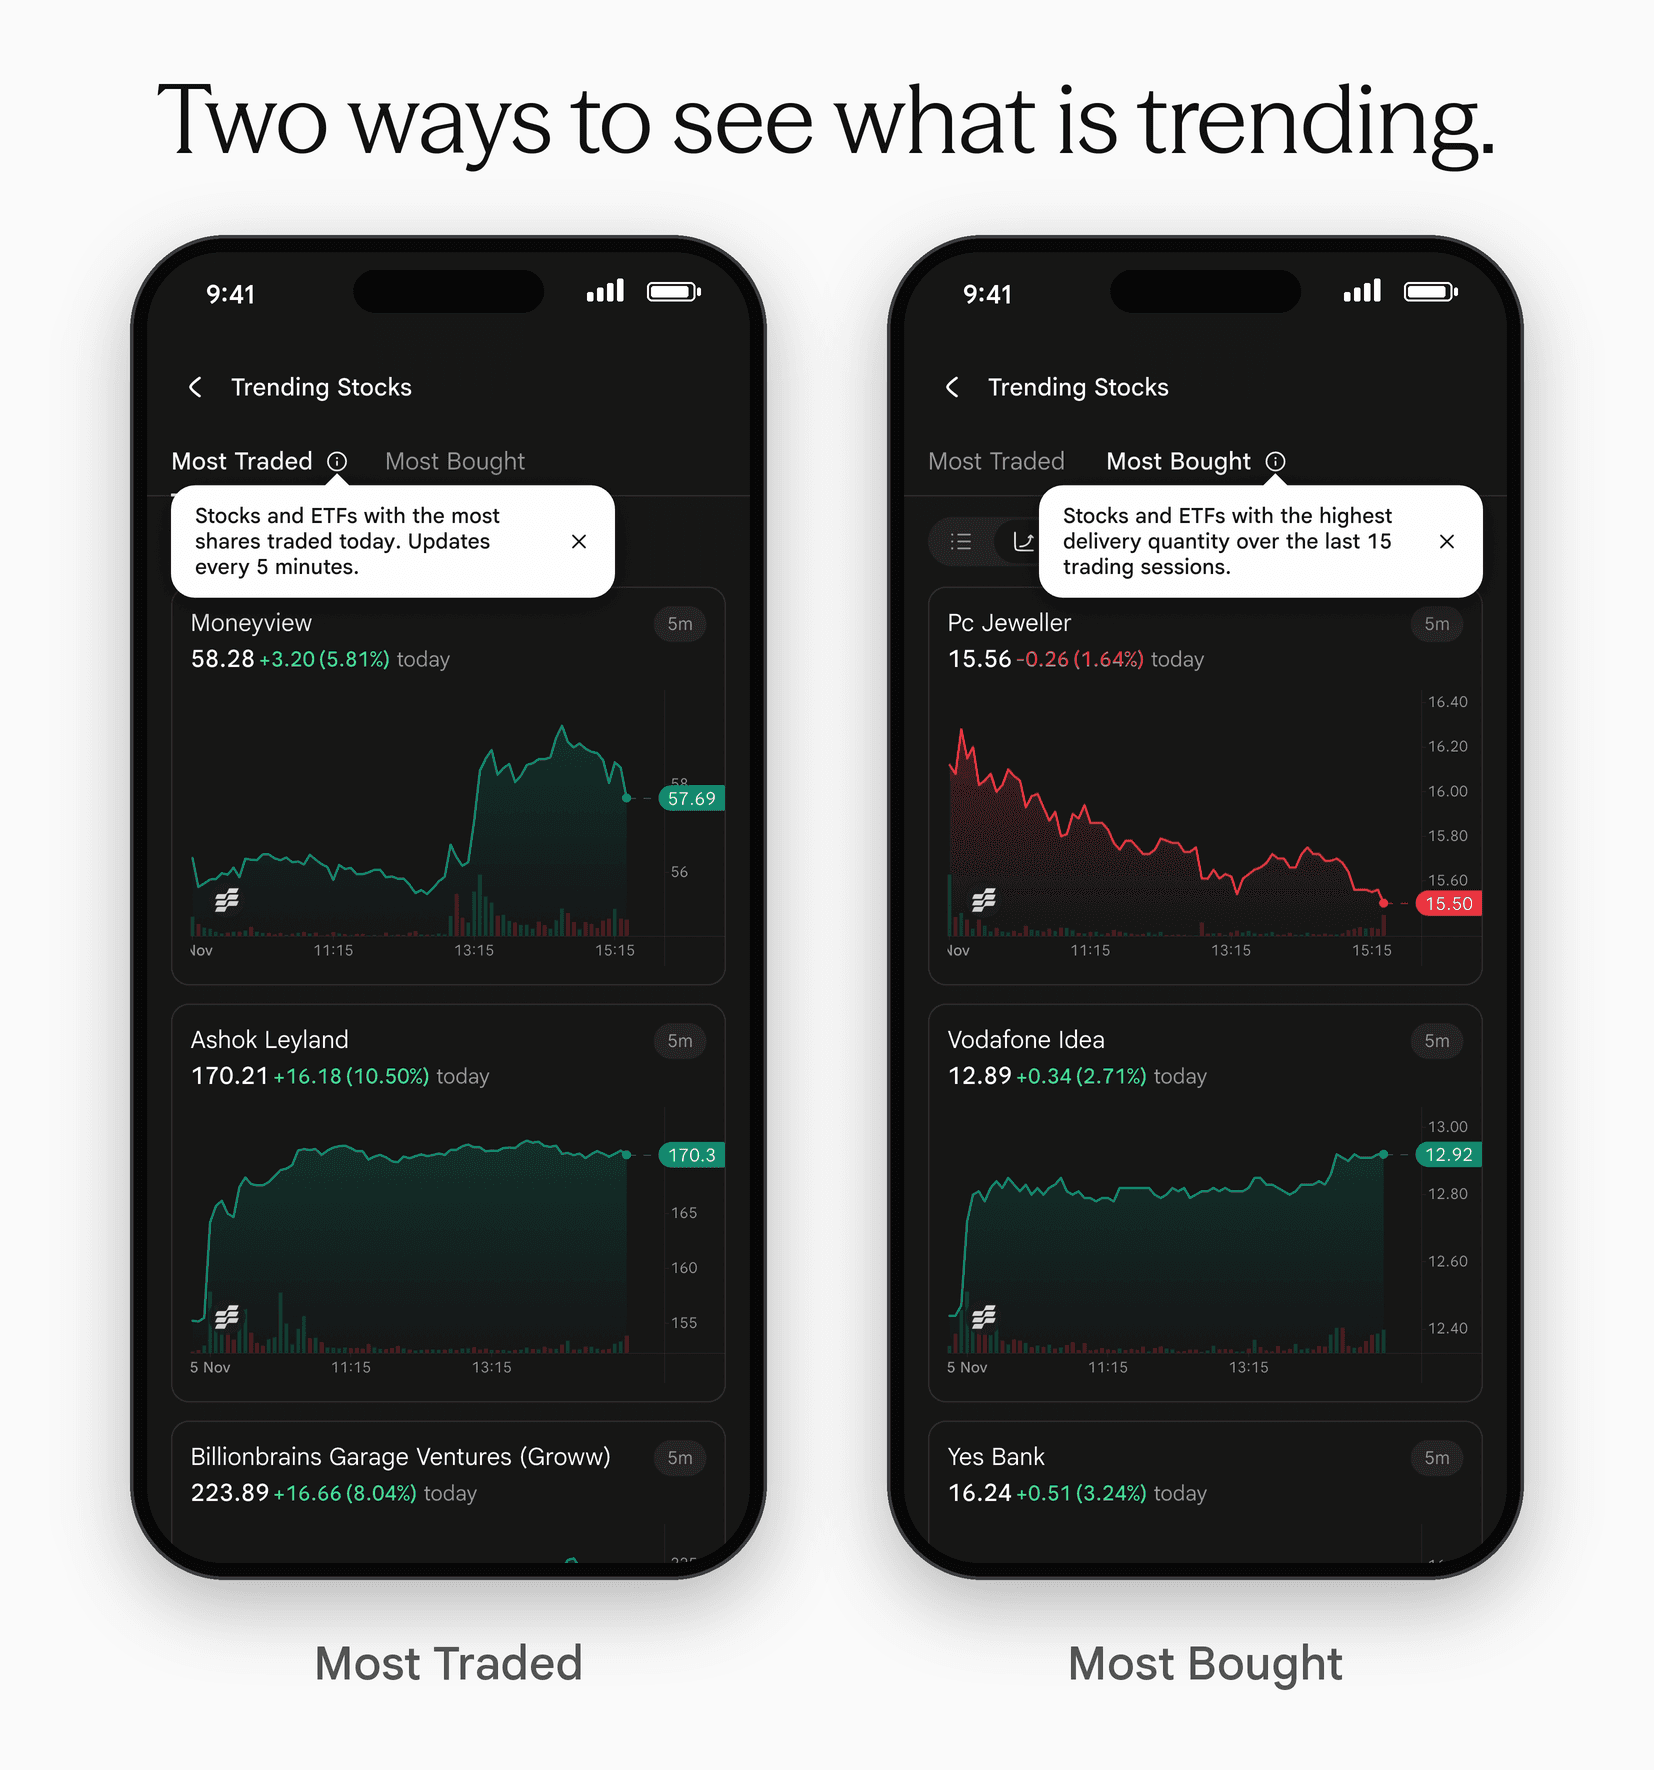
Stocks and ETFs with the most shares traded for the day. Updates every 5 minutes. This is the view to open when you want to know what is active right now.
Most Bought
Stocks and ETFs with the highest delivery quantity over the last 15 trading sessions. Delivery quantity counts the shares that were taken home, not the shares that changed hands within the day. This view shows what investors have been holding on to.
Tap the (i) icon next to each view to read what it measures.
See more than the top few
The widget on your Stocks tab shows the first few stocks. Tap View all to open the full list.
On the full screen, you can switch between three ways to read the list, for both Most Traded and Most Bought: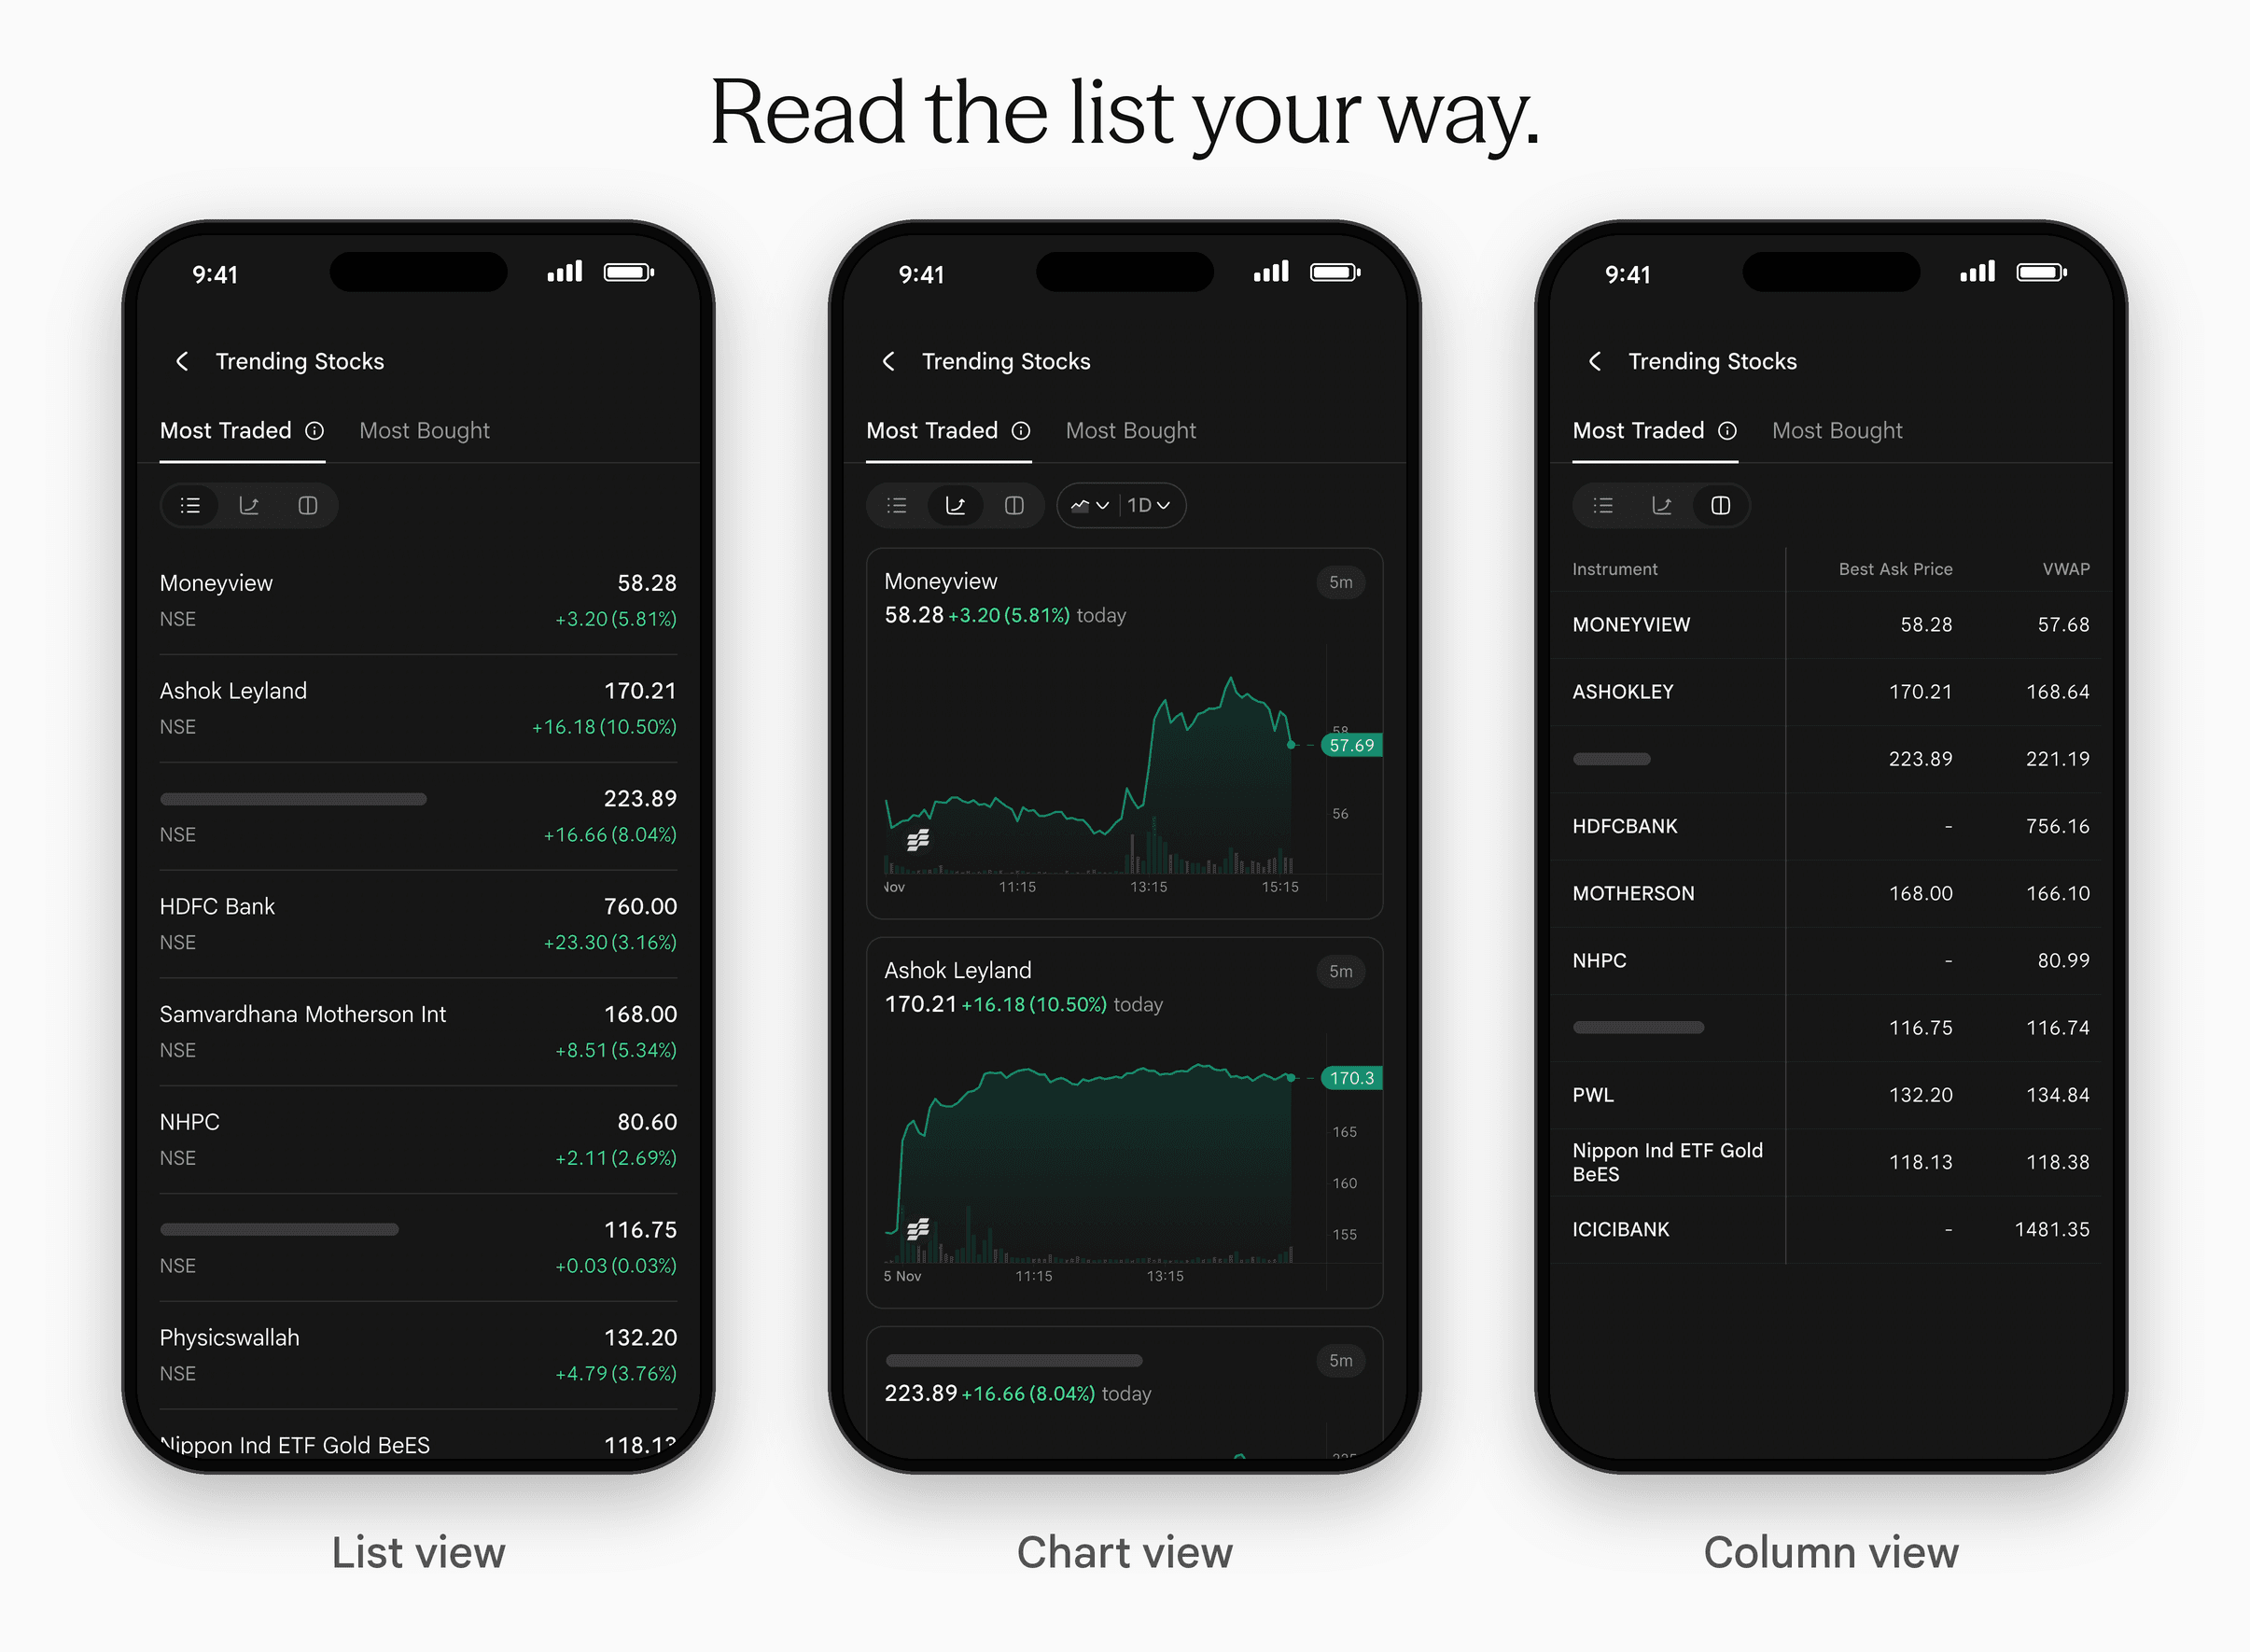
- List view for a quick scan of names and prices.
- Chart view for a chart of each stock. Pick the chart type you prefer: Line, Step Line, Area, Candle, Heikin Ashi, Hollow Candle or Renko.
- Column view for a table with LTP, Change, Change %, Traded Volume, Best Bid Price, Best Ask Price and VWAP.
Where to find it
Go to Home and open the Stocks tab. Trending Stocks sits there, with Most Traded and Most Bought one tap apart.
Expiry Calendar
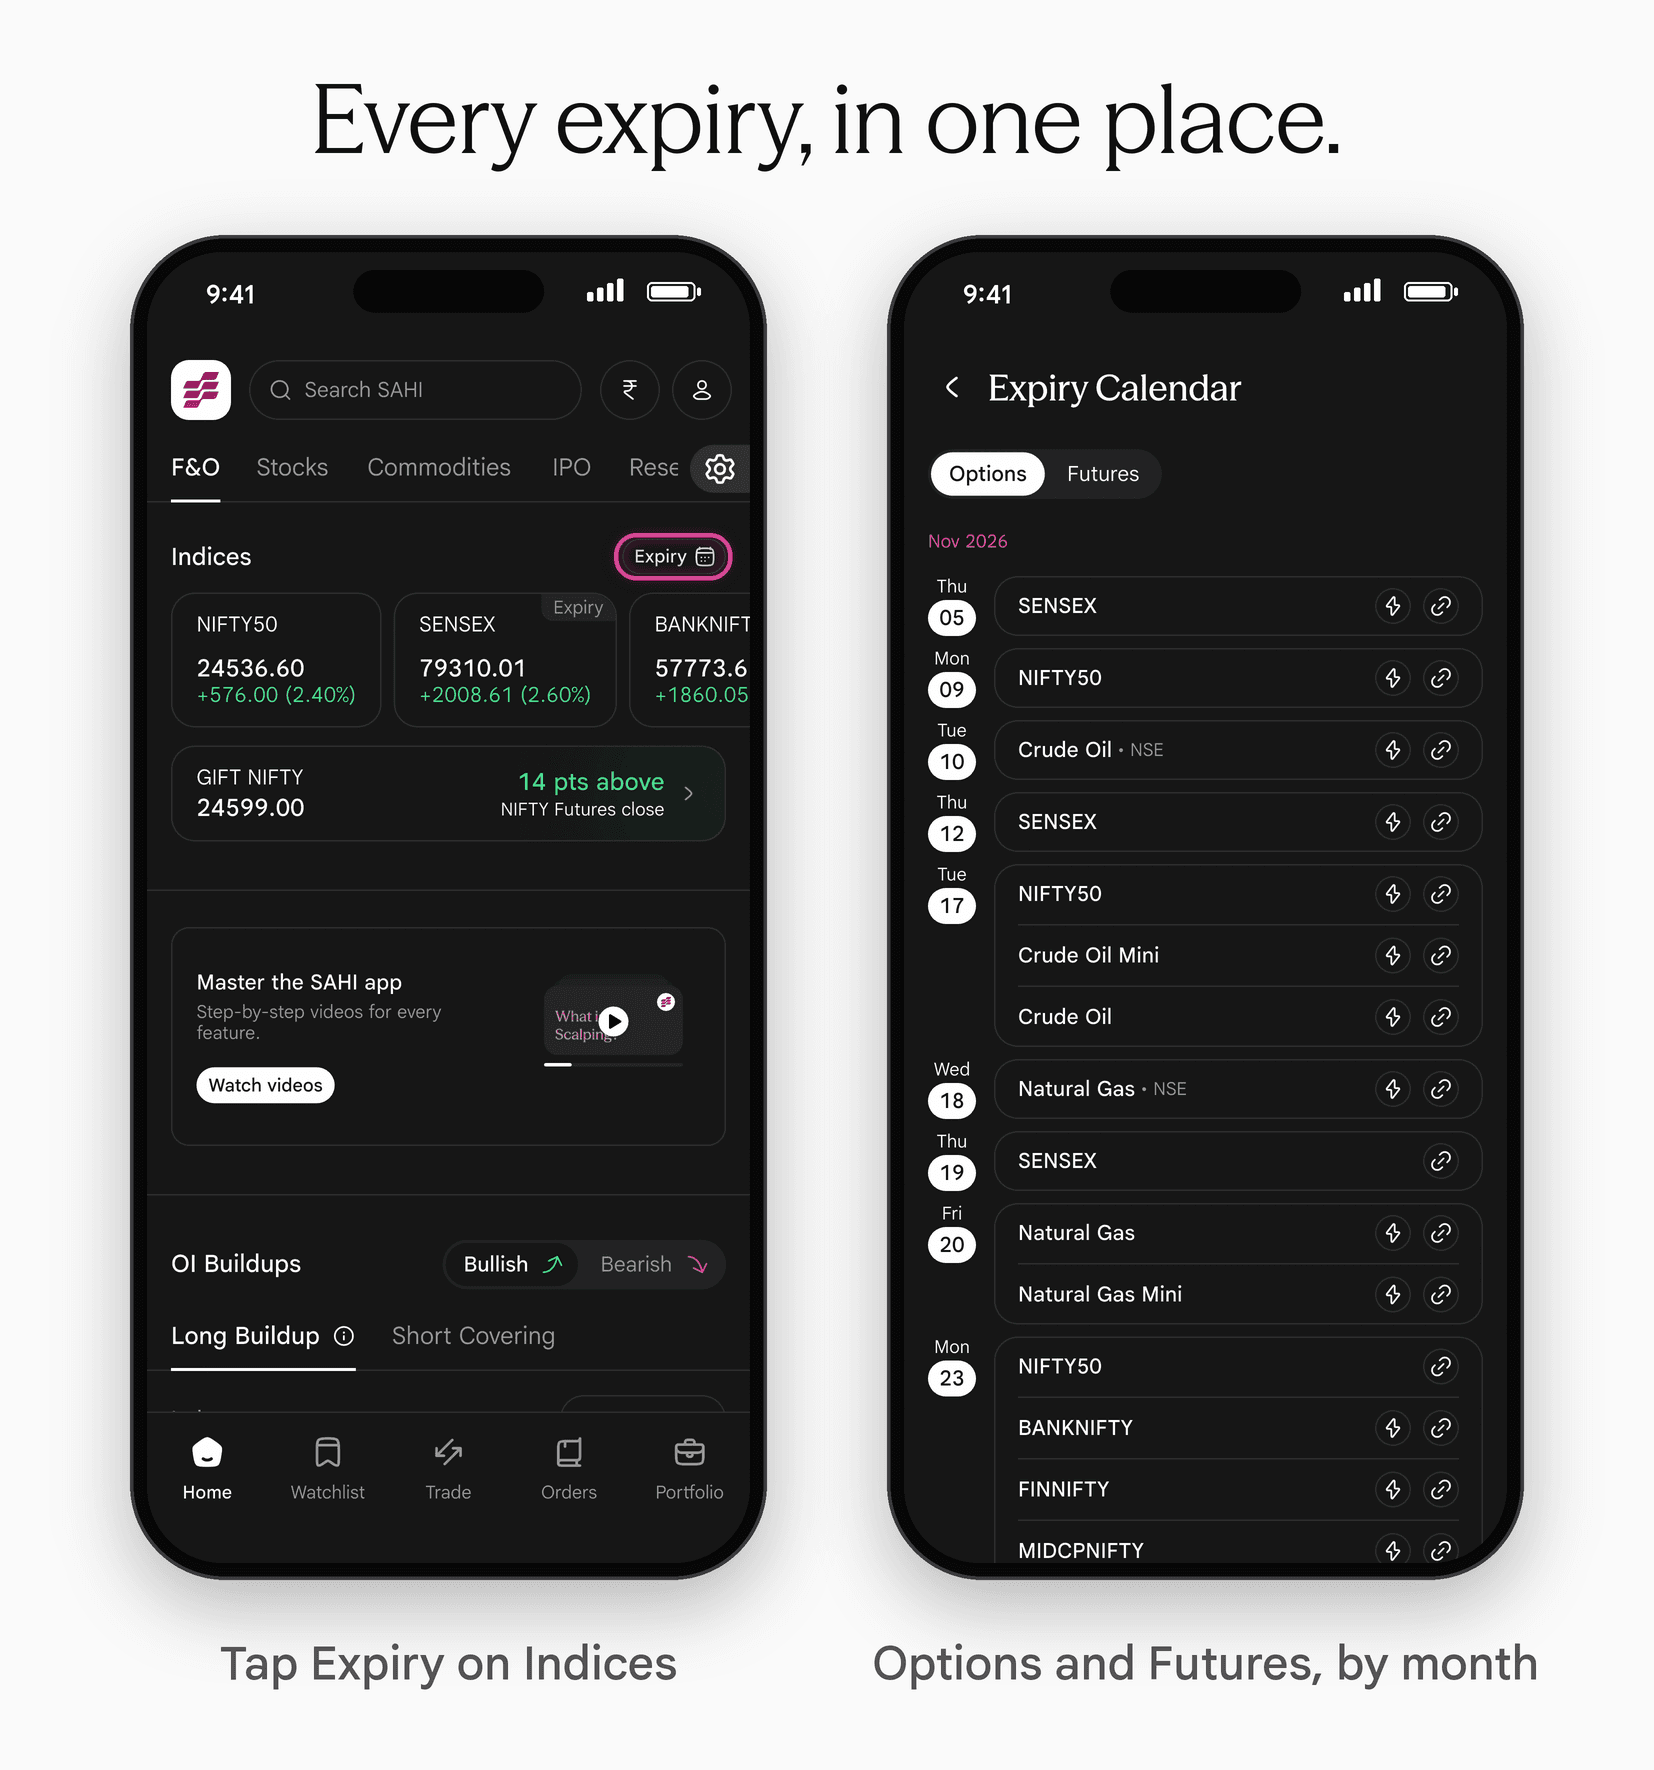
If you trade options or futures, expiry dates shape your week. Some traders plan around them. Others avoid them. Either way, you need to know when they fall, and expiry days can shift when a holiday lands on the usual date.
Expiry Calendar shows you upcoming expiries for indices and commodities in one place, grouped by month. Each row shows the date, the day and the name of the index or commodity.
Options and Futures, one switch apart
Use the switch at the top of the screen to move between Options and Futures. You see only the expiries for the segment you trade.
Where to find it
- On the F&O tab: tap Expiry at the top right of Indices.
- On the Commodities tab: tap Expiry at the top right of Top Traded Commodity.
Update to the latest version to start exploring.
For educational purposes only. Not investment advice.
FAQs

Recent blogs
AI Market Trends and Execution Marks
/Posted 1 week ago

Jio Platforms IPO: Everything Investors Need to Know Before Investing
/Posted 0 month ago
Add Sahi as a Preferred Source on Google
Click the link, confirm the box next to sahi.com is checked — ignore any other results.