
Sahi Charts Just Levelled Up: 13 Powerful New Indicators Added for Traders
Sahi introduces 13 new charting indicators to help traders analyse price structure, momentum, and volume more efficiently making it easier to spot breakouts, reversals, and trading opportunities.
Technical analysis is only as powerful as the tools available on a chart. Traders constantly rely on indicators to interpret price behaviour, measure momentum, detect hidden accumulation, and identify high-probability entry and exit points. But many charting setups require traders to manually combine multiple tools, redraw levels repeatedly, and constantly watch price movements.
Sahi’s latest charting update is designed to remove many of these frictions.
After months of trader requests and feedback, 13 new technical indicators have been added to Sahi charts, expanding the platform’s analytical capabilities across price structure, volume behaviour, and momentum signals. These indicators are designed to help traders identify opportunities faster, automate common charting tasks, and make trading decisions with greater clarity.
Below is a closer look at each of the newly introduced indicators and how traders can use them.
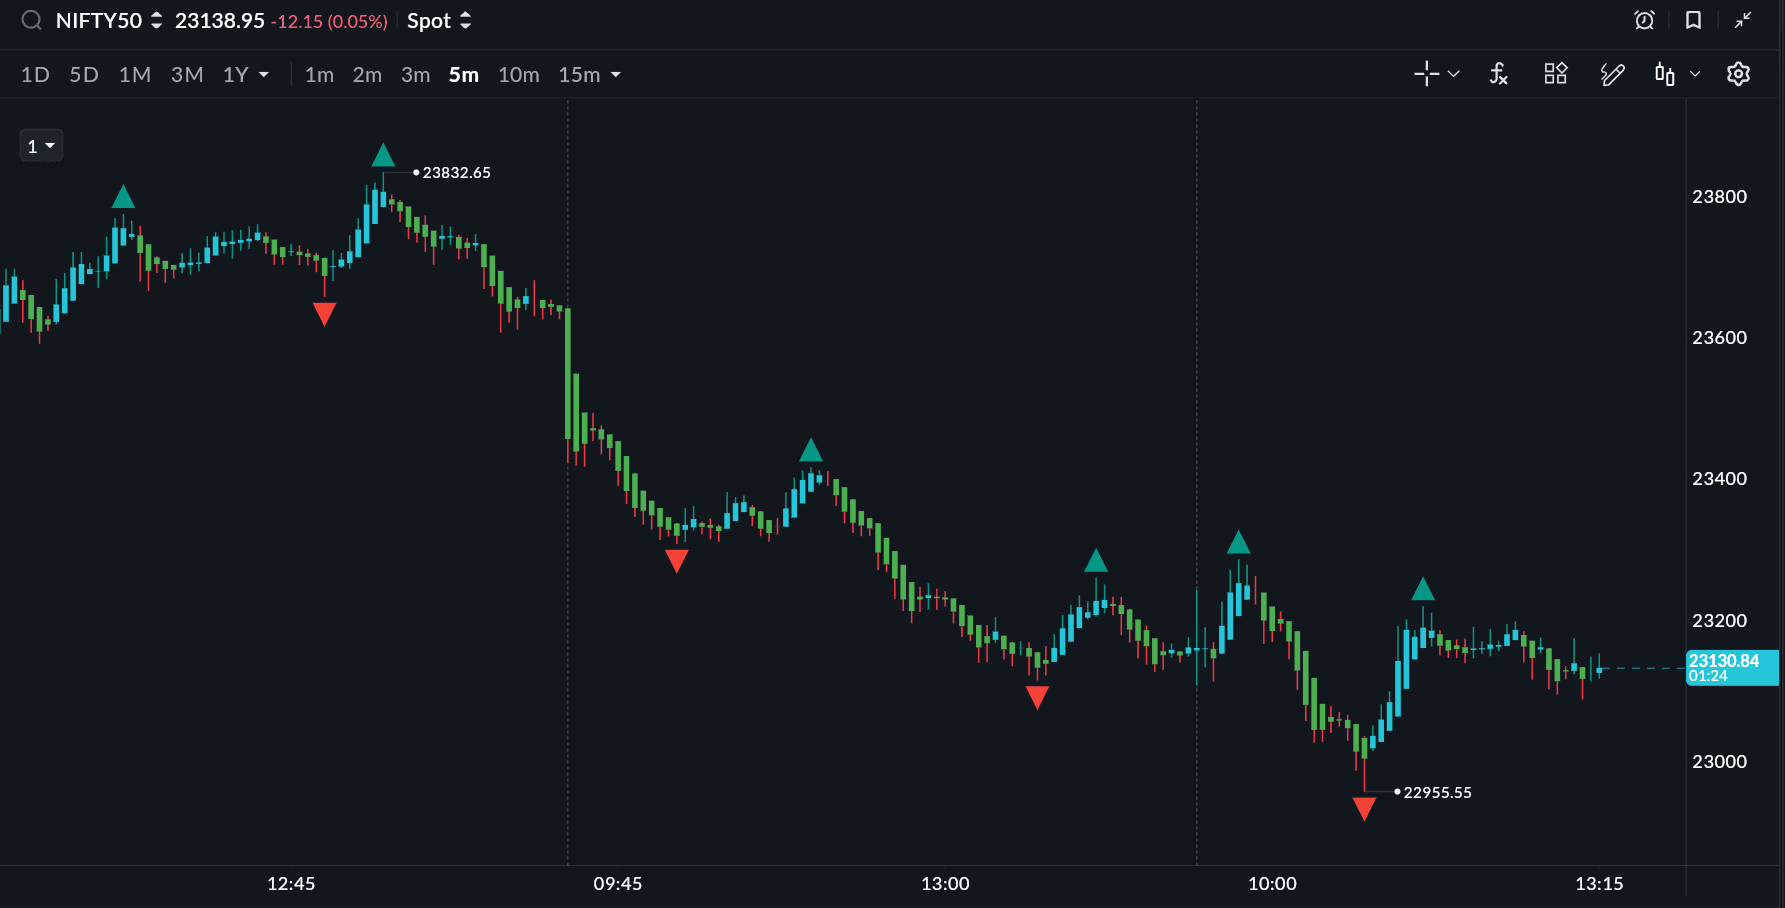
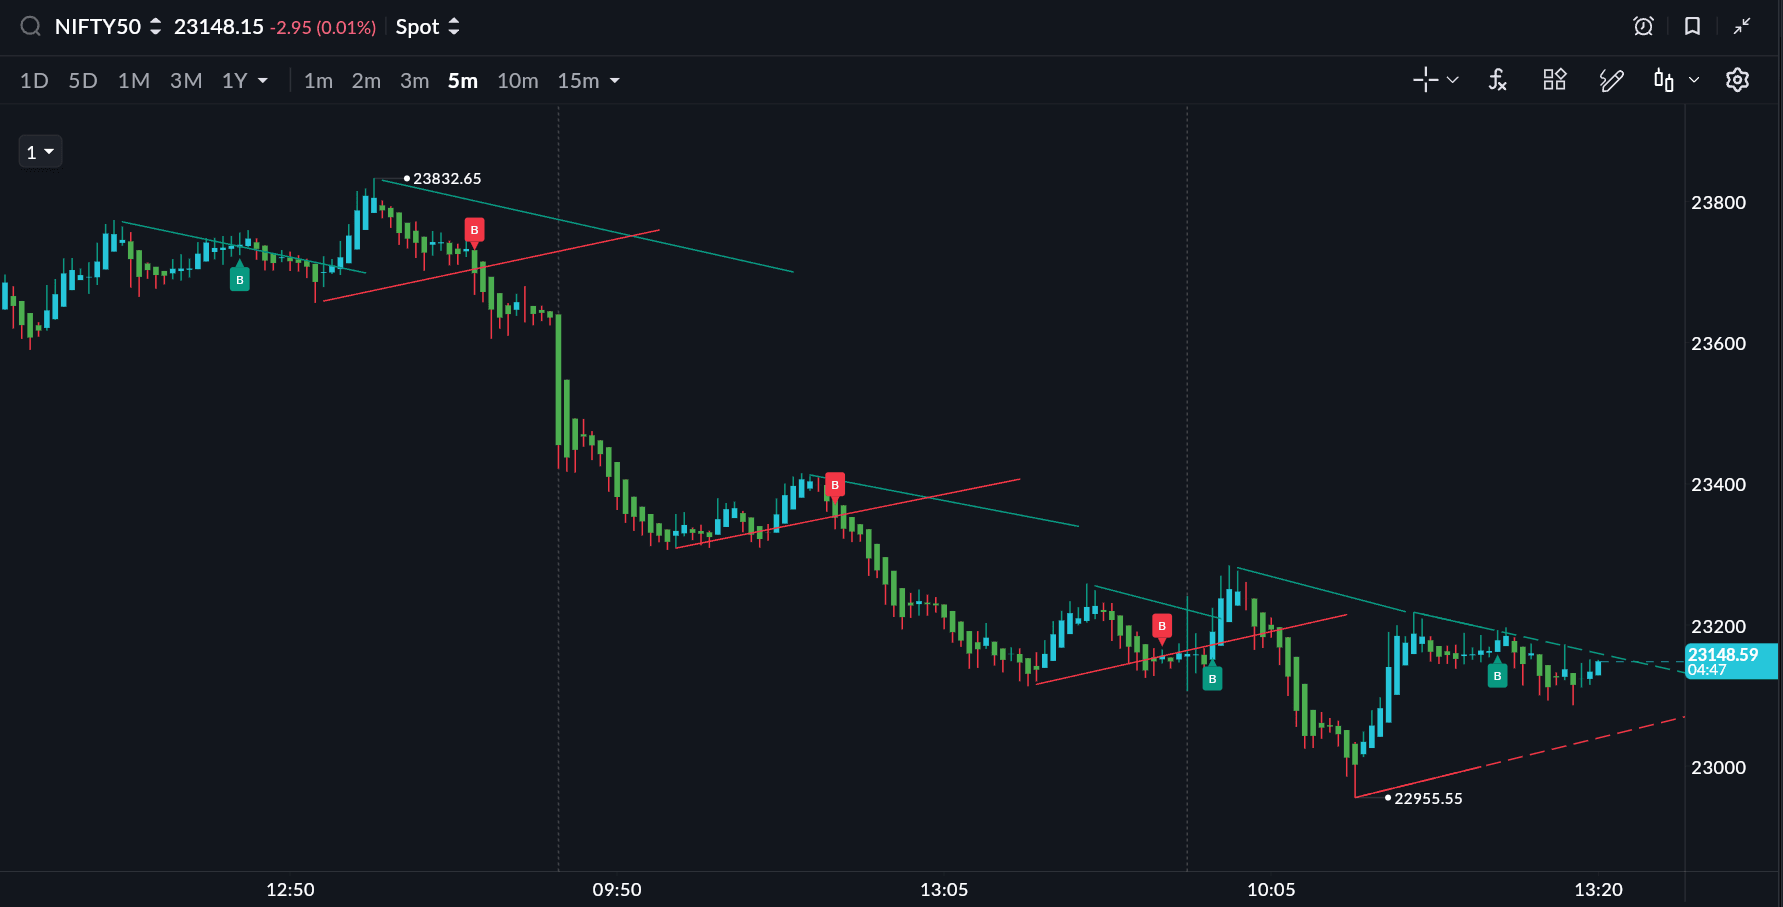
William Fractals: Quickly Identify Reversal Structures
Markets rarely move in straight lines. Instead, price tends to form local highs and lows that indicate temporary exhaustion or reversal points. William Fractals are designed to highlight these turning points automatically.
The indicator identifies patterns where a candle is surrounded by two lower highs or two higher lows, marking potential swing highs and swing lows.
For traders, fractals can serve several purposes:
- Identifying key structural points in the market
- Confirming potential support and resistance levels
- Detecting breakout structures when price breaks a previous fractal
Because these markers appear directly on the chart, traders can quickly understand the evolving structure of the market without manually scanning every candle.
For example, if Nifty forms a fractal high near 24,300 and price later breaks above that level, traders may interpret it as a structural breakout. Similarly, fractal lows can help identify potential support zones where buyers may step in.
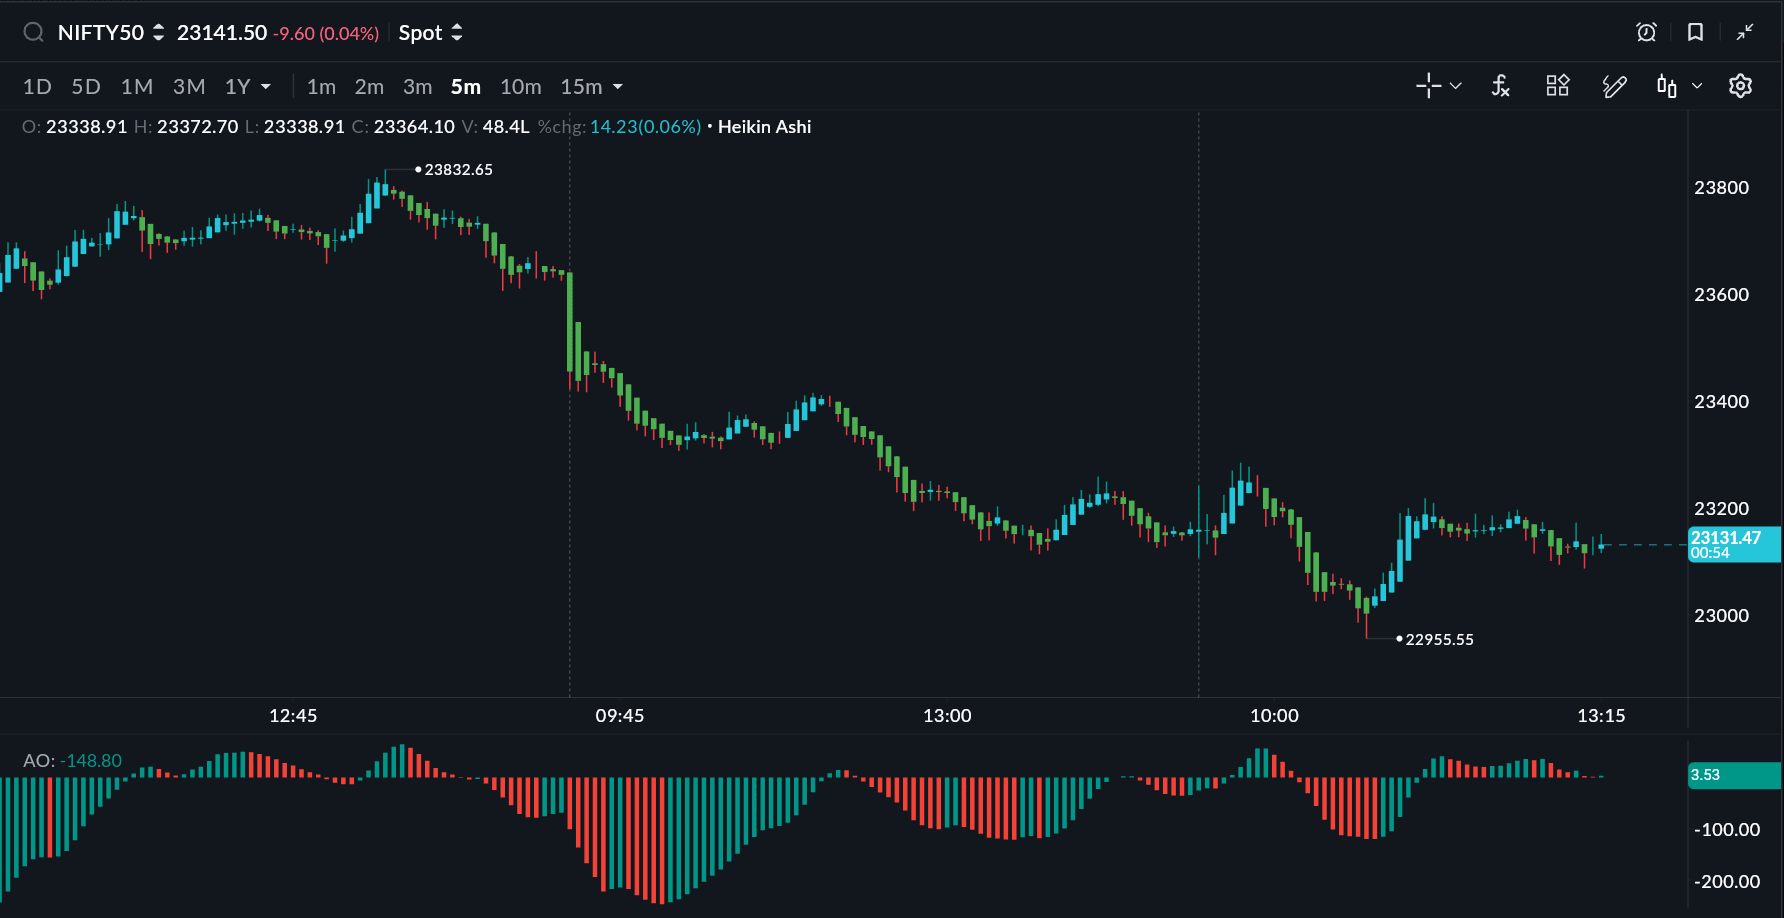
Awesome Oscillator: A Clear View of Market Momentum
Momentum often changes before price does. The Awesome Oscillator (AO) is designed to help traders detect these momentum shifts early.
Developed by Bill Williams, the indicator compares short-term and long-term moving averages and displays the result as a histogram. The bars expand and contract depending on whether bullish or bearish momentum is strengthening.
For instance, if Bank Nifty is moving sideways near resistance but the Awesome Oscillator begins turning positive, it may suggest strengthening momentum that could lead to a breakout attempt.
Traders commonly use the Awesome Oscillator to:
- Identify momentum shifts during trend reversals
- Confirm trend continuation
- Spot divergence patterns between price and momentum
Because the histogram visually represents the balance between buyers and sellers, traders can quickly gauge the underlying strength of a move.
Open Range Breakout (ORB): Trade the First Move of the Day
For intraday traders, the opening minutes of the market are often the most important. The price range formed during this early period frequently acts as a key reference for the rest of the trading session.
For example, if Bank Nifty opens between 57,200 and 57,350 and later breaks above the opening range with strong momentum, traders may interpret it as an intraday breakout setup.
The Open Range Breakout indicator automatically plots the high and low of the first 15, 30, or 60 minutes of trading, creating a clearly defined opening range.
Once this range is established, traders watch for price to break above or below it.
Common uses of ORB include:
- Entering momentum trades when price breaks the opening range
- Identifying false breakouts when price quickly returns inside the range
- Understanding intraday volatility expansion
For traders active in indices such as Nifty and Bank Nifty, ORB strategies are widely used to capture the early directional move of the day.
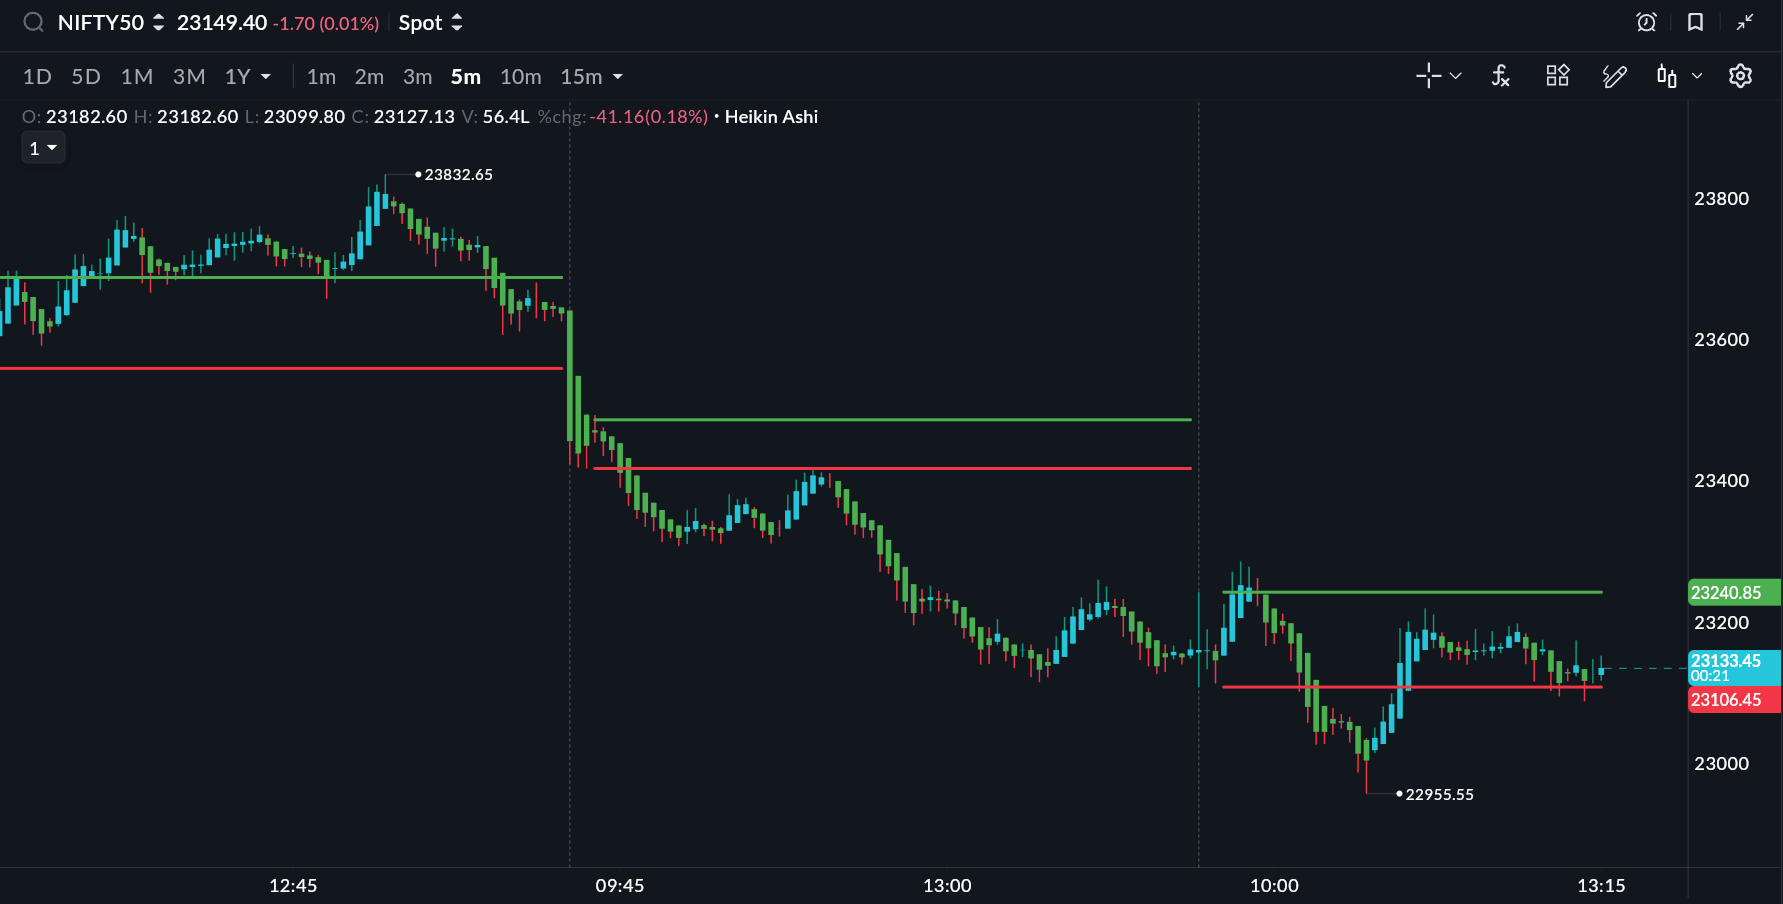
Trendline With Break : Automated Trend Analysis
A common challenge in technical analysis is identifying exactly when a trendline break occurs. Traders often draw trendlines manually and monitor them constantly for potential breaks.
With Trendline with Break Detection, traders can immediately see when a previously respected trendline gives way. For instance, if a stock has been respecting a downward trendline for several sessions and price suddenly breaks above it, the indicator highlights the moment the structure changes.
Behind the scenes, Sahi automatically detects trendlines based on price movement and flags the exact moment price breaks through them.
This removes the need for constant manual drawing and monitoring. Instead of spending time adjusting lines, traders can focus directly on interpreting the breakout signal.
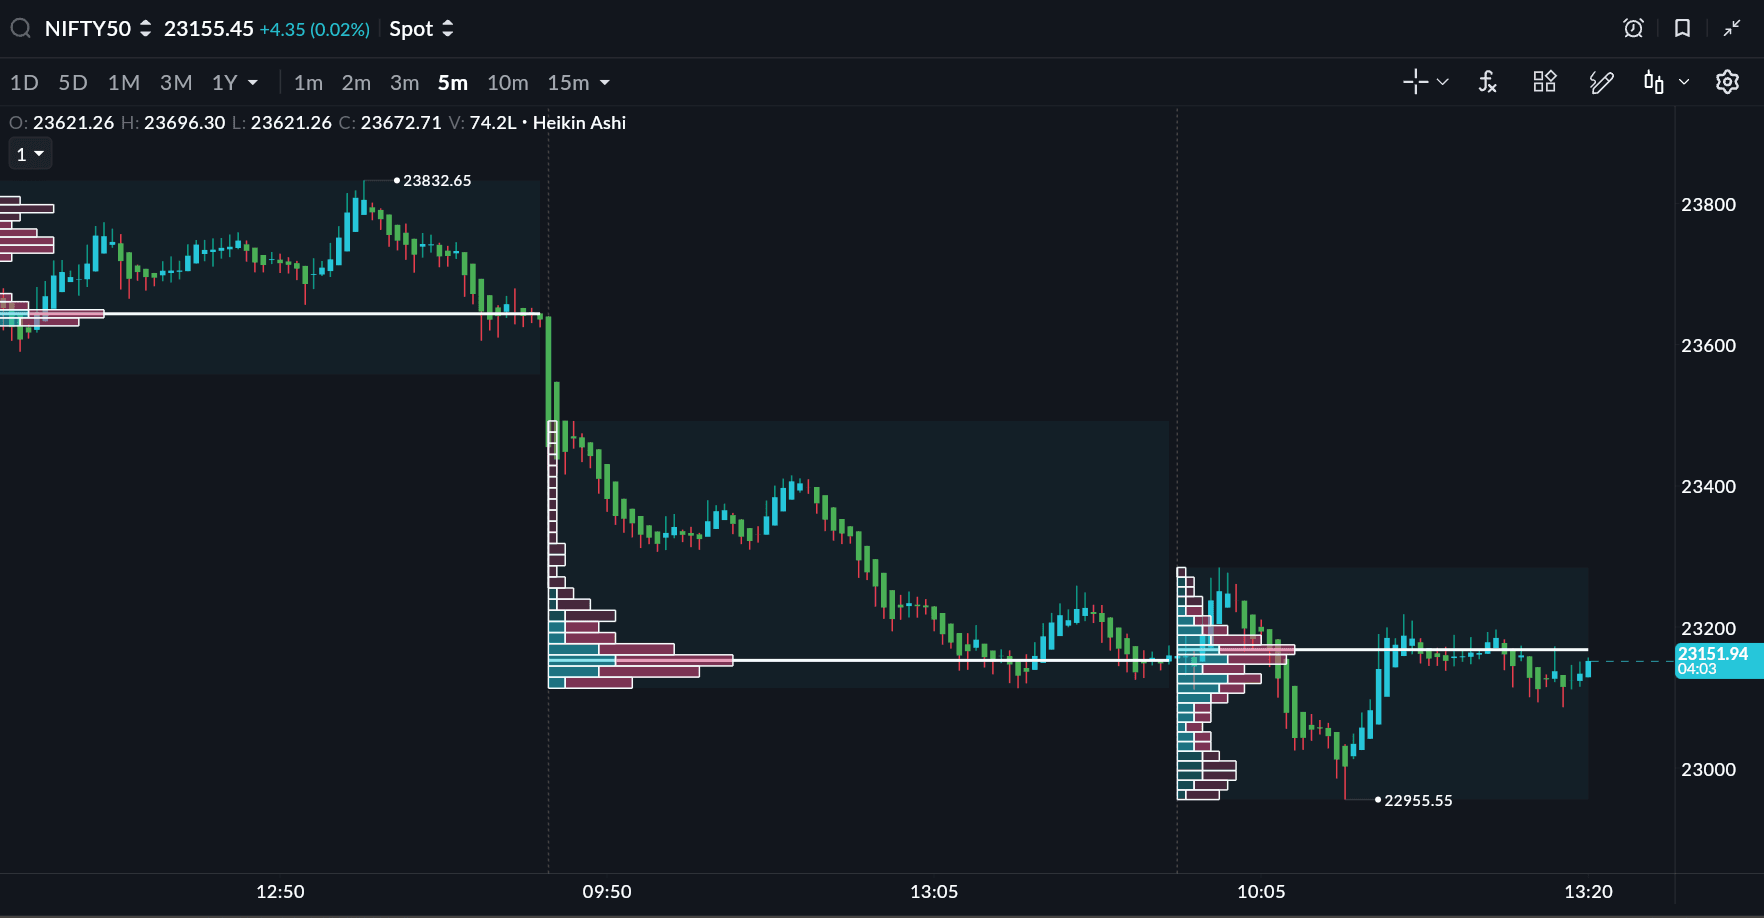
Session Volume Profile: Understanding Each Day’s Auction
Intraday traders often want to know where most trading activity occurred during the current session, not across multiple days.
For example, if Nifty spends most of the session trading around 22,100 with heavy volume, that level can become an important reference zone where price may return or react.
Session Volume Profile displays how trading volume is distributed across price levels for each individual trading session.
This allows traders to identify:
- Areas where the market spent the most time trading
- Value zones where buyers and sellers agreed on price
- Levels where price may revisit due to strong participation
Because the profile resets for each trading day, it helps traders focus on today’s market auction rather than historical averages, which can be especially useful for scalpers and intraday traders.
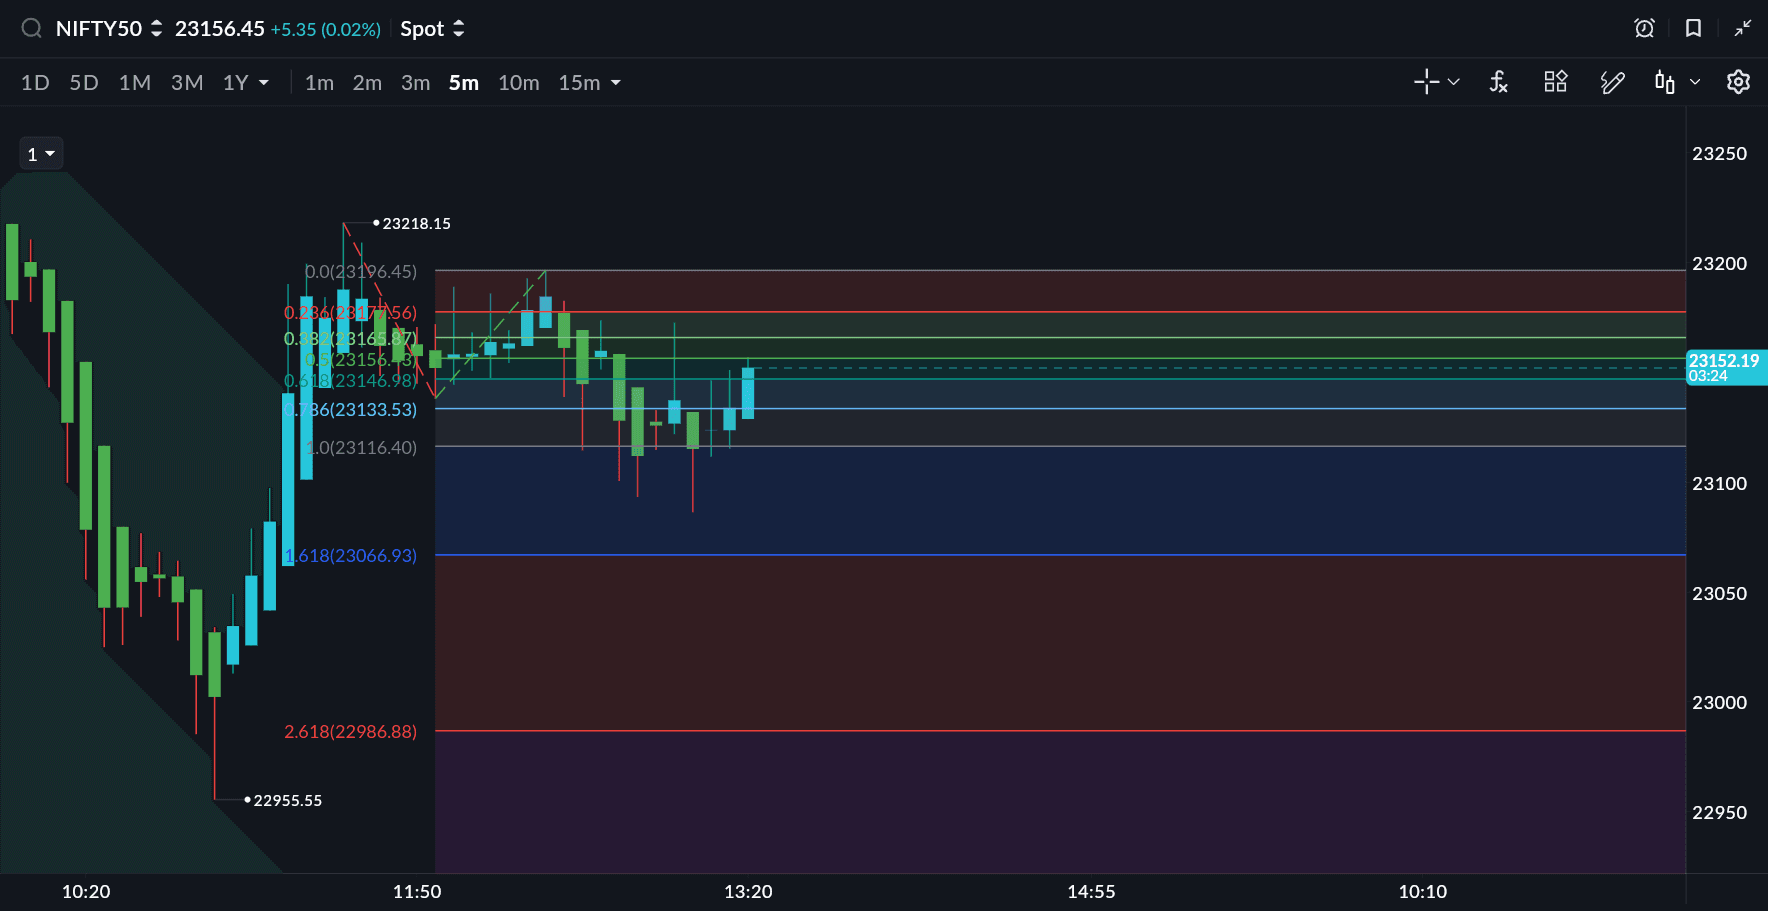
Auto Fibonacci Extension: Automated Price Targets
Fibonacci retracement and extension levels are widely used tools for identifying potential price targets and retracement zones.
However, drawing Fibonacci levels manually requires traders to correctly identify the swing high and swing low.
For instance, if a stock rallies from ₹500 to ₹600 and begins pulling back, Fibonacci levels can highlight potential retracement areas where buyers might re-enter the trend.
The Auto Fibonacci Extension automates this process.
Sahi detects the relevant swing points and automatically plots Fibonacci levels on the chart. This helps traders quickly identify:
- Potential support and resistance levels
- Possible retracement zones
- Extension targets for trending moves
By removing the manual step, traders can evaluate setups more quickly.
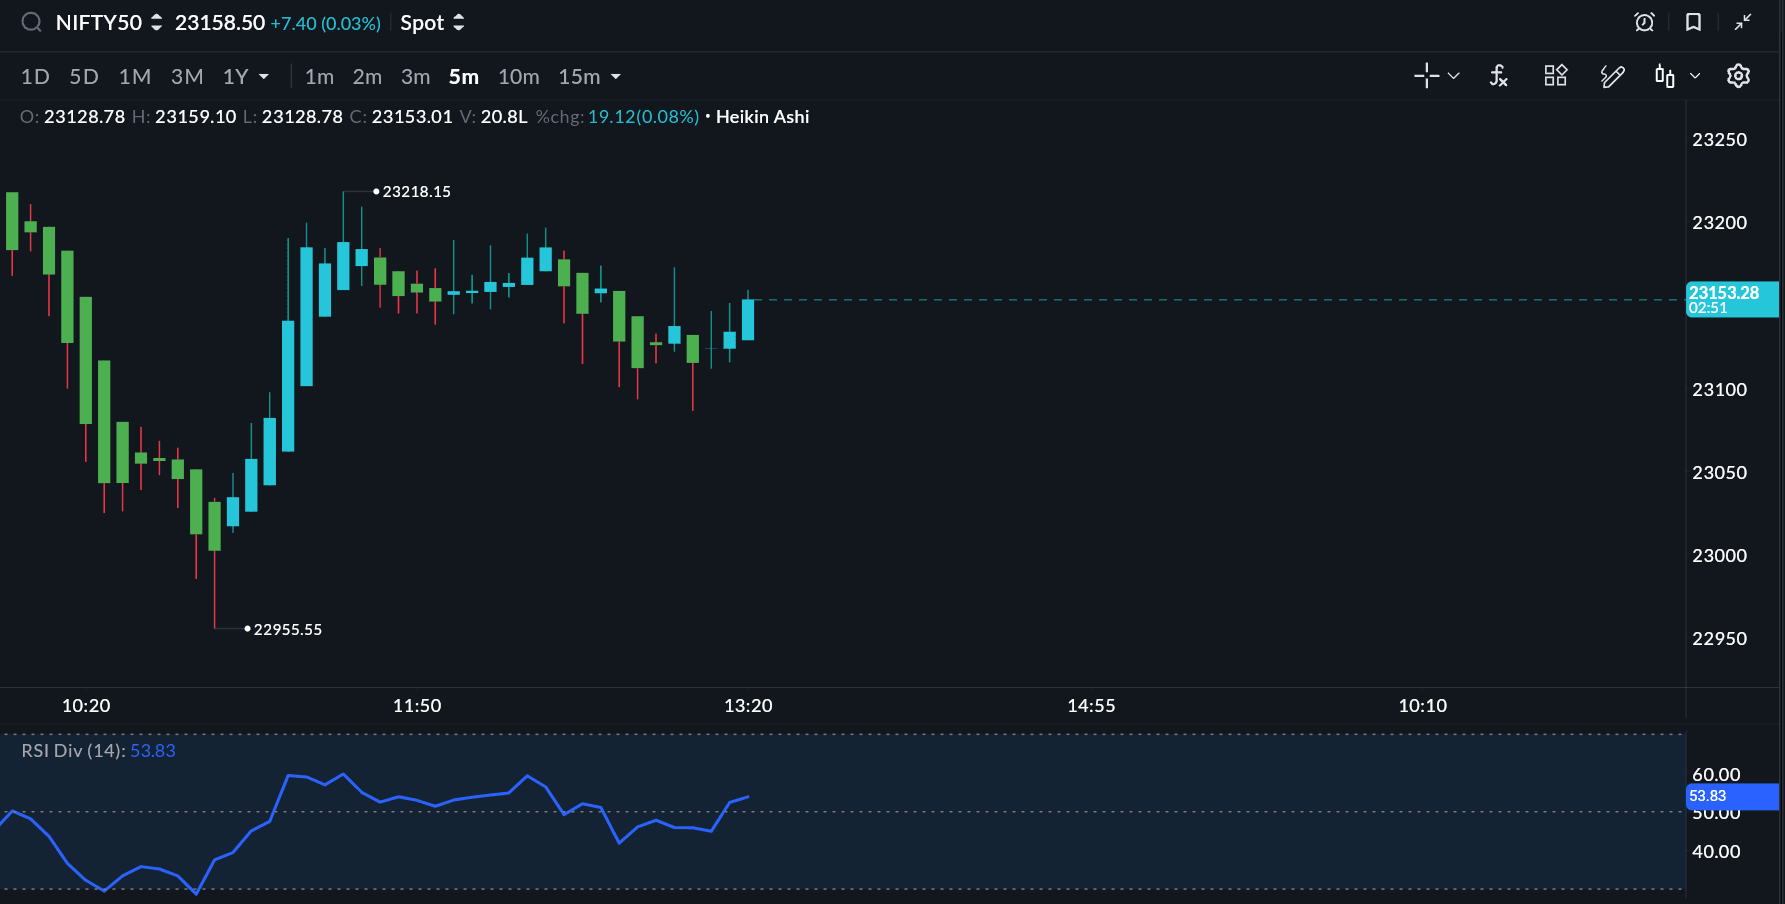
RSI Divergence: Detect Momentum Conflicts Early
One of the strongest early warning signals in technical analysis occurs when price and momentum indicators move in opposite directions. This phenomenon is known as divergence.
Sahi’s RSI Divergence indicator automatically detects these situations.
For example:
- Bullish divergence occurs when price makes lower lows while RSI forms higher lows.
- Bearish divergence occurs when price makes higher highs while RSI forms lower highs.
These signals can indicate that the current trend may be weakening.
By highlighting divergences directly on the chart, traders no longer need to manually compare price movements with RSI behaviour.
For example, if a stock continues making higher highs but RSI begins forming lower highs, it may signal weakening momentum and a possible reversal.
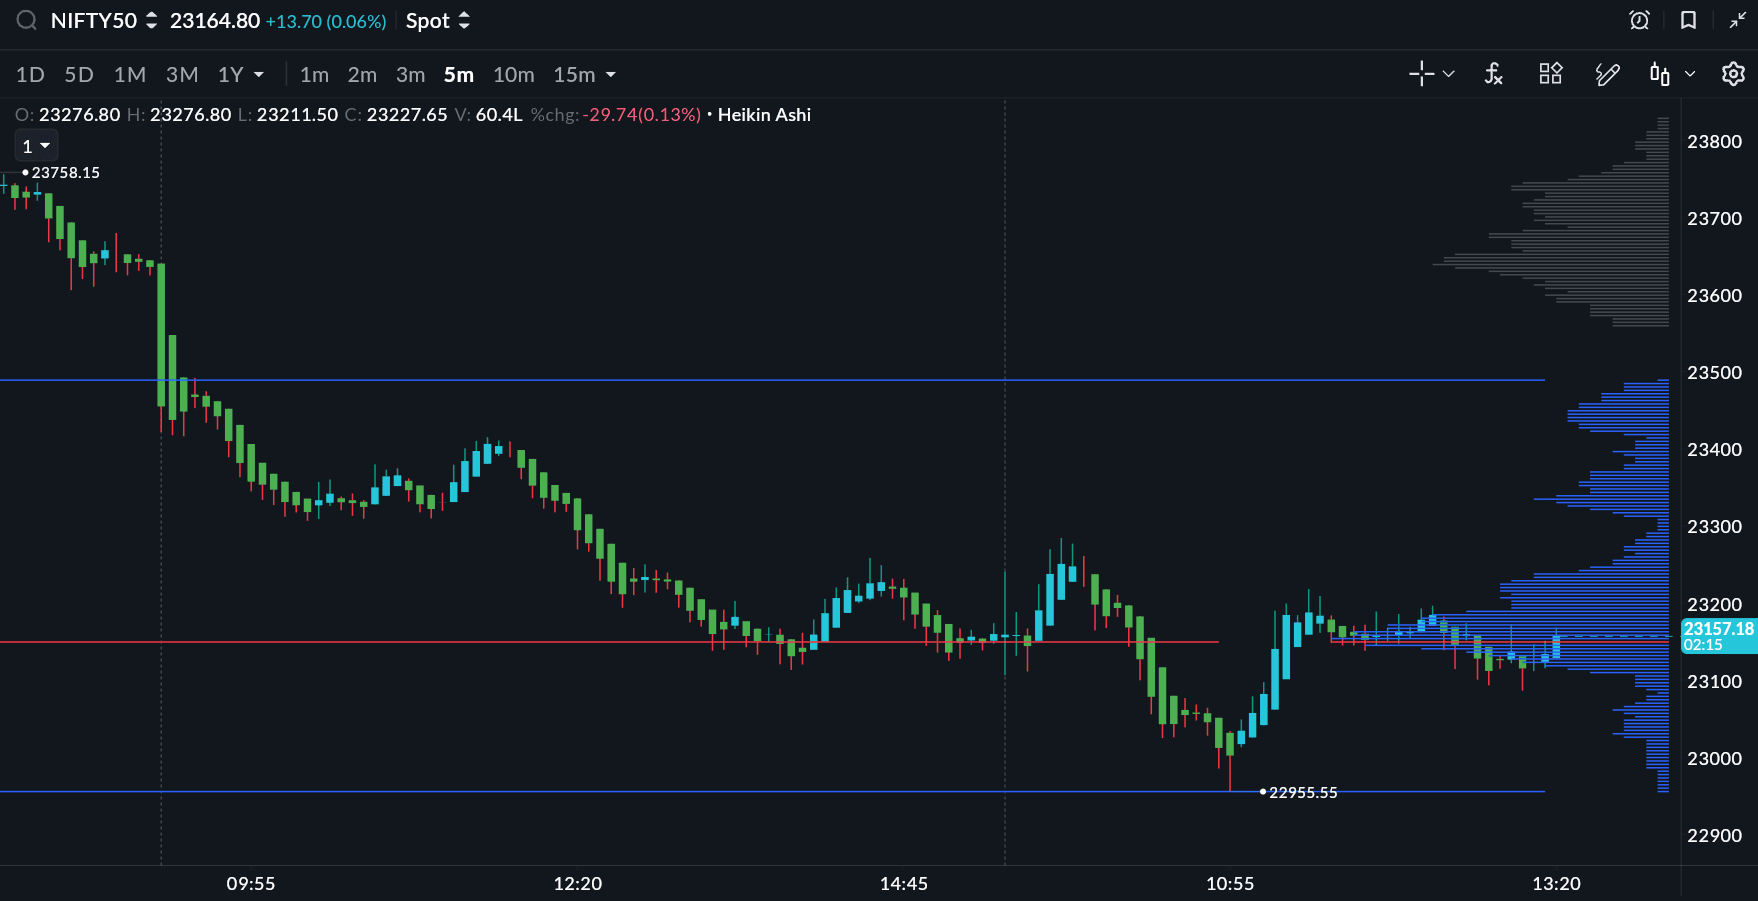
Volume Profile: Where the Market Accepted Price
Unlike traditional volume indicators that show trading activity over time, Volume Profile displays volume at each price level.
This creates a detailed view of where market participants were most active.
Important areas revealed by Volume Profile include:
- High Volume Nodes (HVN) — price levels where strong participation occurred
- Low Volume Nodes (LVN) — areas where price moved quickly
- Value areas — zones where the majority of transactions took place
These levels frequently act as support, resistance, and areas of price consolidation.
For many professional traders, Volume Profile is a core component of market structure analysis.
For example, if Nifty spends most of the trading session around 24,100 with heavy volume, traders may treat that level as a value area where the price could return.
Kaufman’s Adaptive Moving Average (KAMA)
Moving averages are widely used to identify trends, but traditional averages such as SMA and EMA can produce false signals during sideways markets.
For example, if a trending stock remains consistently above KAMA, traders may interpret the indicator as confirmation that the underlying trend remains strong.
Kaufman’s Adaptive Moving Average (KAMA) addresses this by adjusting its sensitivity based on market volatility.
When markets trend strongly, KAMA responds quickly and tracks price closely.
When markets become choppy, it smooths out noise and reduces unnecessary signals.
This makes KAMA particularly useful for traders who want to:
- Follow strong trends more efficiently
- Filter out market noise
- Avoid frequent false signals in sideways conditions
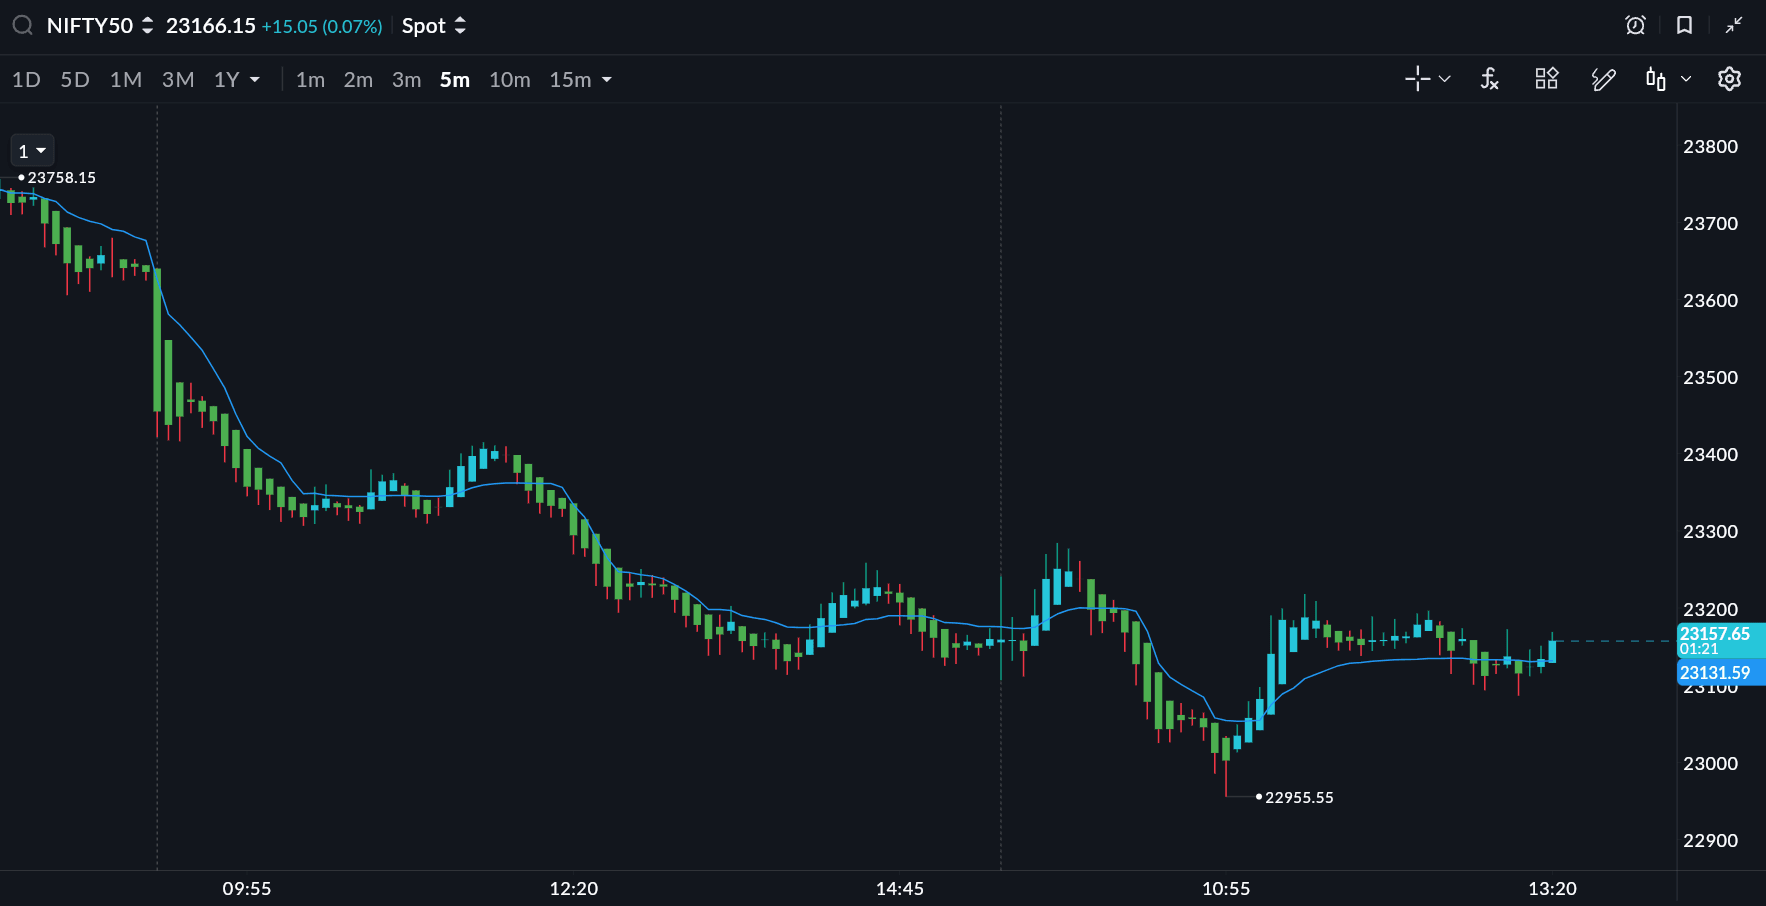
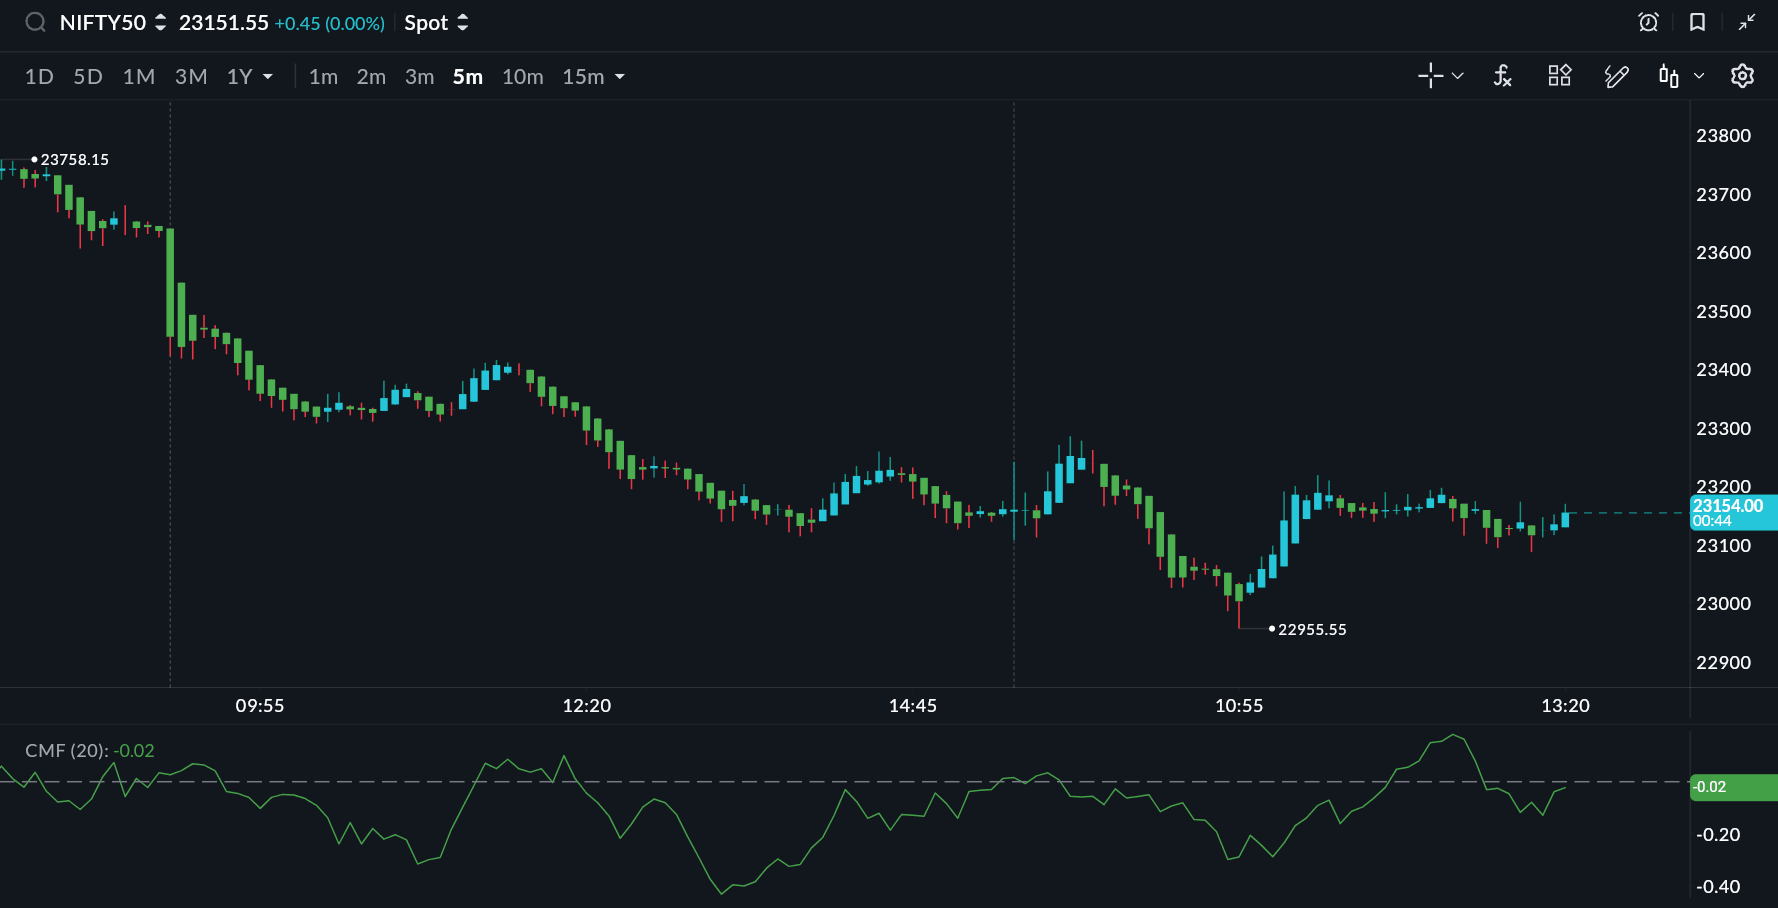
Chaikin Money Flow: Detect Accumulation and Distribution
Understanding whether capital is entering or leaving a security can provide valuable insight into future price movement.
The Chaikin Money Flow (CMF) indicator combines price and volume data to measure whether money is flowing into or out of a stock or index.
When CMF is positive, it suggests accumulation.
When CMF is negative, it indicates distribution.
Traders often use CMF to confirm:
- Strength behind a price rally
- Weakness before potential declines
- Institutional participation in a move
For example, if a stock begins rising while CMF also turns positive, it may suggest that buying pressure is supporting the move.
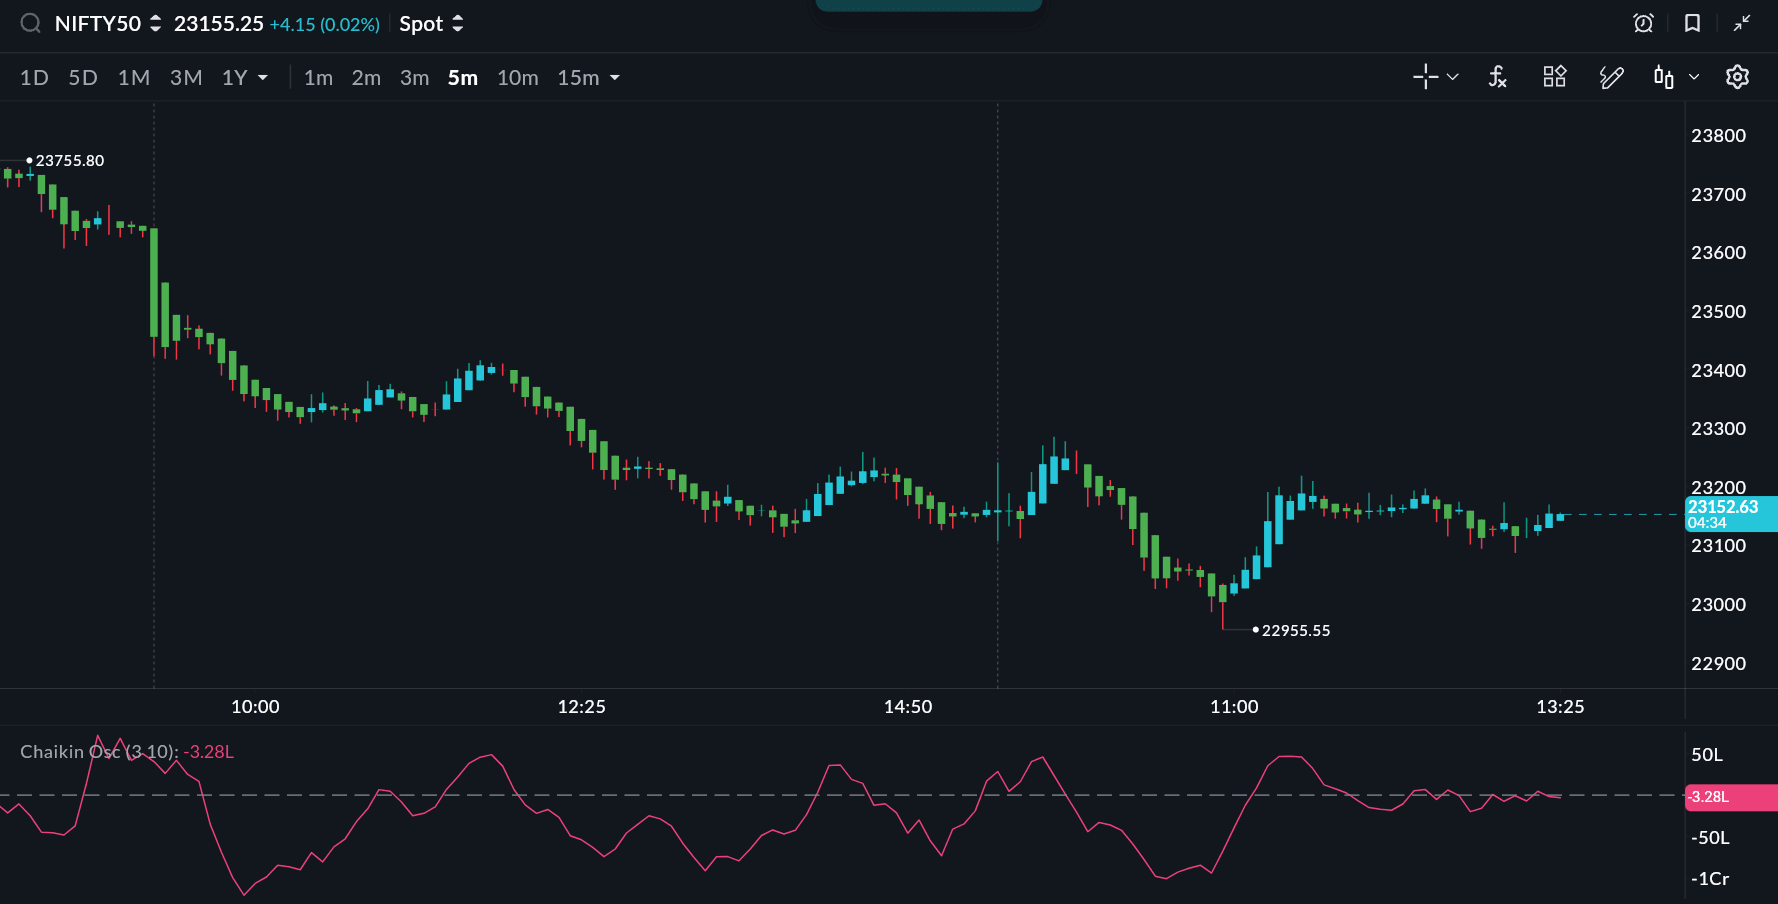
Chaikin Oscillator: Early Signal of Money Flow Momentum
The Chaikin Oscillator builds on the accumulation and distribution concept but focuses on the momentum of money flow.
Rather than simply showing whether accumulation is happening, the oscillator measures how quickly it is accelerating or slowing down.
This can sometimes provide earlier signals of trend shifts than traditional indicators.
Traders often monitor the Chaikin Oscillator to detect:
- Emerging buying pressure
- Early signs of distribution
- Changes in institutional participation
For instance, if the oscillator begins rising before the price breaks resistance, it may suggest increasing buying pressure behind the move.
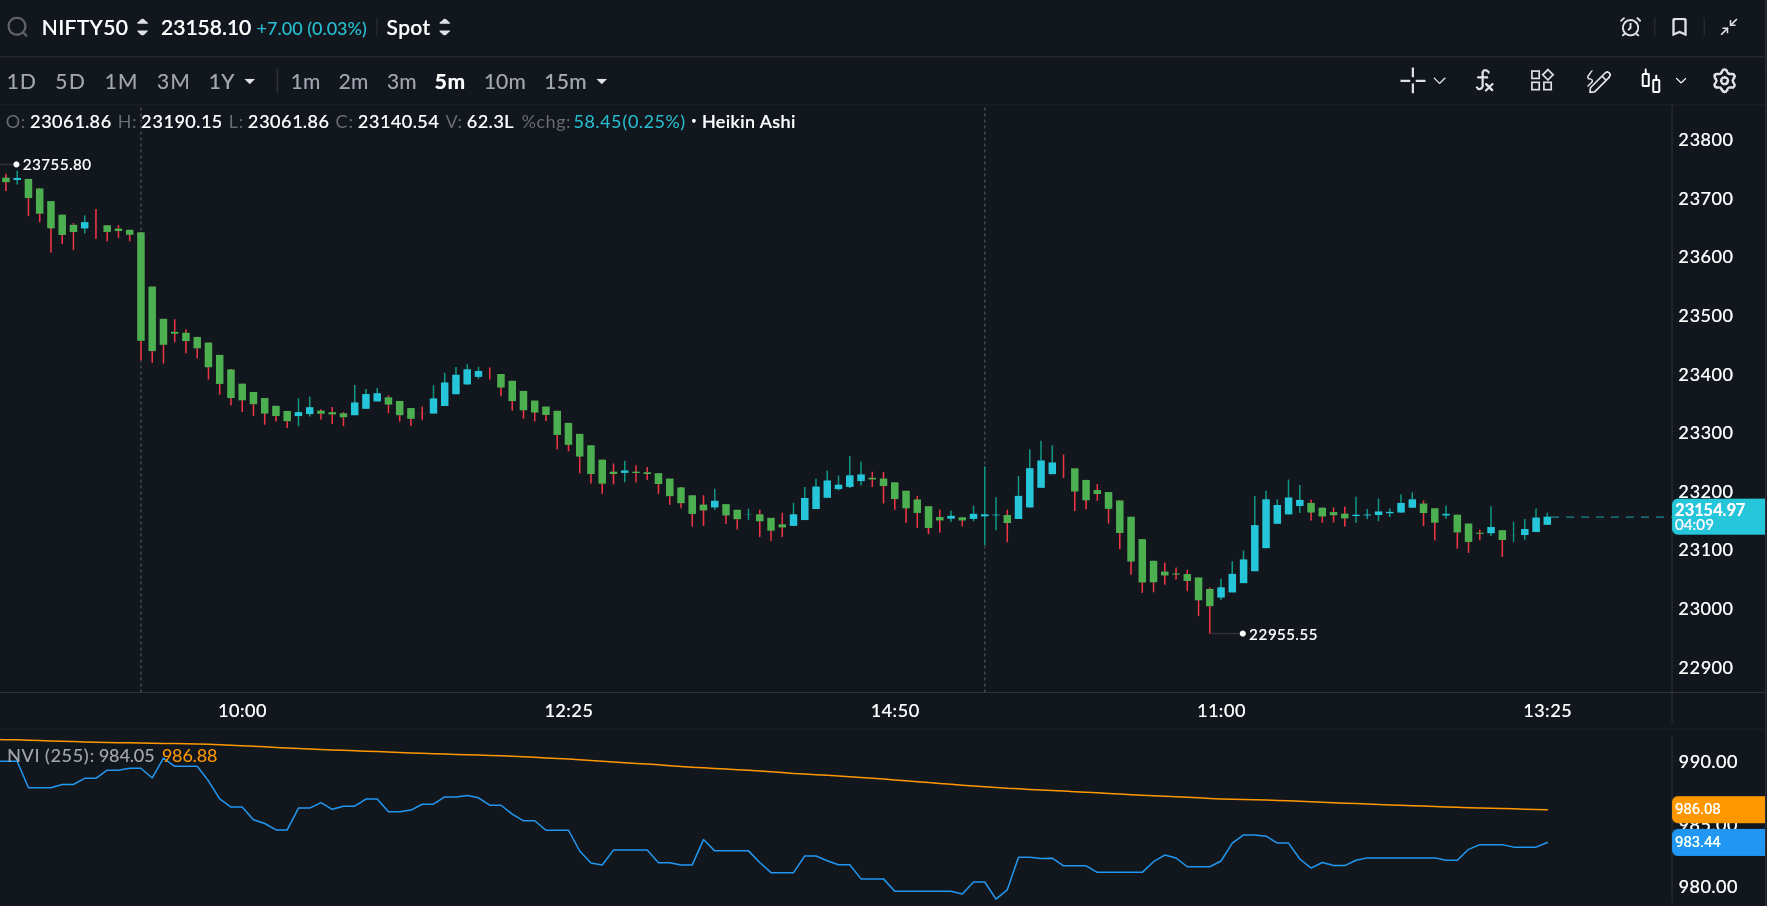
Negative Volume Index: Tracking Smart Money Behaviour
The Negative Volume Index (NVI) is based on an interesting market observation: institutional investors often trade more actively on lower-volume days, when retail activity is lower.
NVI only updates when daily trading volume decreases.
If the index rises during these periods, it may indicate quiet accumulation by larger market participants.
Because of this, NVI is often used as a proxy for understanding what “smart money” might be doing behind the scenes.
For example, if a stock gradually rises on declining volume while NVI trends upward, traders may interpret it as subtle institutional accumulation.
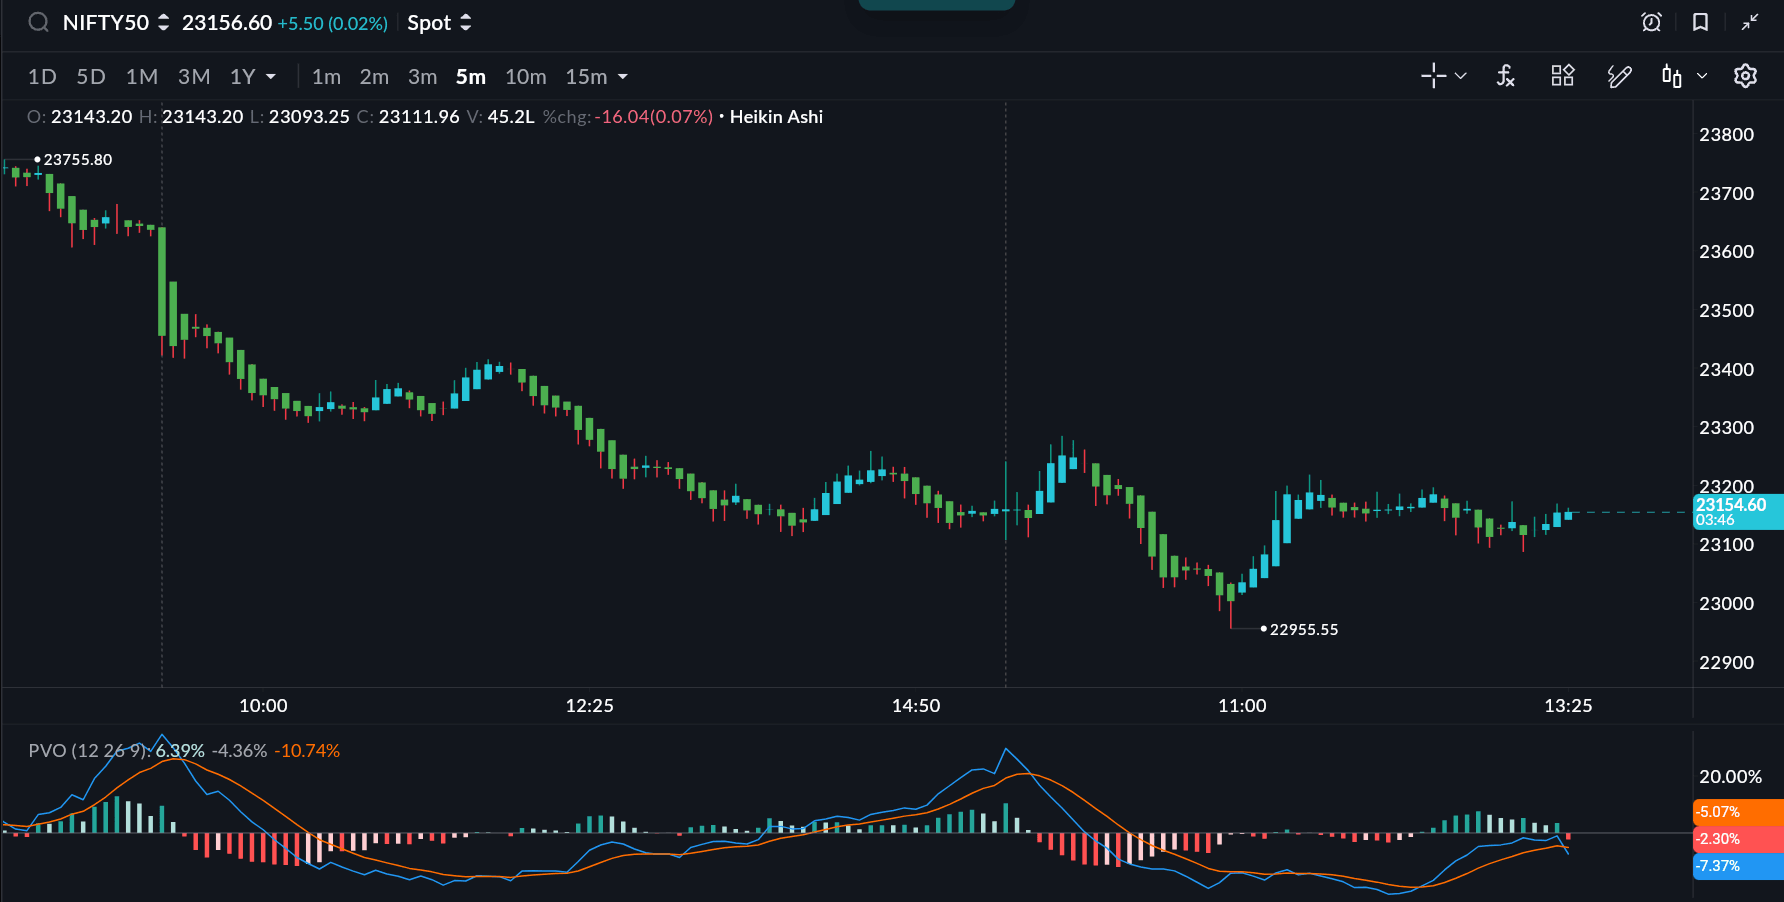
Percentage Volume Oscillator: Measuring Volume Momentum
Volume expansion frequently precedes large price movements. The Percentage Volume Oscillator (PVO) measures the difference between two volume moving averages and expresses it as a percentage.
This allows traders to identify whether trading activity is:
- Increasing significantly
- Declining relative to historical averages
- Supporting a potential breakout
When PVO rises sharply, it often signals growing participation in the market.
For instance, if a stock begins breaking out of a consolidation zone while PVO spikes upward, it may indicate strong volume participation behind the move.
A Major Upgrade to the Sahi Charting Experience
With the addition of these 13 indicators, Sahi charts now offer a significantly deeper analytical framework for traders by covering three critical dimensions of market analysis: price structure, momentum, and volume behaviour.
Many of these tools automate tasks that traders previously had to perform manually such as drawing trendlines, identifying divergences, or locating Fibonacci levels.
The result is a charting environment where traders can analyze markets faster and focus more on decision-making rather than setup.
As markets become more complex and trading strategies evolve, having the right analytical tools becomes increasingly important. This update moves Sahi charts closer to becoming a complete trading analysis workspace for modern traders.