
AI Market Trends and Execution Marks
4 min read
Published 30 Oct 2026, 10:00 PM ISTUpdated Sat, 31 Oct, 2026, 05:30 AM IST
Summary
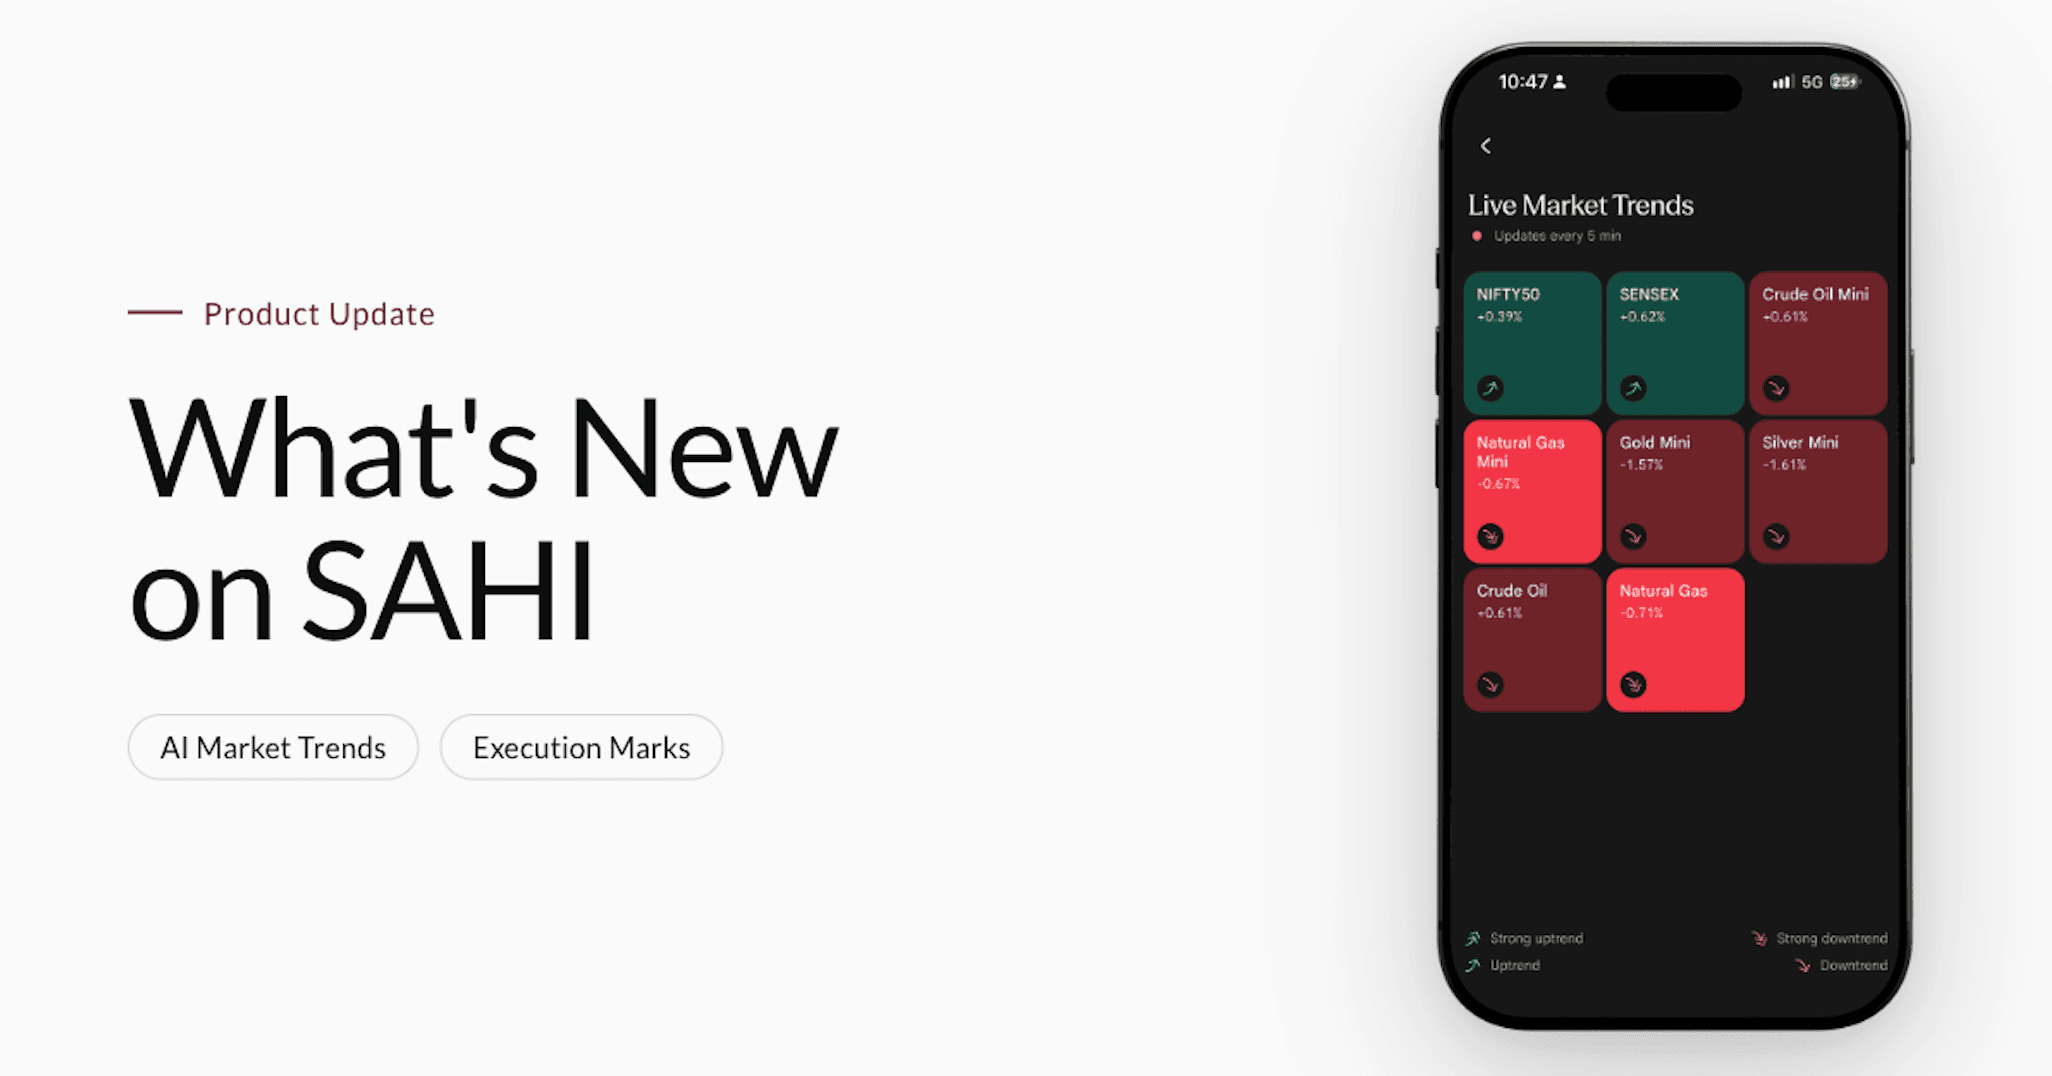
AI Market Trends shows the SAHI AI trend for top indices and commodities. Execution Marks show your filled orders as buy and sell arrows on your chart.
Trade Smarter, Not Harder
Receive market breakouts, AI insights, and trading strategies directly in your inbox.
What's New on SAHI
Here's what's new on SAHI this week.
Live Market Trends
If you trade F&O, you probably check what is moving outside your own segment too. If you trade commodities, you probably want one place to read the trend across instruments instead of opening them one by one.
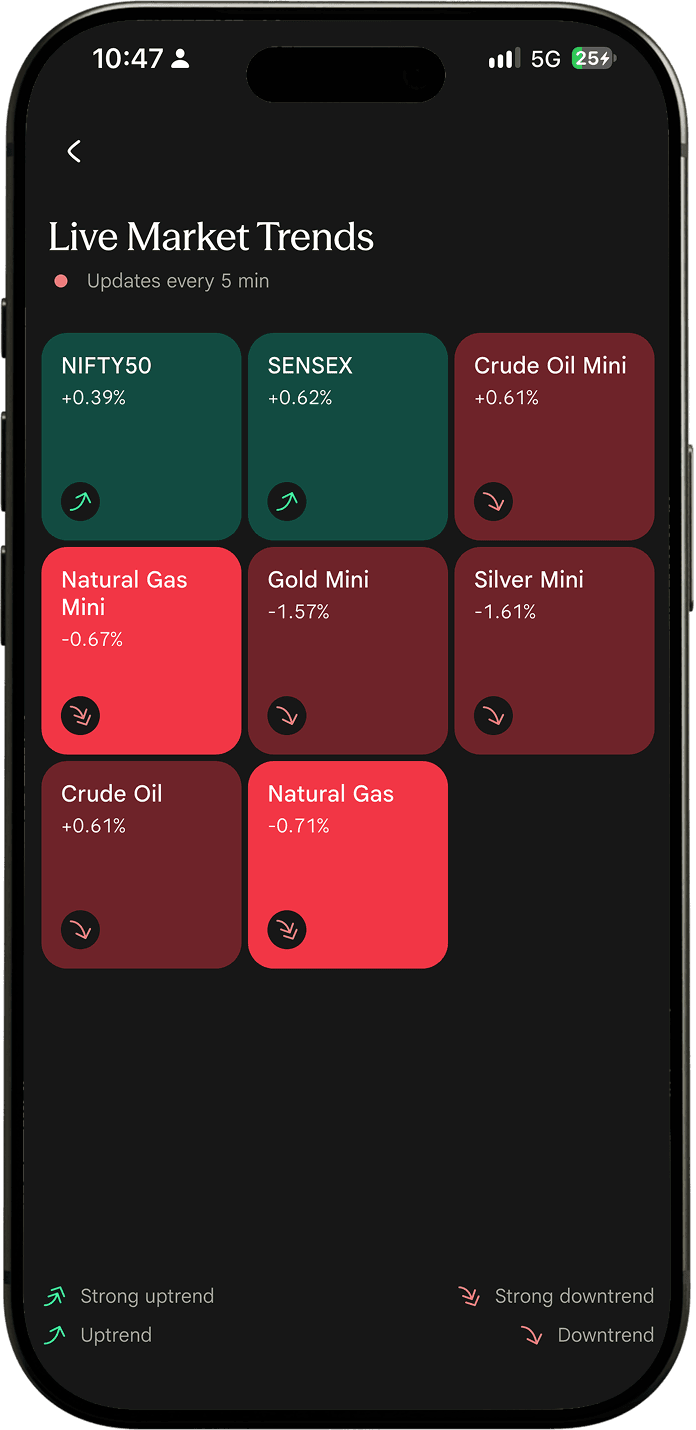
Live Market Trends does that. It shows the SAHI AI trend for top indices like NIFTY50 and SENSEX, and commodities such as Crude Oil, Gold, Silver, Natural Gas and more, right on your F&O and Commodities tabs.
How to read it
Each instrument shows its name, its percentage change and a trend marker. The colour tells you where the trend stands:
- Strong uptrend: dark green
- Uptrend: light green
- Sideways: grey
- Downtrend: light red
- Strong downtrend: red
Every instrument also carries an arrow, so you never have to rely on colour alone. A legend sits at the bottom of the widget.
Why colour and percentage can disagree
You may see a green instrument with a negative percentage change. That is not a mistake. The trend is a read of recent movement, recalculated every 5 minutes. The percentage change is measured against the previous close. They answer different questions.
When trends are available
Each market has its own timing. If a market has not opened for trends yet, or has already closed, you see its price change without a trend, with a note that tells you why. If a trend is not available for a single instrument during the session, it is marked Illiquid. In the final days before expiry, more instruments are added to the list, and an Expiry tag shows on the day itself.
Where to find it
Open the F&O or Commodities tab. The widget shows the first few instruments. Tap View All for the full list, and tap any instrument to open its page. The trend is recalculated every 5 minutes, and the latest read loads when you open the tab.
Available in the SAHI app.
Execution Marks
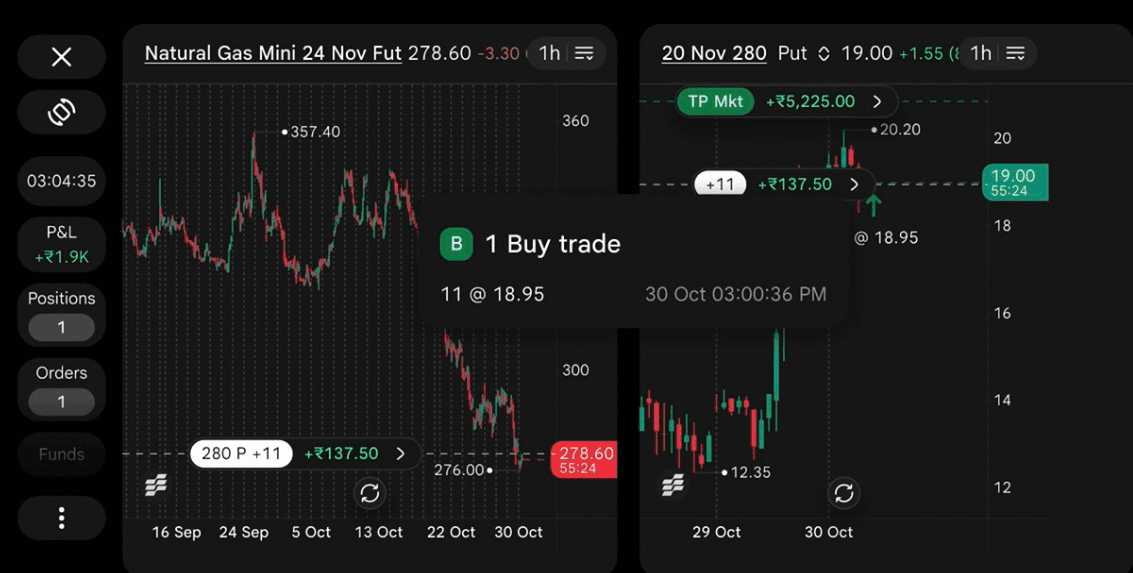
After you trade, you want to see exactly where it happened on the chart. Execution Marks put it there.
Every filled order now shows on your chart as an arrow. A green up arrow sits just below the candle for a buy. A red down arrow sits just above the candle for a sell. Each arrow comes with the quantity and price of that trade, in the format quantity @ price.
One mark for every trade
Marks are drawn for each trade, not for each order. If one order was filled in four parts, you see four marks, each with its own quantity and price. They sit on the candle where the fill happened, so you read your real entry and exit points, not an average that may never have traded.
What you should know
- Only filled orders create marks. Cancelled and rejected orders leave nothing on the chart.
- Marks show for the current trading day and reset every day.
- They stay on your chart after you refresh, switch devices or change the timeframe.
- They work across chart types, including Heikin Ashi and Renko.
- Marks are read-only. They cannot be dragged, edited or deleted.
How to turn it on
Go to Chart Settings, then View on Chart, and turn on Execution Marks. Turn on Execution Labels to see the quantity and price next to each arrow. Switch labels off any time and the arrows stay.
Update to the latest version to start exploring.
For educational purposes only. Not investment advice.
FAQs
Recent blogs

Jio Platforms IPO: Everything Investors Need to Know Before Investing
/Posted 3 weeks ago
Anchored VWAP is Now Live on SAHI Charts
/Posted 1 month ago
Add Sahi as a Preferred Source on Google
Click the link, confirm the box next to sahi.com is checked — ignore any other results.