
Renko Chart and Step Line Charts Are Now on Sahi
Quick Answer
Sahi now supports Renko and Step Line charts across all modes, including Scalper Mode. Renko only prints a brick when price moves a fixed amount, time is irrelevant. Step Line holds price flat between closes instead of drawing a diagonal, so the chart shows what price actually was, not what it might have been in between.
What's new
Renko and Step Line charts are now available on Sahi. Both work across all instruments and modes, including Scalper Mode, and all your favourite indicators still apply.
Renko chart
What is a Renko chart?
Renko ignores time. Every other chart type, candlestick, line, or bar, prints a new element at fixed time intervals. Renko doesn't. A new brick appears only when the price moves by a fixed amount you set. If price drifts sideways for two hours, the chart shows nothing. It's waiting for the price to actually do something.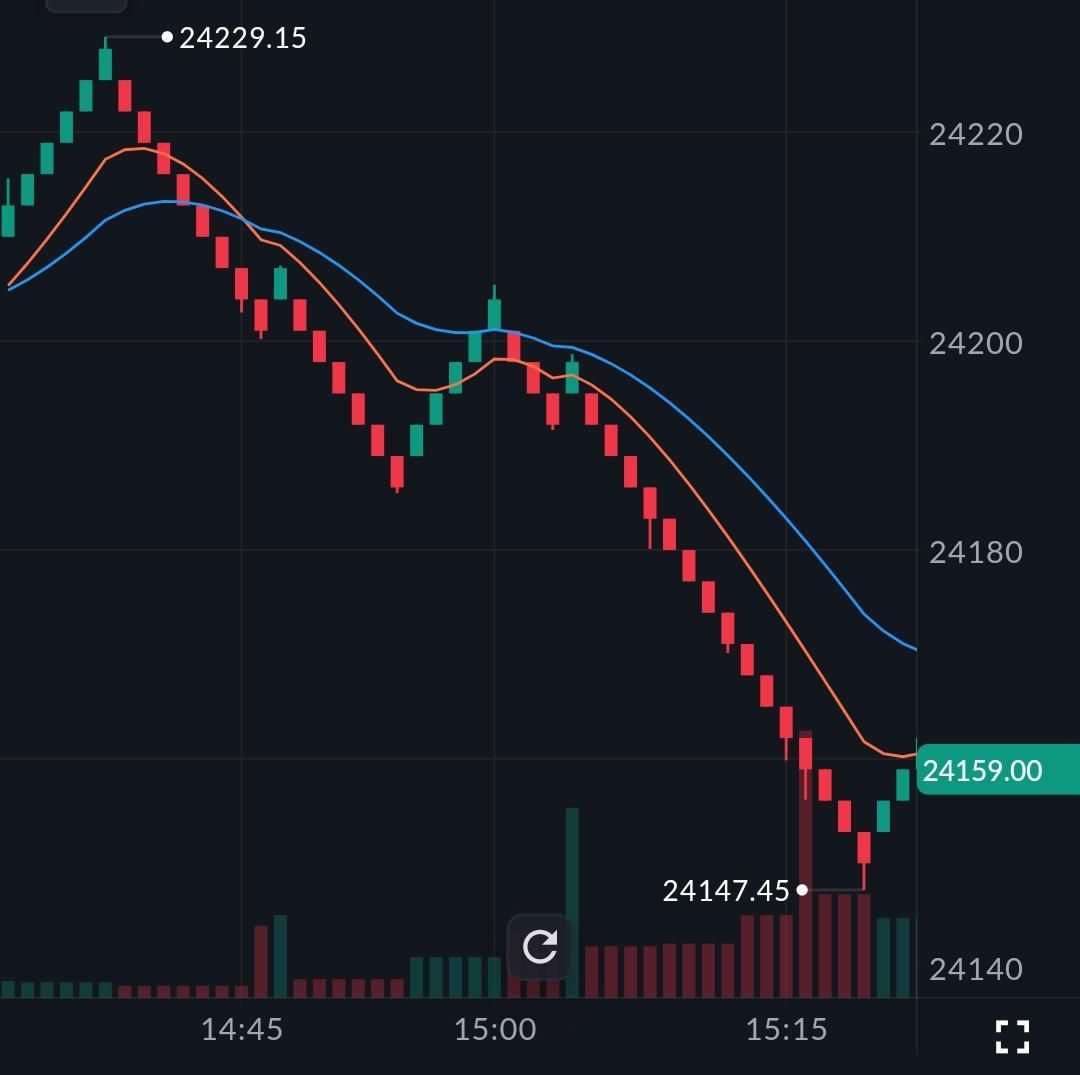
The name is from the Japanese word for brick, which is exactly what each unit looks like. Up-brick when the price rises by the set amount. Down-brick when it falls. Every brick is the same size, so what you're reading is momentum, not a clock.
On Sahi, the Renko chart is available on all charts and all modes, including Scalper Mode. Indicators work the same way they do on a candlestick chart.
When it's worth using
A candlestick chart during a choppy session is full of information that isn't useful. Renko skips it. Sideways movement doesn't produce bricks, it produces nothing. A trend looks like a clean run of bricks going in one direction. A reversal is obvious. There's no bar you have to interpret.
This matters most for trend trading and scalping. If your strategy is trying to stay in a move and not get whipsawed by noise, Renko gives you a cleaner read. Indian markets are often choppy in the first half-hour and around events, Renko can cut through that.
In Scalper Mode specifically, it gives you something concrete: every brick is the same price movement. You can build entry and exit rules around brick count or direction change, which is harder to do on candlesticks where every bar looks different.
How to use the Renko chart on mobile
Step 1: Open the chart for the stock or contract you want.
Step 2: Tap the Settings icon.
Step 3: Select Renko from the chart type options.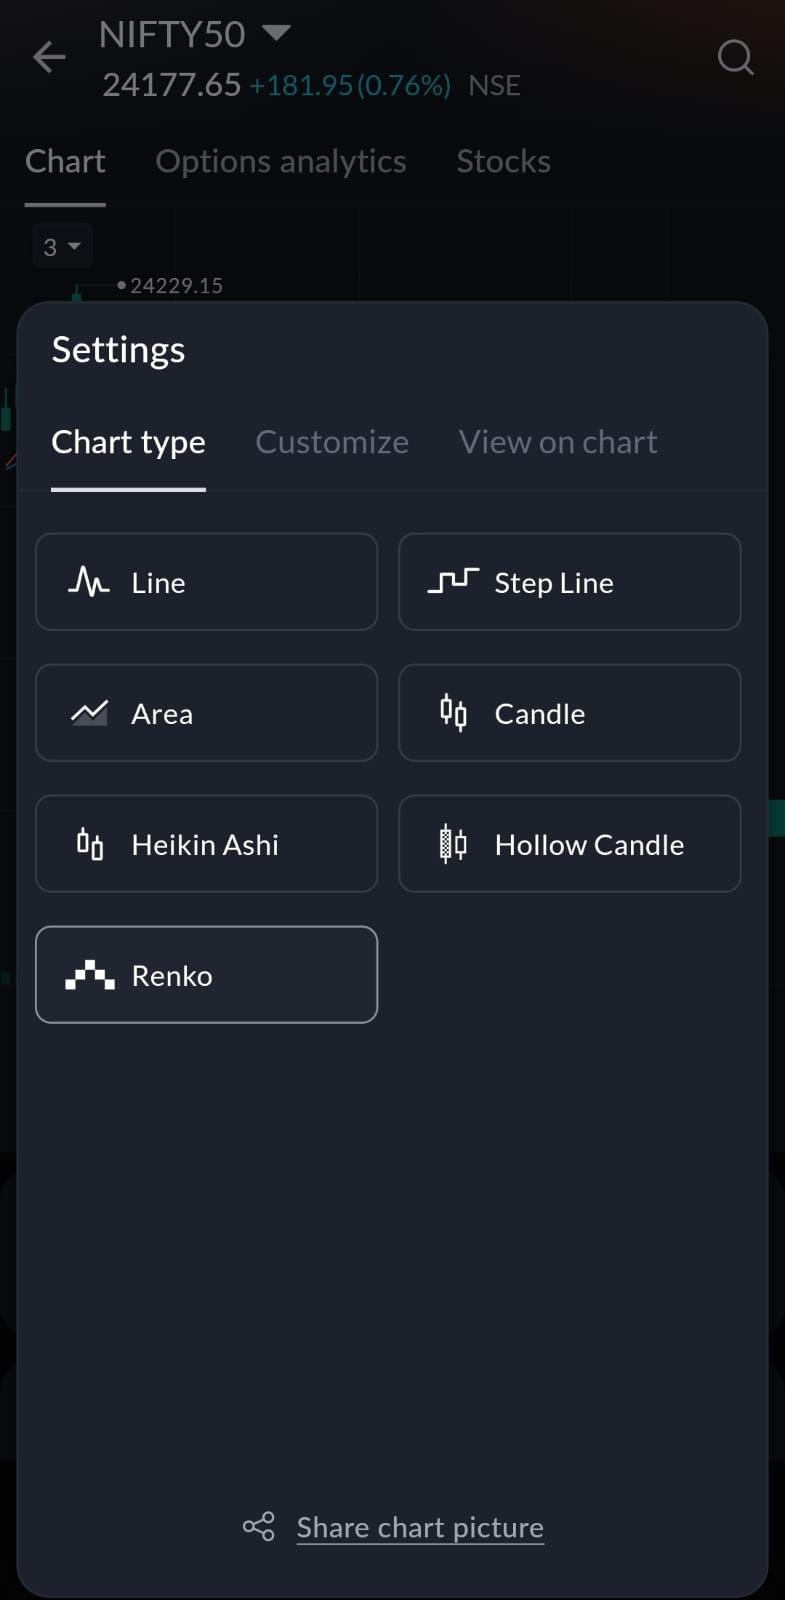
How to use the Renko chart on web
Step 1: Open the chart for the stock or contract you want.
Step 2: Click the chart type icon at the top right.
Step 3: Select Renko.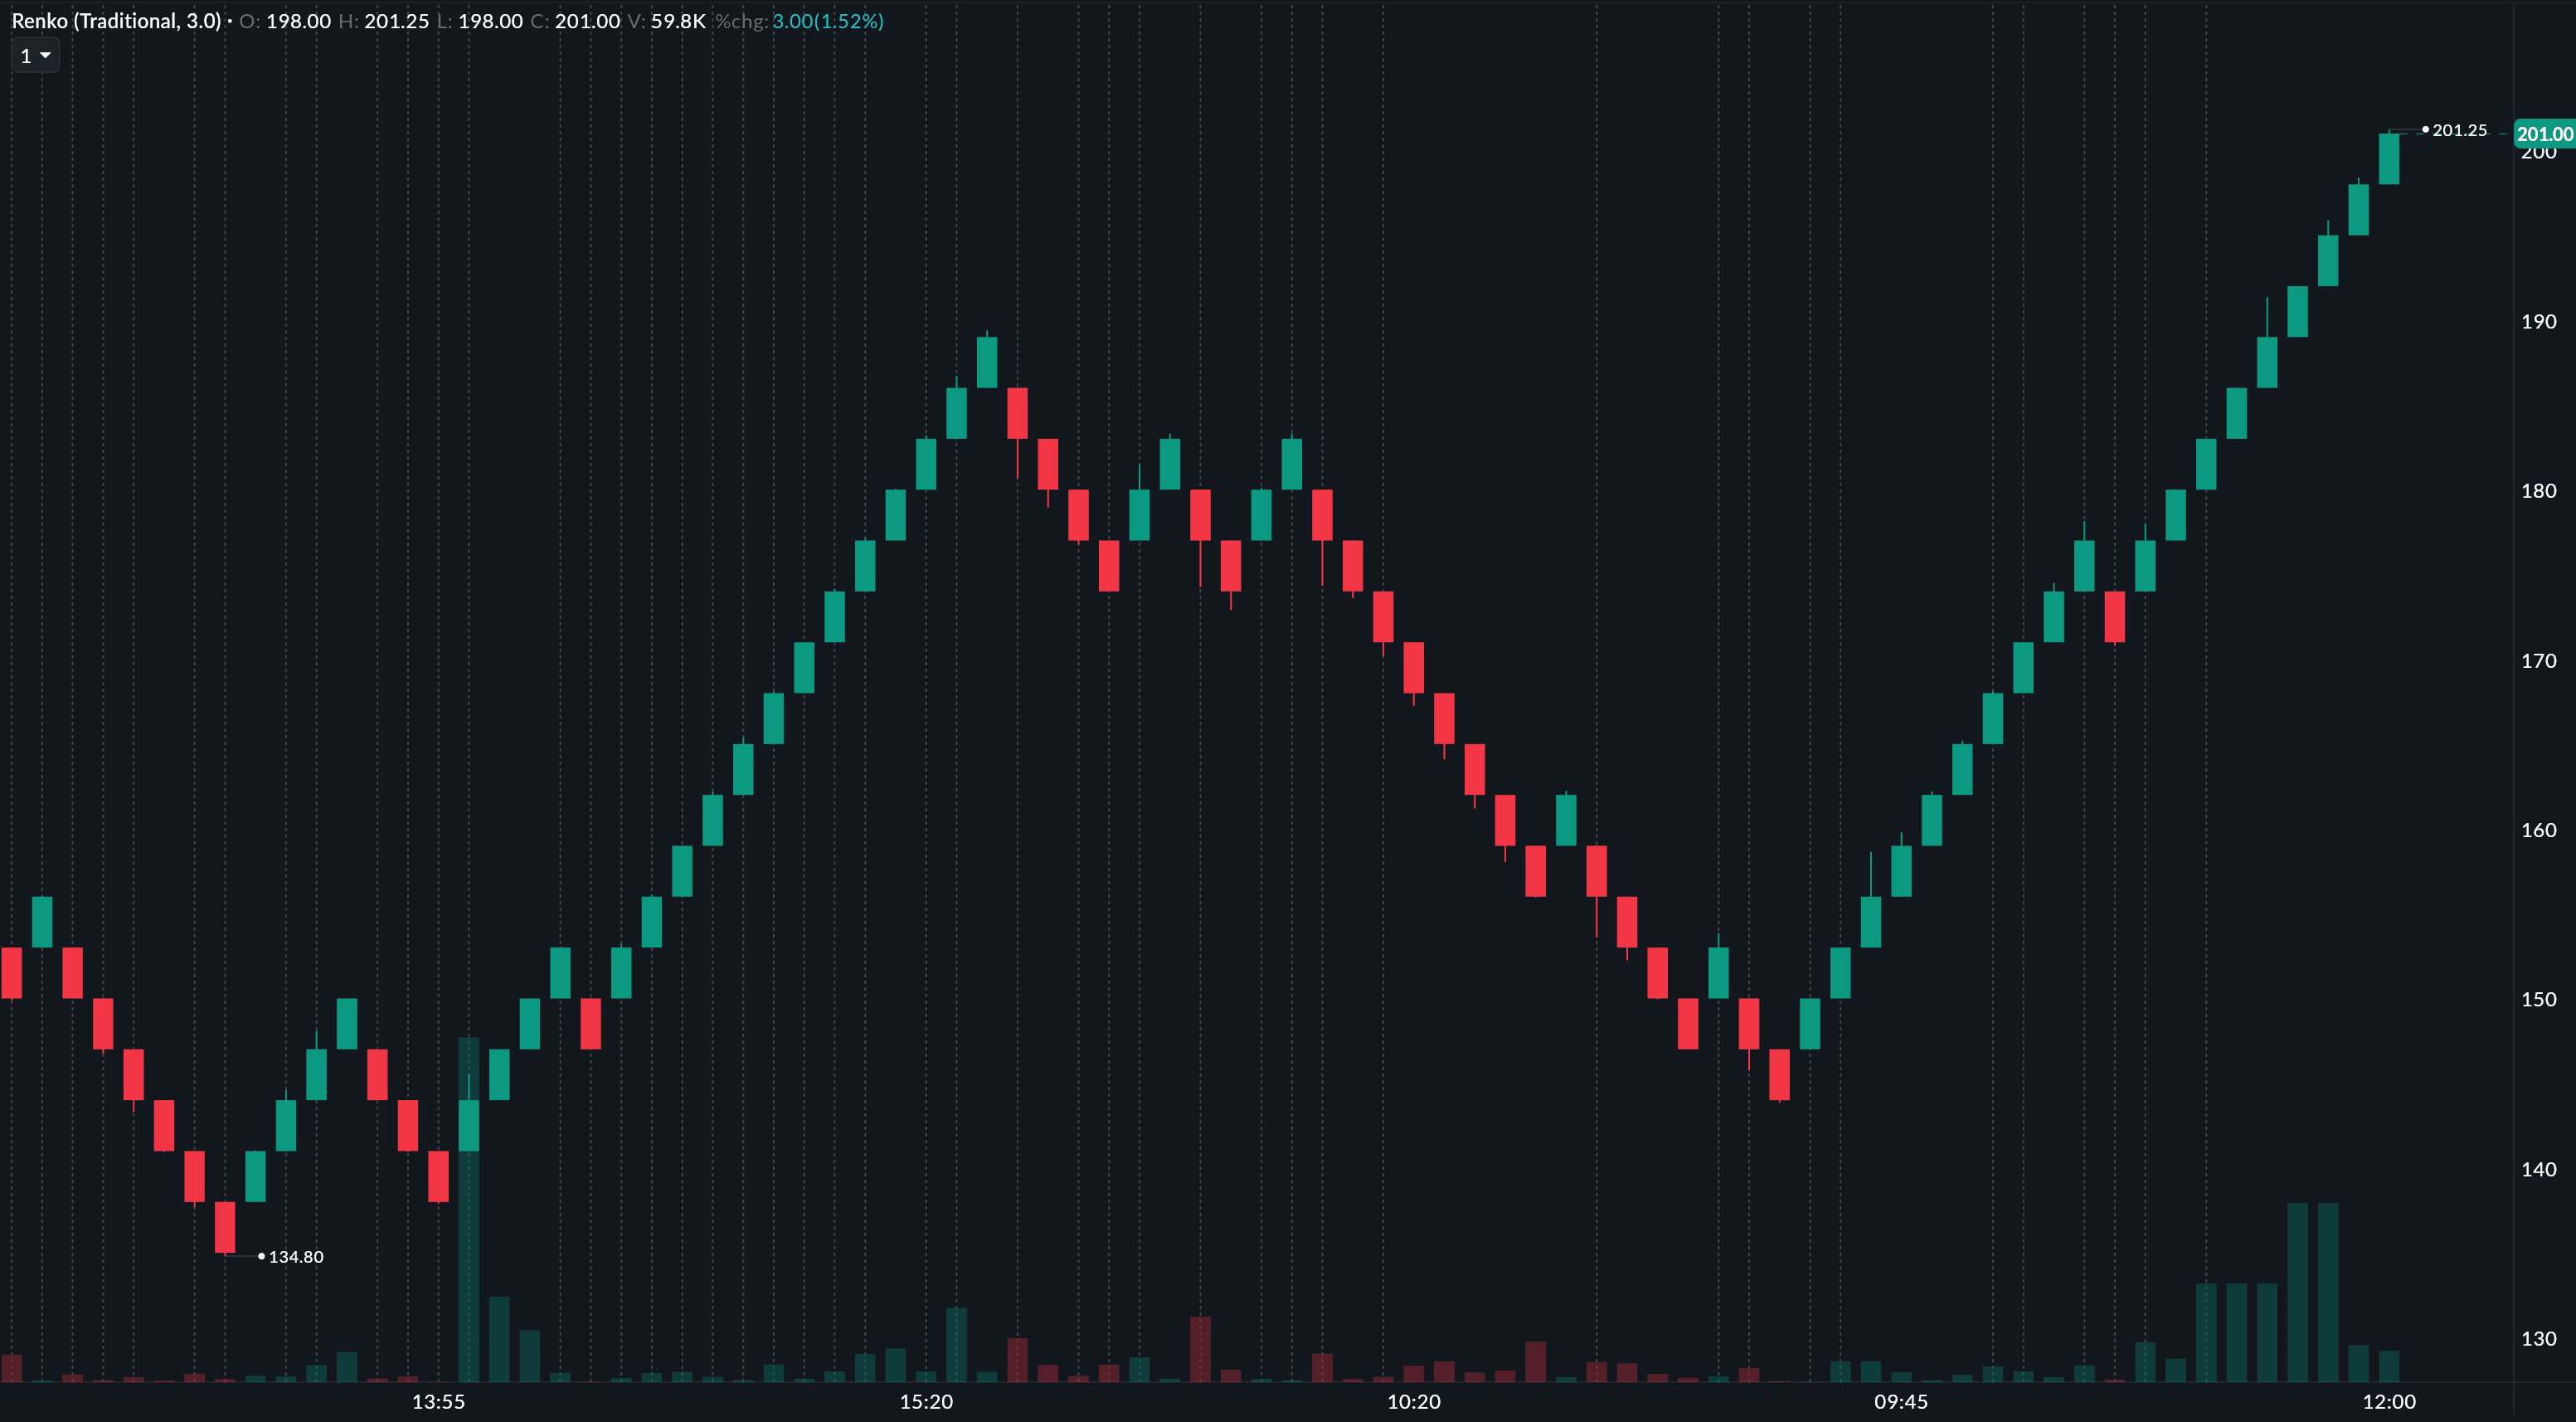
Step Line chart
What is a Step Line chart?
A Step Line chart connects price points the way a staircase works rather than the way a ramp works. Between two closes, a regular line chart draws a diagonal, implying the price moved gradually through every value in between. A Step Line holds the current close flat until the next close arrives, then jumps straight to it.
The difference sounds minor but matters in practice. If a stock closed at 100 then 105, a standard line implies a smooth rise through 101, 102, 103, and 104. None of that happened. Step Line skips the implication, 100, then 105, with a clear step between them.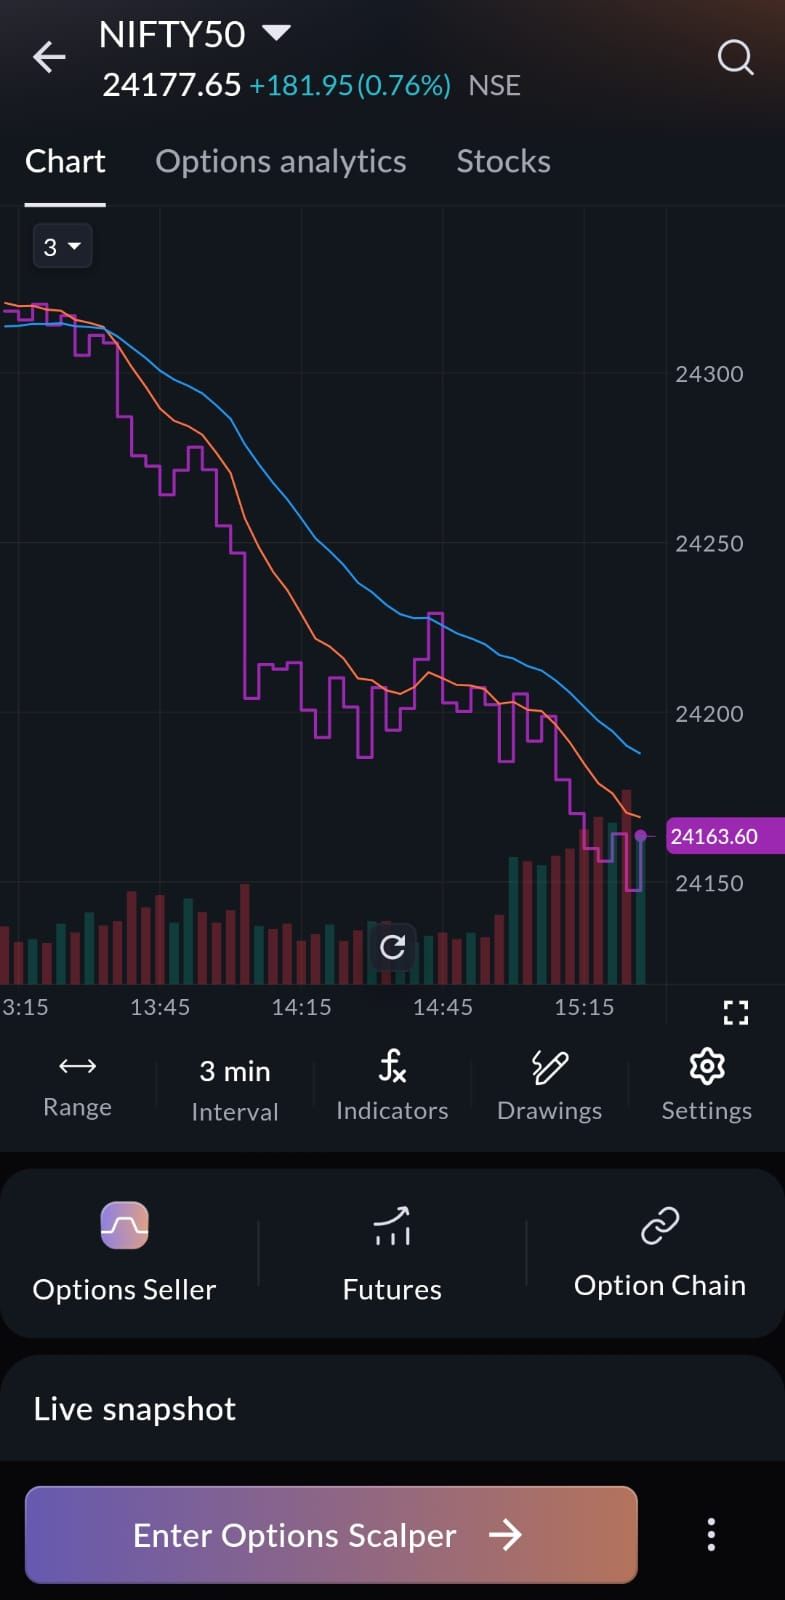
When it's worth using
Options traders tend to notice this most. Premiums move in discrete ticks; they don't glide between values. A Step Line chart reflects that. You can see what the premium actually was at each point in a session and where it stayed before it moved.
For range traders, the flat portion of each step shows how long price sat at a given level. A price that closed at the same level for five sessions running produces a long visible flat line, easy to spot compared to a single point on a diagonal. Support and resistance congestion zones show up this way too: multiple steps at the same price make that level obvious in a way a standard line chart doesn't.
It's a small change from a regular line chart, but if you've ever found yourself wondering what the actual price was at a given moment, not the interpolated version, Step Line answers that directly.
How to use Step Line on mobile
Step 1: Open the chart for the stock or contract you want.
Step 2: Tap the Settings icon.
Step 3: Select Step Line from the chart type options.
How to use Step Line on web
Step 1: Open the chart for the stock or contract you want.
Step 2: Click the chart type icon at the top right.
Step 3: Select Step Line.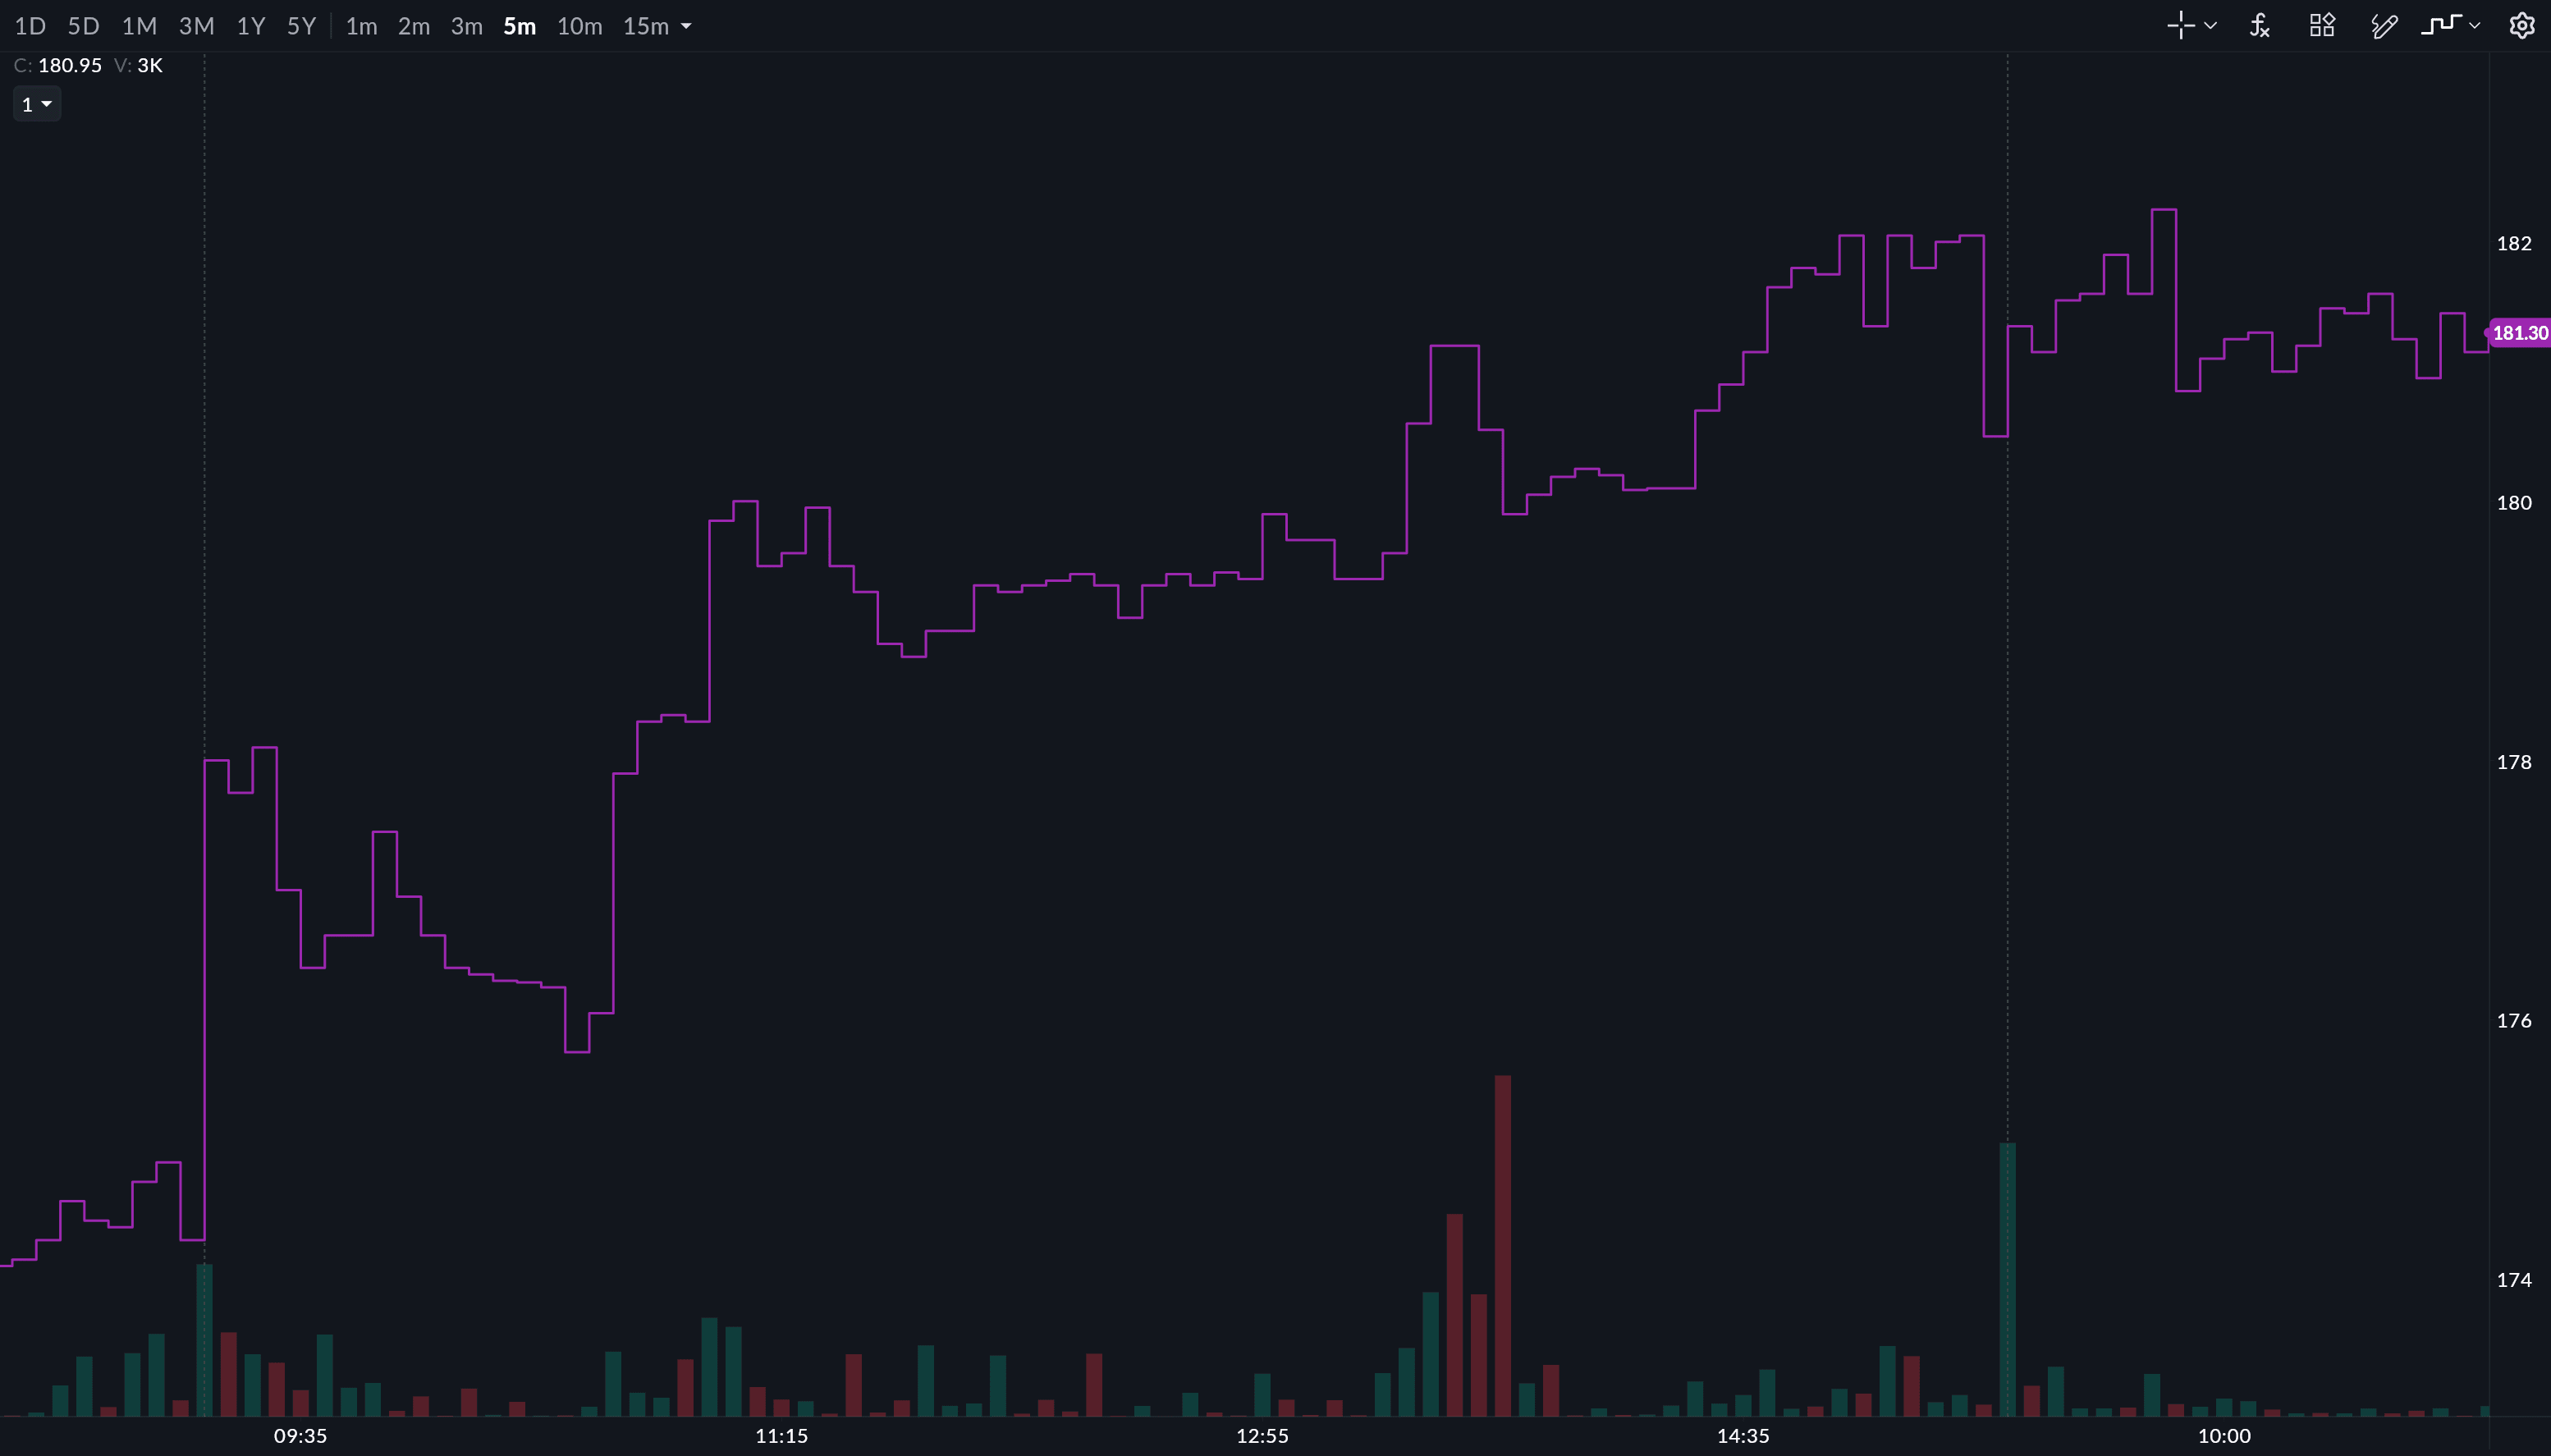
Which one is for you
Renko is for traders who want less on their chart. If time-based noise gets in the way of reading a trend, it's worth trying.
Step Line is for traders who want their line chart to stop guessing what happened between closes.
Both are live on Sahi now. Swap chart types from the settings on any chart.