Reading Commodity Futures & Options on Sahi: Margin, Market Depth & Option Chain
Learn what every number on a commodity futures or options screen on SAHI means: contract name, expiries, Open Interest, Market Depth, the Live Snapshot, required margin, the option chain and premium per lot.
 8 minutes read|

Chapter 13 showed you how to move from a commodity such as Crude Oil to the specific Futures or Options contract you want to analyse.
Once that contract is open, the next job is reading what SAHI is showing you.
The concepts themselves should already be familiar from Part 1: expiry, lot size, margin, Open Interest, strike price, premium and Market Depth. Here, we will map those ideas directly onto the platform so that when you open a commodity derivative, you know what the major numbers and fields around it represent.
We will continue with Crude Oil Mini as the working example.
Reading A Crude Oil Mini Futures Contract
Suppose you open a Crude Oil Mini Futures contract on SAHI.
At the top of the screen, the contract name tells you exactly what you have opened. In the example, the instrument is shown as Crude Oil Mini 19 Oct Fut.
That gives you three pieces of information immediately:
Crude Oil Mini tells you the contract variant.
19 Oct tells you the expiry.
Fut tells you that this is a Futures contract.
Below that is the current Futures price, followed by the chart for the selected contract.
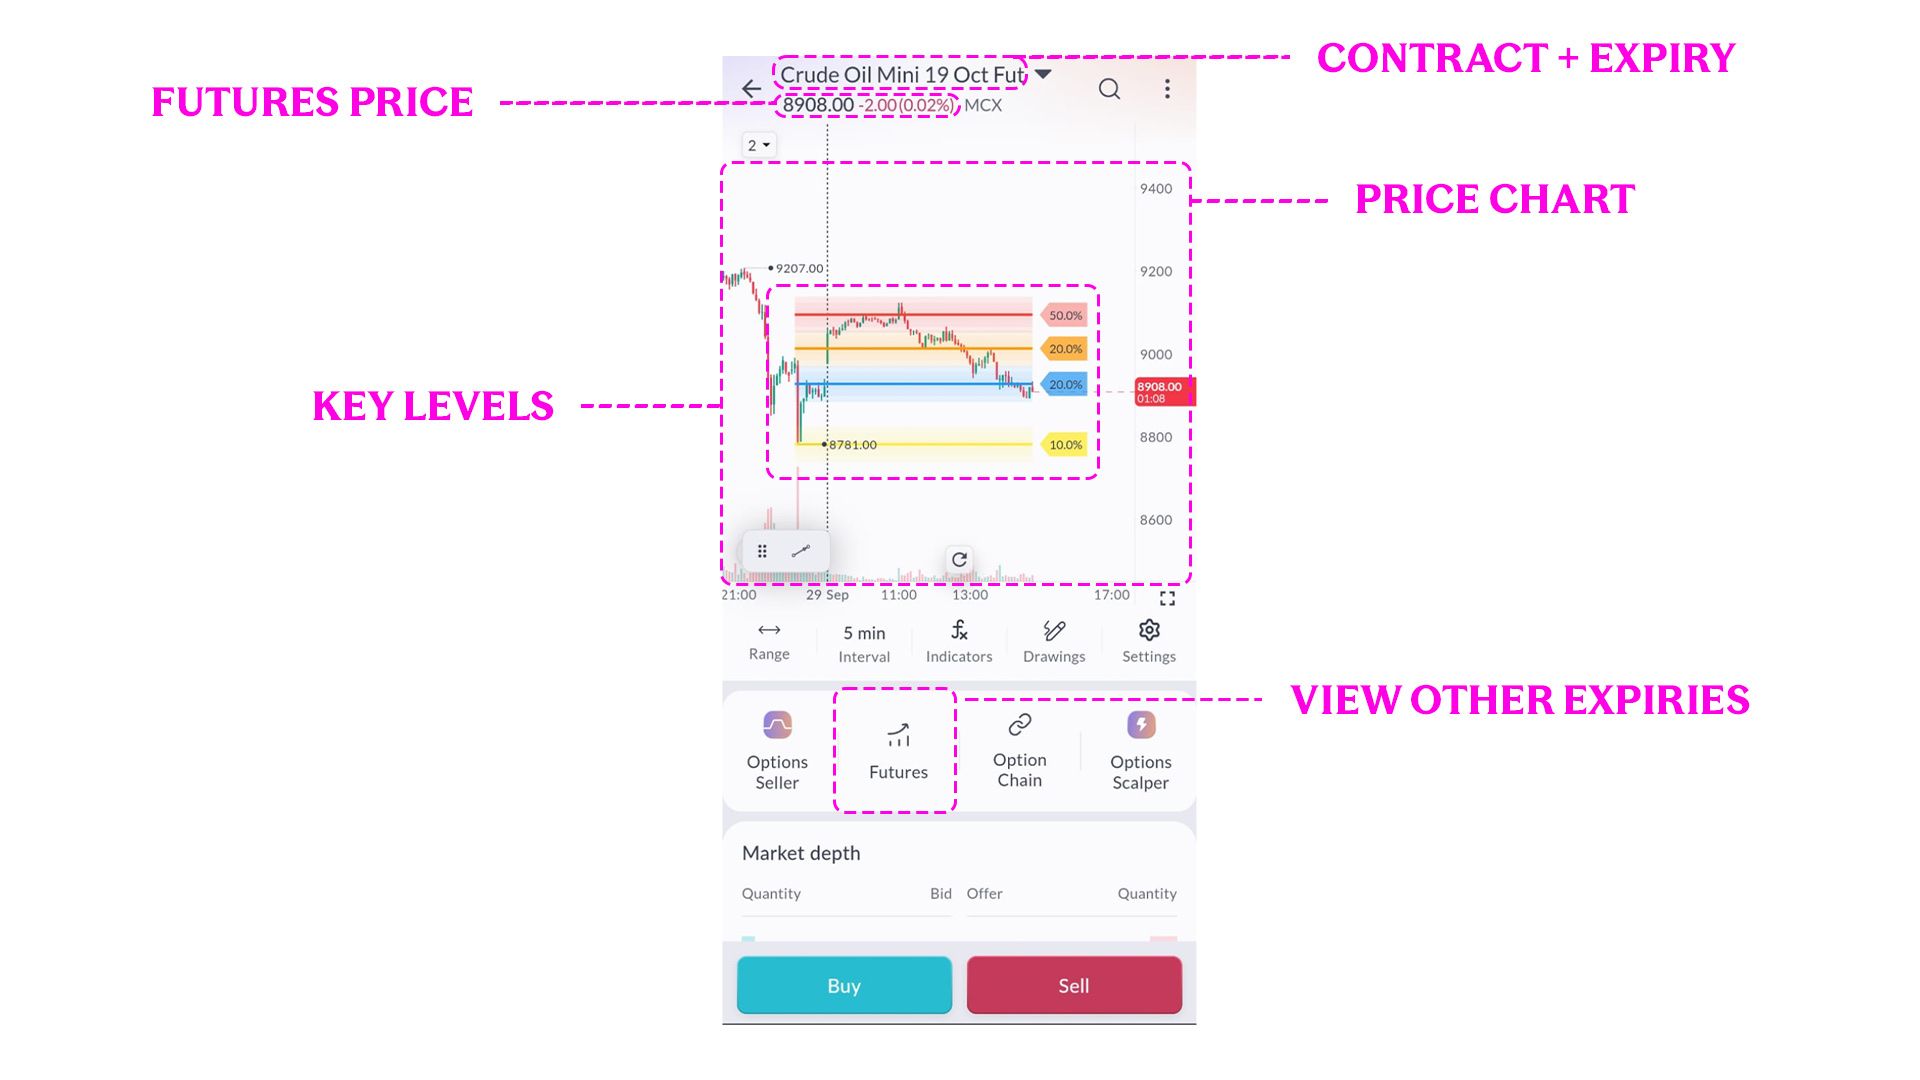
SAHI can also display Key Levels directly on the chart, giving you price areas to keep an eye on while analysing the contract.
These levels can sit alongside the support, resistance and price behaviour framework from Chapter 11. If price approaches one of them, look at how the market behaves around that area.
The same screen also gives you access to the other Futures expiries available for Crude Oil Mini.
Comparing Futures Expiries
Tap Futures and SAHI shows the available Crude Oil Mini Futures contracts together.
In the example, the list contains October, November, December and January contracts, each with its own price and Open Interest.
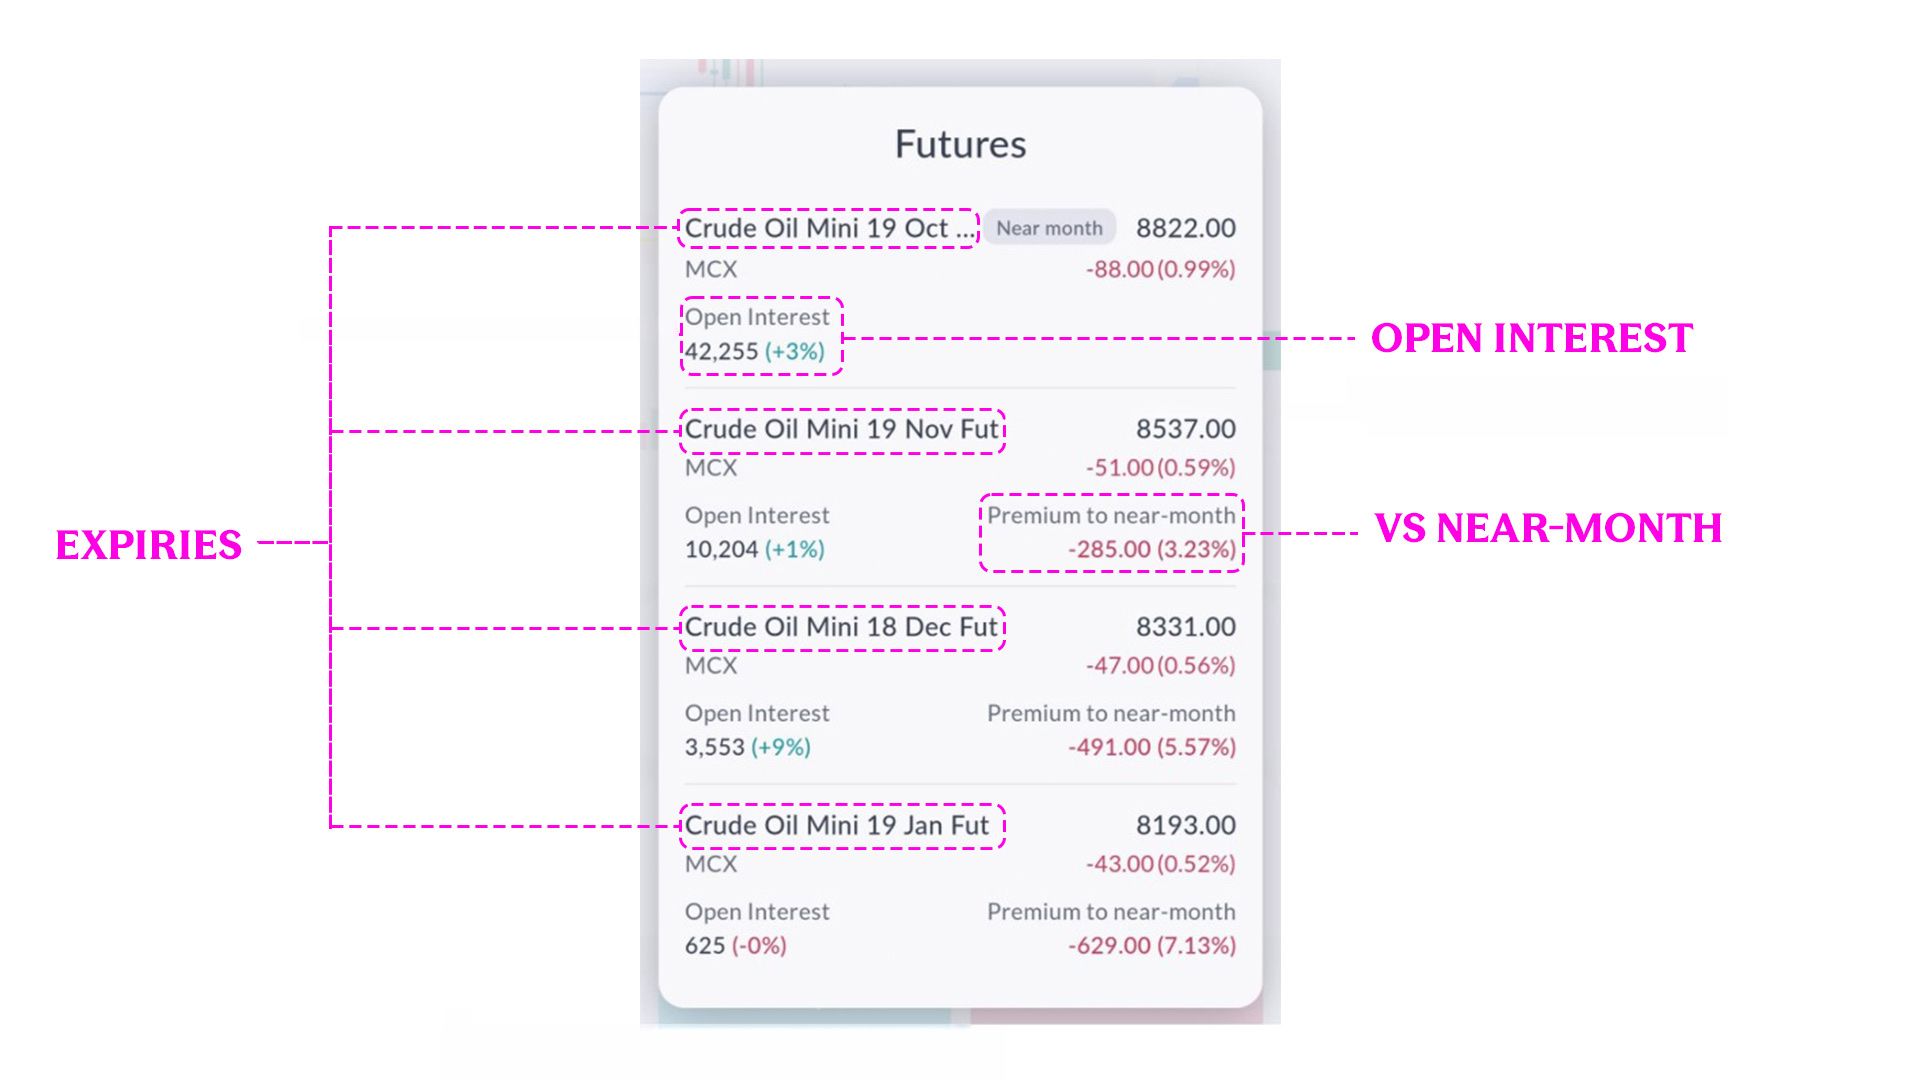
Open Interest tells you the number of outstanding contracts. Comparing it across expiries gives you a quick sense of where participation is concentrated.
For later expiries, SAHI also shows Premium to Near-Month, which compares that contract's price with the near-month Futures contract.
So from the same screen you can compare:
Expiry → Futures Price → Open Interest → Premium to Near-Month
If one expiry has much lower Open Interest than another, that is useful context when you think about how actively the contract is trading.
Reading Market Depth
Once you have selected the Futures contract, scroll below the chart and you can see Market Depth.
Market Depth shows the buy and sell orders currently displayed around the market price. On SAHI, you can see the Bid, Offer and the quantities displayed at different price levels.
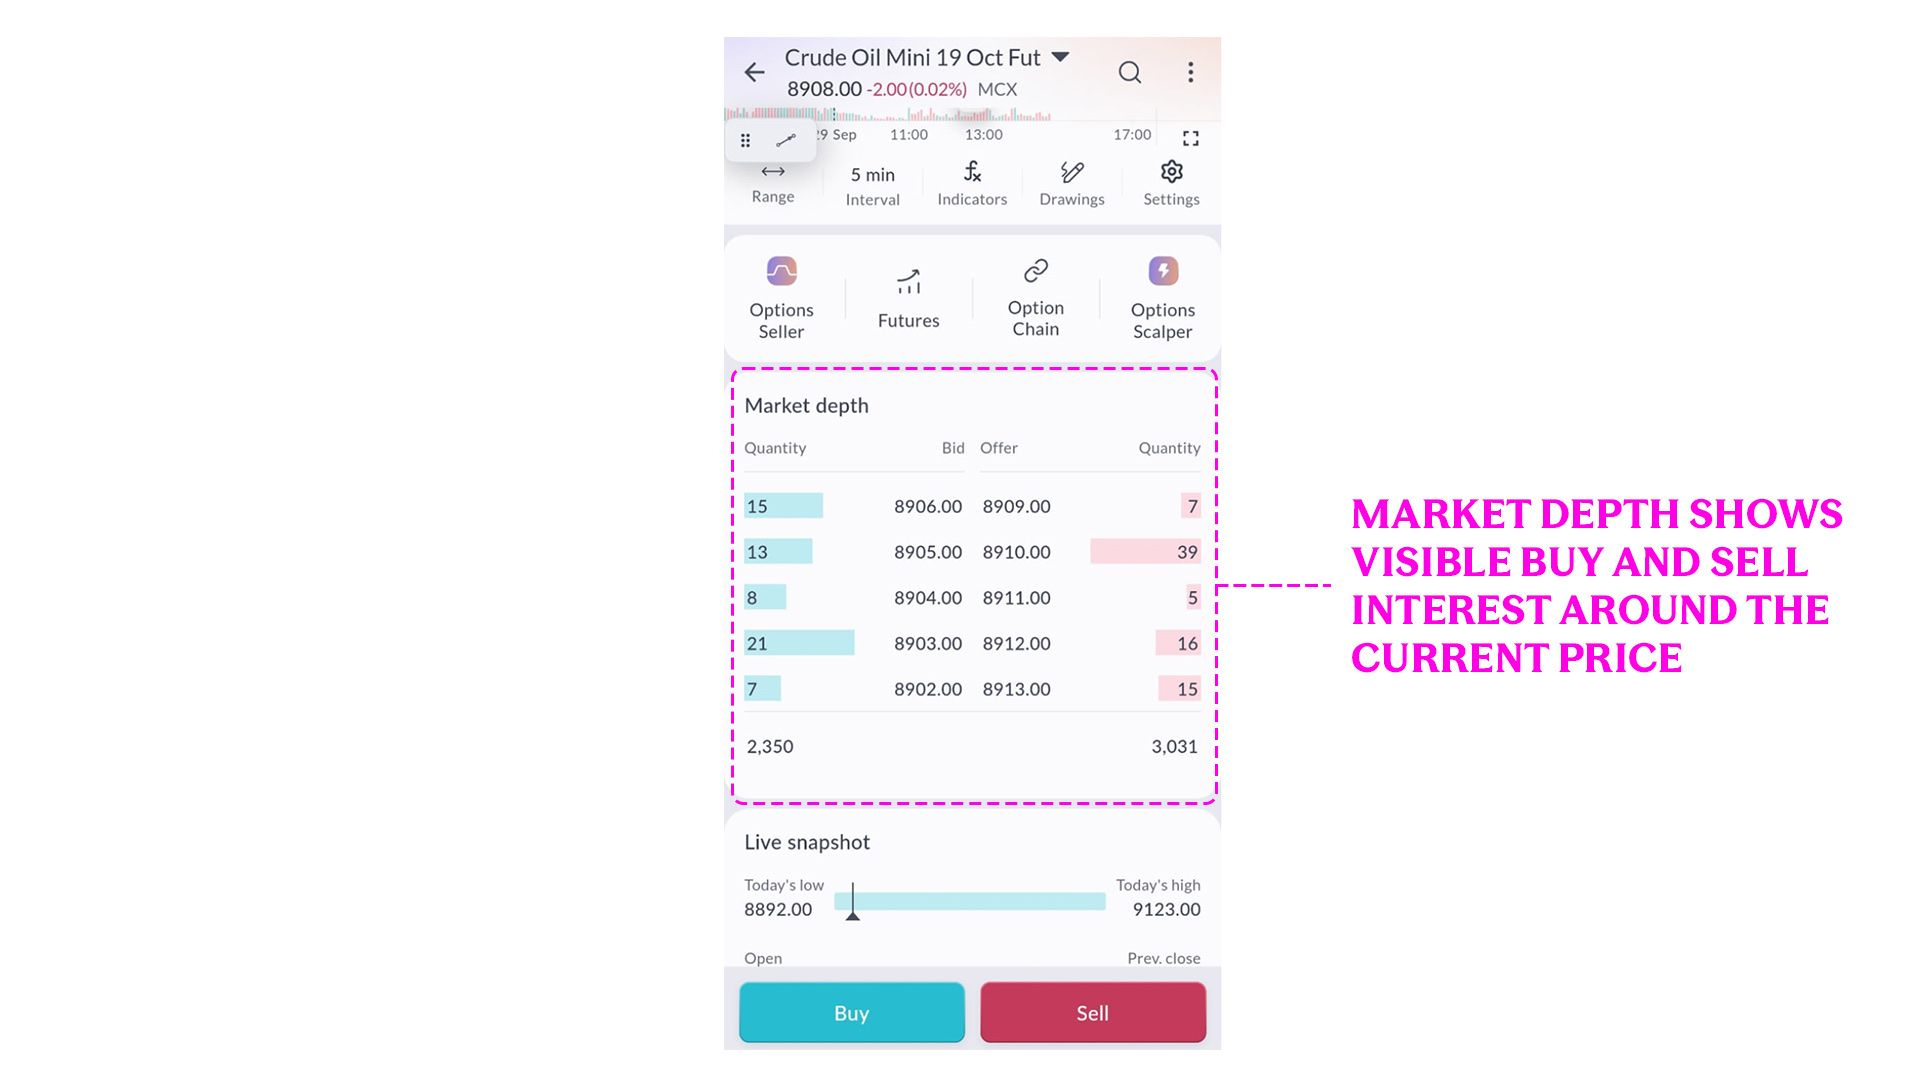
Suppose the highest displayed bid is ₹8,906 and the lowest displayed offer is ₹8,909. The difference between them is the visible spread at that moment.
The quantities beside each level show how much is currently displayed on the buy and sell sides.
These orders can change as participants add, modify or cancel them, so Market Depth is a live snapshot of the order book rather than a guarantee of where your order will execute.
Reading The Contract Snapshot
Scroll further down and SAHI gives you a Live Snapshot of the Futures contract.
This screen brings several contract details together in one place.
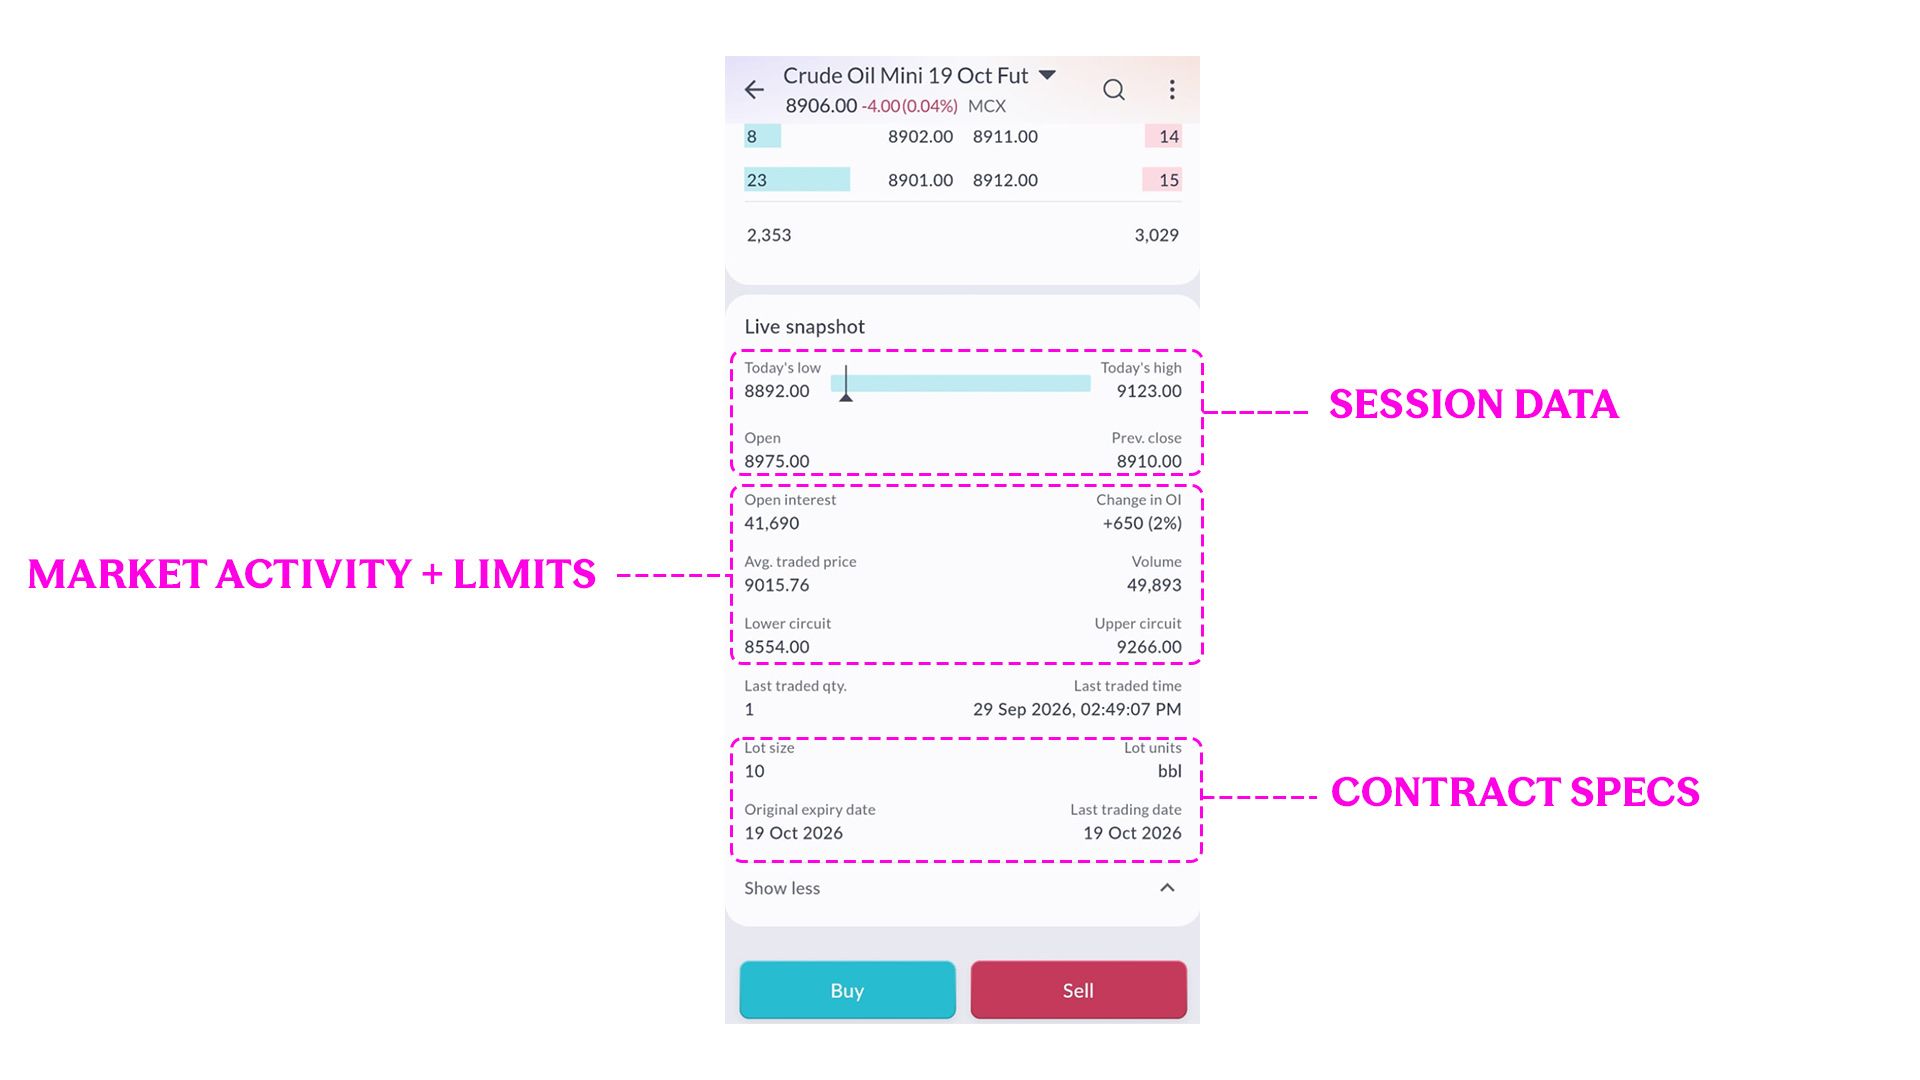
The Crude Oil Mini example shows:
Today's Low and High
The range traded during the session.
Open and Previous Close
The opening price and previous session's closing price.
Open Interest and Change in OI
The number of outstanding contracts and how that figure has changed.
Average Traded Price and Volume
Additional information on activity in the contract.
Lower Circuit and Upper Circuit
The displayed exchange price limits for the contract.
Lot Size and Lot Units
The quantity represented by one lot. In this example, one lot represents 10 barrels.
Original Expiry Date and Last Trading Date
The dates shown for the contract.
Together, these details tell you much more about the instrument than the chart alone.
How Much Margin Does The Futures Trade Require?
Now suppose you actually move towards buying one lot of Crude Oil Mini 19 Oct Futures.
The order screen brings the capital requirement into view.
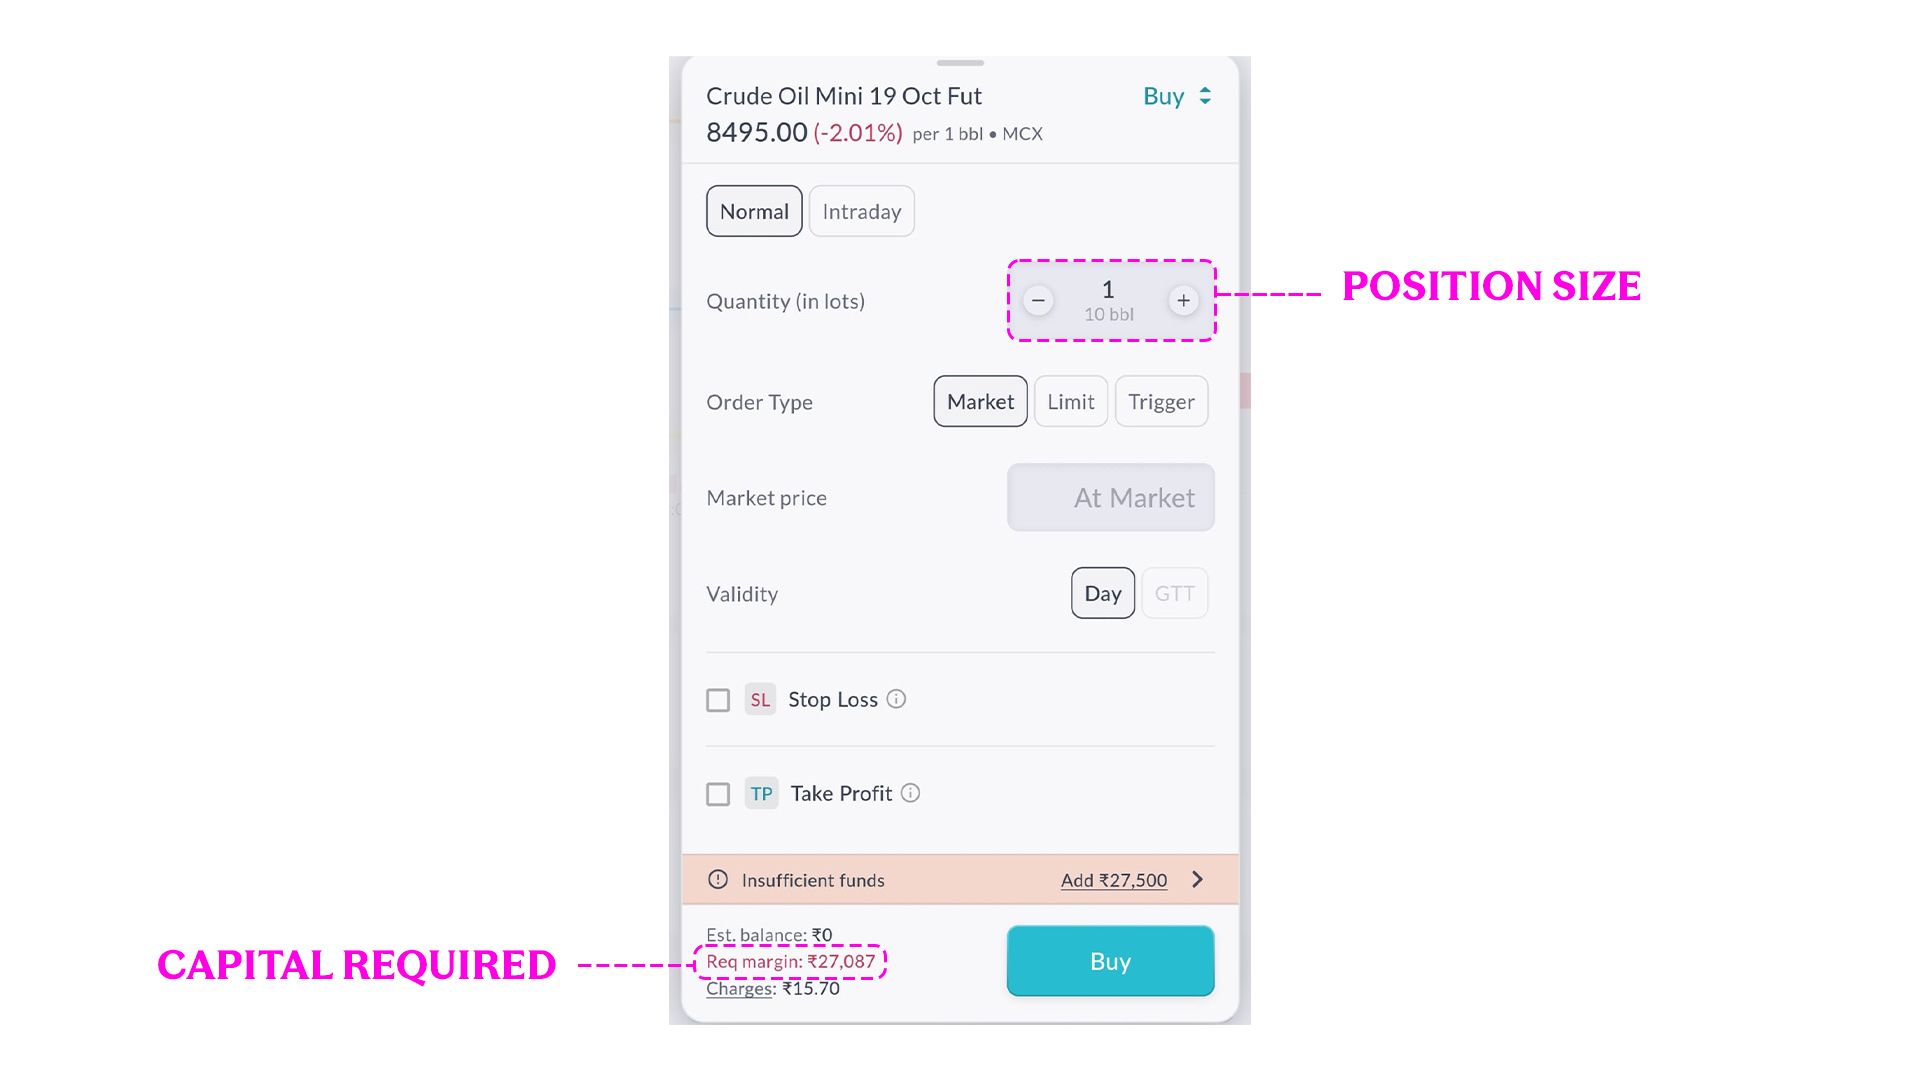
In the example, Crude Oil Mini is trading at ₹8,495 per barrel and one lot represents 10 barrels.
For one lot, the screen shows:
Required Margin: ₹27,087
Charges: ₹15.70
The charges line combines SAHI’s flat ₹10 per executed order with exchange, CTT and other statutory levies, and the brokerage calculator breaks these down for any MCX contract before an order is placed.
This is the distinction we made in Chapter 8 appearing directly on the platform.
The Futures price and lot size tell you the position you are taking, while the required margin tells you how much capital SAHI requires to support that order.
Having enough margin available gets the position into the account. The risk created by that position still depends on the full contract quantity and how far the market moves.

Reading The Crude Oil Mini Option Chain
Now suppose you want to express a Crude Oil Mini view through Options.
Open the Option Chain.
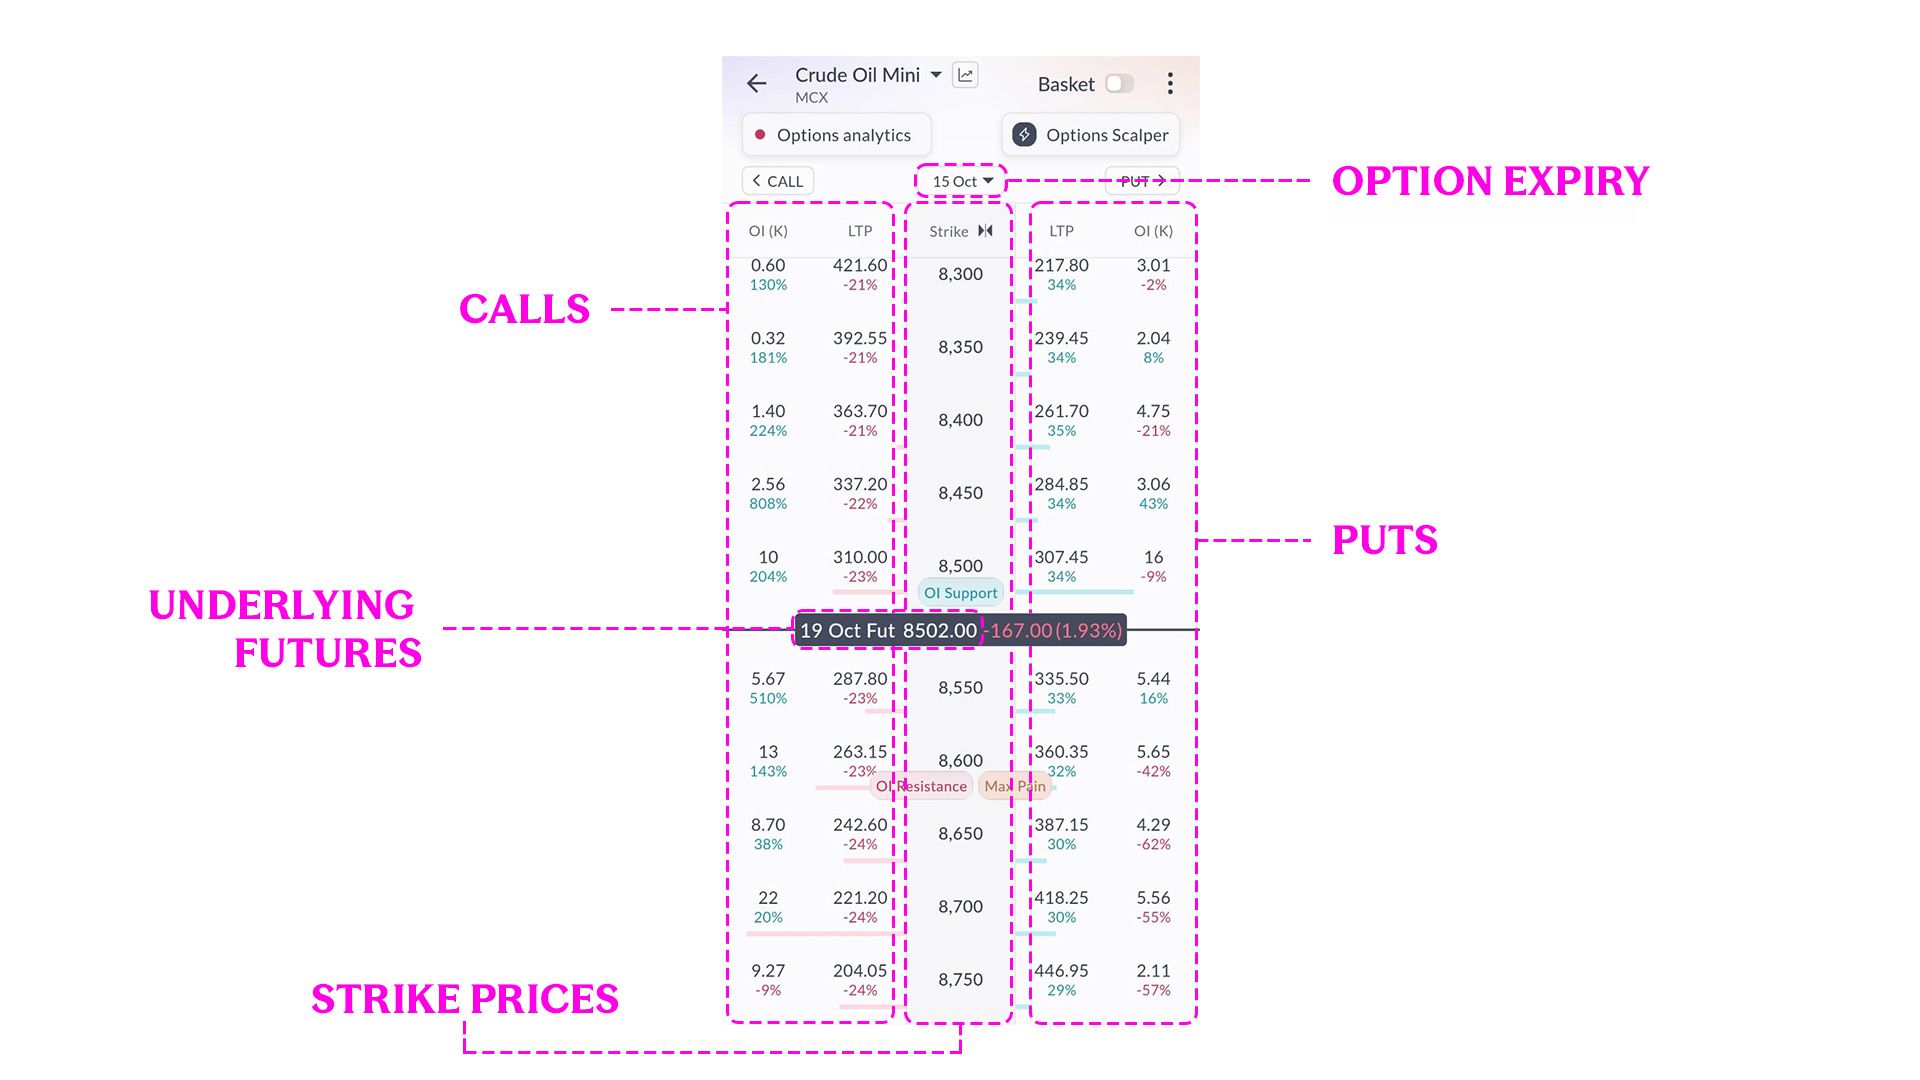
At the top of the screen, the selected option expiry is 15 Oct.
The centre column shows the available strike prices, while Calls appear on one side and Puts on the other.
For every strike, the chain shows the LTP, or Last Traded Price, for the Call and Put, along with Open Interest.
The underlying Futures contract is also shown across the chain. In this example, the option chain is for the 15 Oct expiry, while the underlying shown is the 19 Oct Crude Oil Mini Futures contract, trading around ₹8,502.
A commodity option is linked to a Futures contract, and the option expiry can come before the expiry of the Futures contract underneath it.
From this screen you can move across strikes and compare the available Calls and Puts before opening one particular option.
Reading An Individual Commodity Option
Suppose you tap the 8,550 Call from that Option Chain.
SAHI opens the order screen for:
Crude Oil Mini 15 Oct 8550 Call
That contract name already tells you:
Commodity: Crude Oil Mini
Expiry: 15 Oct
Strike: 8,550
Option Type: Call
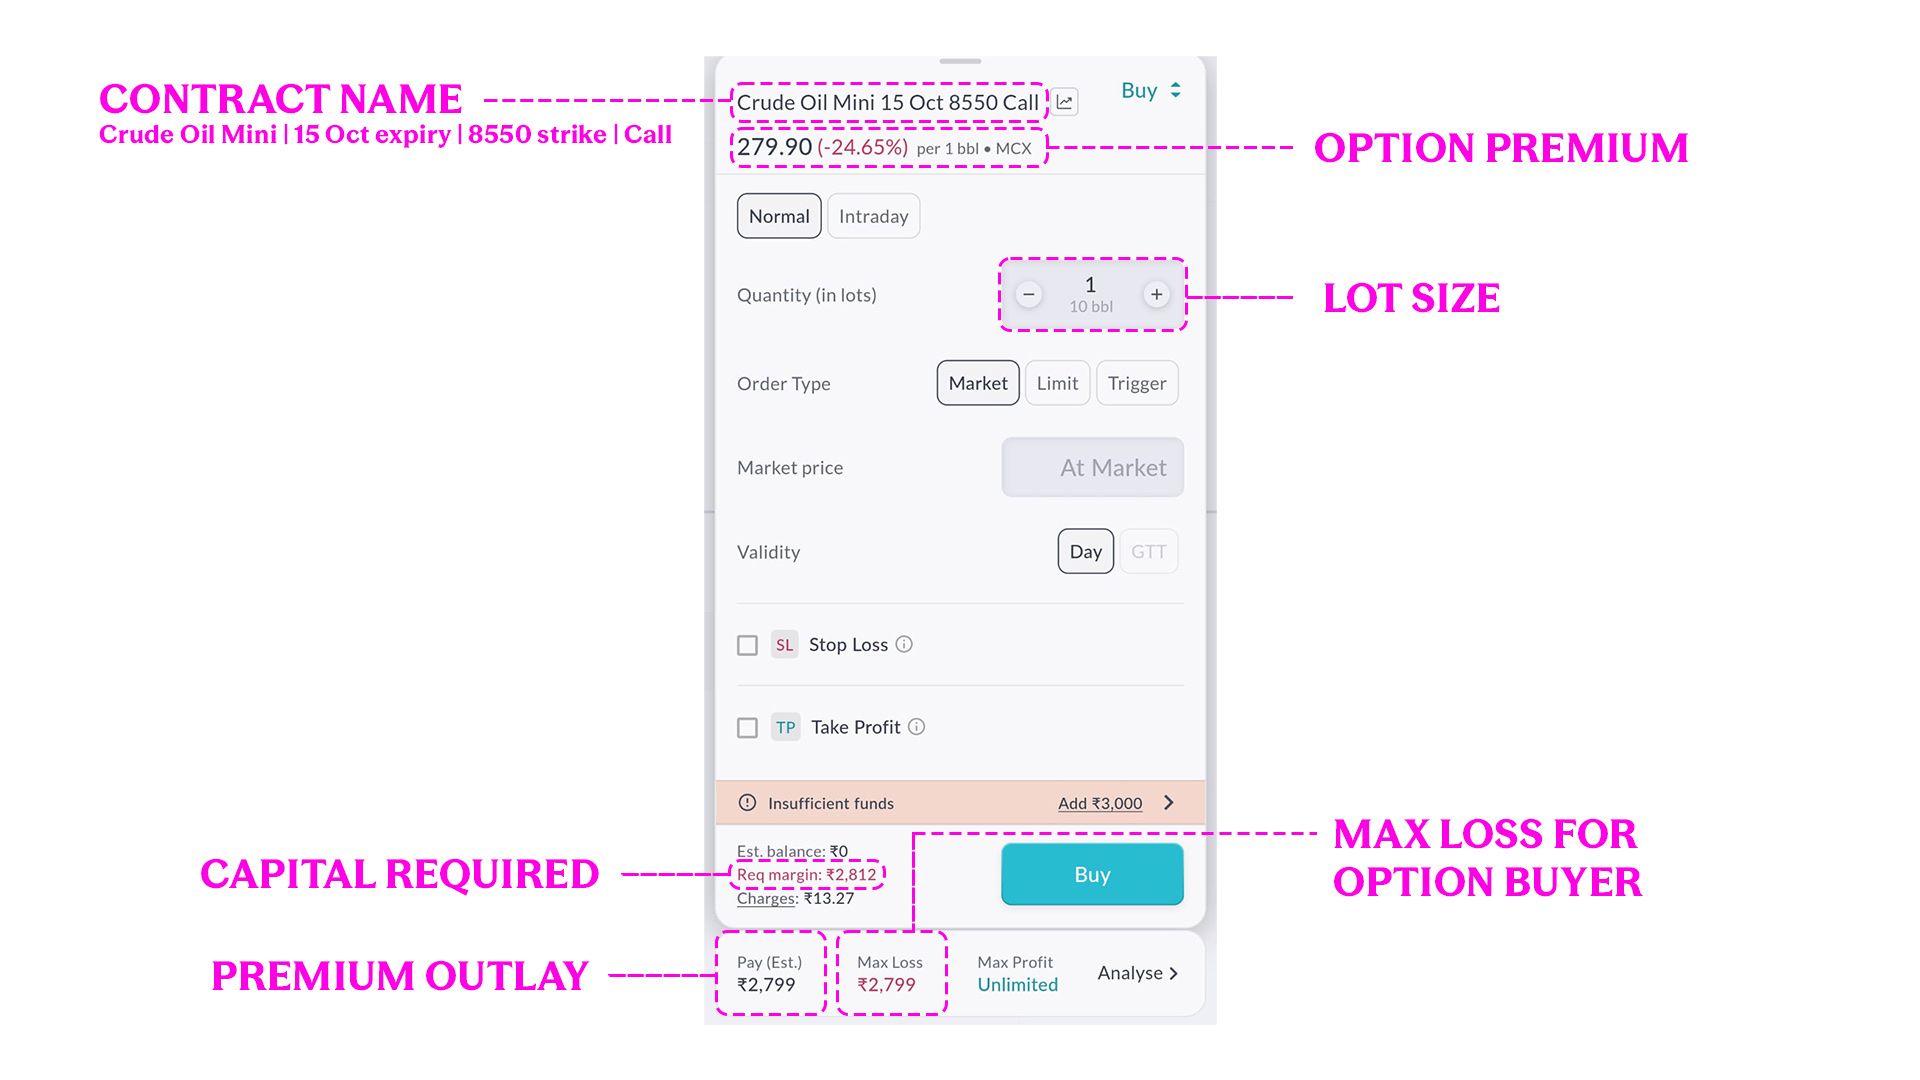
The screen shows the option premium as ₹279.90 per barrel.
One lot represents 10 barrels, so the estimated premium outlay for one lot is:
₹279.90 × 10 = ₹2,799
The same ₹2,799 appears on the screen as the estimated amount paid and the maximum loss for the long Call position.
The order screen also shows:
Required amount: ₹2,812
Charges: ₹13.27
This gives you a very practical way to read an option quote. The premium displayed beside the contract is quoted per barrel, while the amount you actually pay for one lot comes from the premium multiplied by the lot quantity.
The option also has its own chart. That chart tracks the option premium, while the Crude Oil Mini Futures chart tracks the underlying Futures contract.
So when you open the option chart, you are tracking the option premium, not the Futures price.
Other Information Available Around The Contract
SAHI also provides additional views around the commodity.
The chart screen can switch between Price, OI and Change in OI, allowing you to look at price movement and participation from the same workspace. Options-related information shown on SAHI also includes measures such as ATM Straddle, PCR and ATM IV.
The detailed mechanics of those options measures belong to the SAHI Options Course. Here, the useful point is knowing where that information sits when you need it.
SAHI also provides AI-assisted analysis of the commodity.
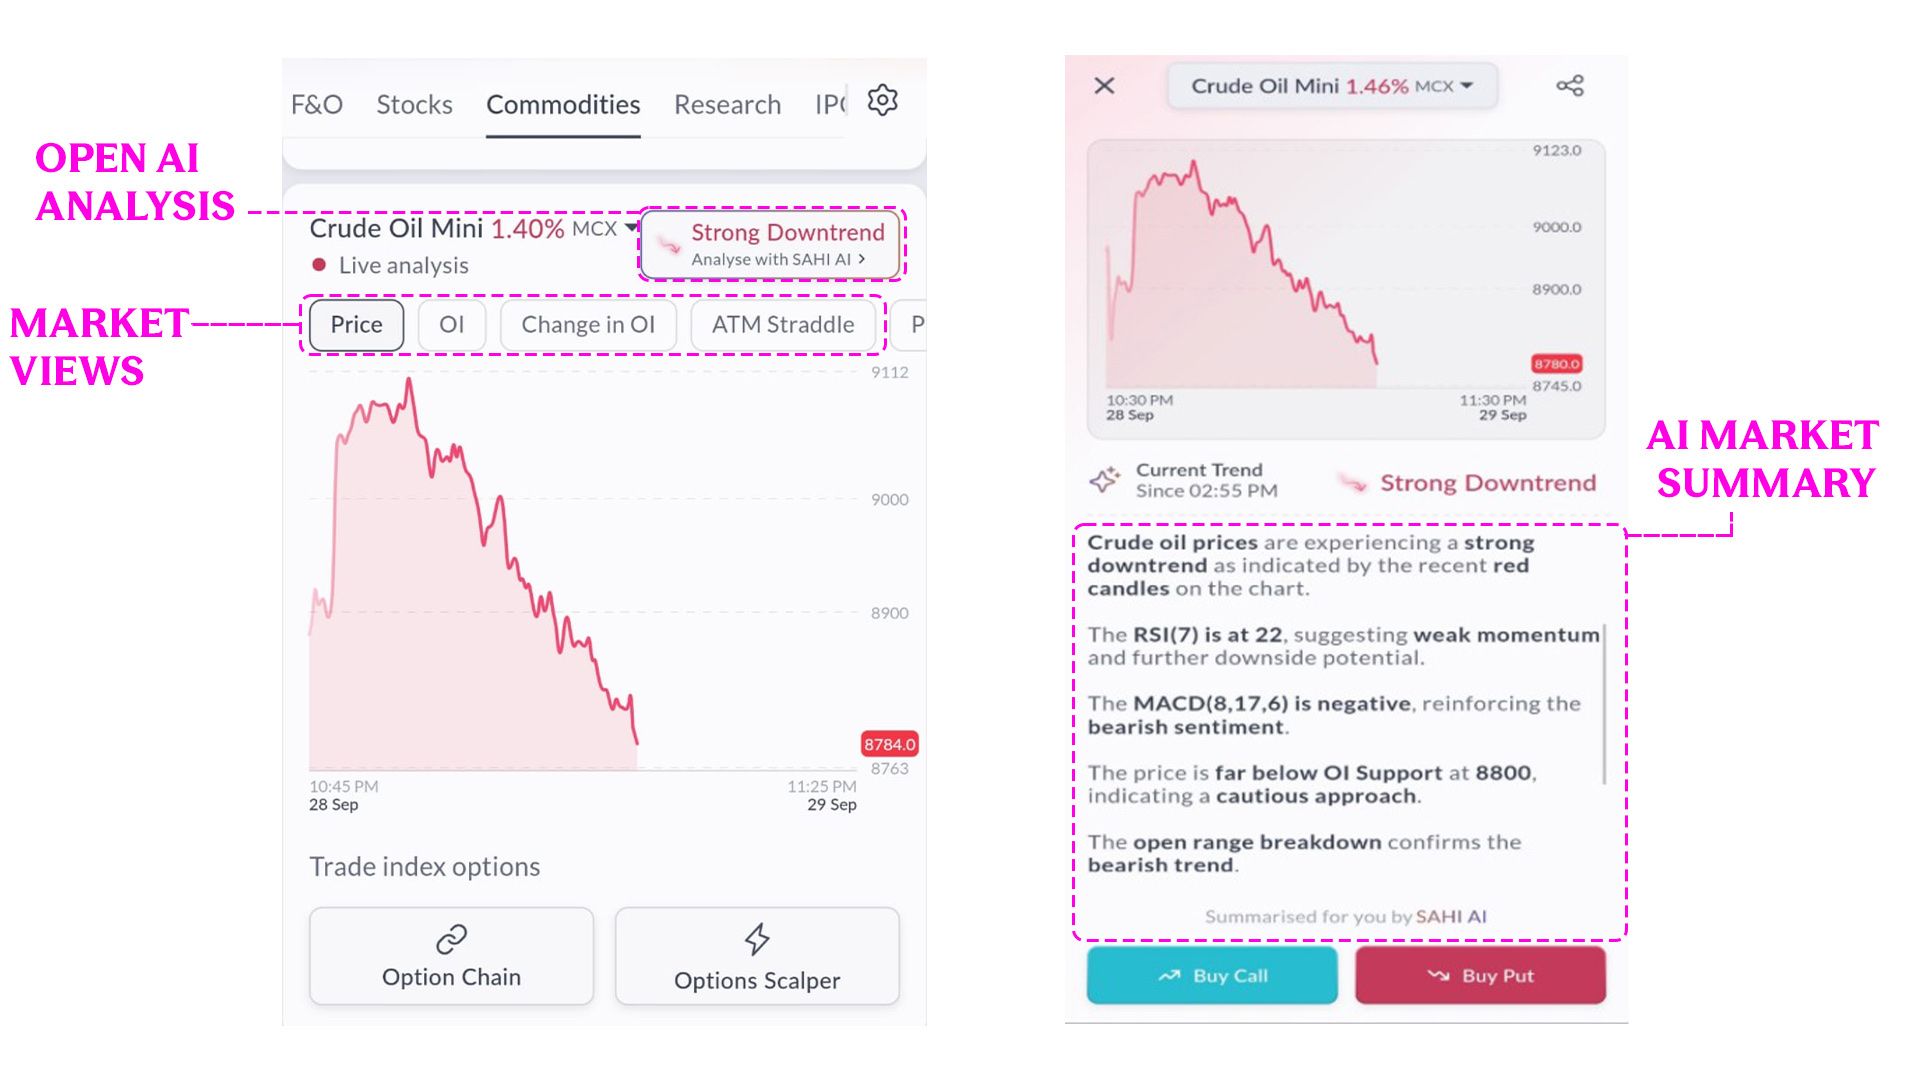
In the Crude Oil Mini example, the AI panel brings together information such as the current trend, RSI, MACD and a support level into a short market summary.
That gives you another way to scan what is happening in the market.
Your actual trade still comes back to the framework from Chapters 11 and 12: why you are entering, where the view becomes invalid, what your target is and how much you are prepared to risk.
Reading The Instrument Before Trading It
When you open a commodity Futures contract on SAHI, you should be able to identify:
Contract Name → Expiry → Price → Chart → Lot Size → Margin → Market Depth → Contract Details
For an Option:
Call / Put → Strike → Expiry → Premium → Lot Size → Option Chain → Chart → Relevant Contract Information
Once those fields make sense, the screen becomes much easier to read.
You know which instrument is open, how much one lot represents, what price is being quoted, when the contract expires, how much capital the position requires and what other market information is available around it.
That is the foundation you need before moving from reading the instrument to actually placing the order.
The concepts behind lots, expiry and strikes are explained in Understanding Commodity Futures & Options.
Key Takeaways
- A Futures contract on SAHI can be read through its contract name, expiry, price, chart, lot size, margin, Market Depth and contract information.
- Comparing Futures expiries lets you see differences in price, Open Interest and Premium to Near-Month across contract months.
- The Live Snapshot brings together information such as Open Interest, volume, circuit limits, lot size and expiry dates for the selected Futures contract.
- An Option Chain lets you compare Calls and Puts across strikes, while the individual option screen shows the expiry, strike, premium, lot size and capital required for that contract.
- SAHI tools such as Key Levels, OI views and AI analysis can add context around the market while the trade plan and risk decision still come from your own analysis.
Test yourself
Five quick questions on Chapter 14: Reading Futures & Options on Sahi
Commodity knowledge check
How well do you understand commodity markets?
Answer all five questions to check what you have picked up from this chapter. Each answer comes with a short explanation.
 5 questionsUnder 3 minutes
 Instant score