
Analysing a Commodity on Sahi: Timeframes, Key Levels & Trade Scenarios
Work through a Gold Mini example on SAHI: start with the higher timeframe, move down to time the setup, mark Key Levels, add volume and indicators, and turn the view into an entry, invalidation and target.
 7 minutes read|

By the time you open a commodity chart, you may already have some reason to be looking at it.
Maybe Gold is reacting to the Dollar. Crude Oil is moving after an OPEC announcement. Natural Gas has seen a sharp inventory surprise. Something has put the commodity on your radar.
The next step is to work out whether there is actually a trade there.
That means looking at the market from a few angles together: what is moving it, what the broader trend looks like, where the important price areas are, how price is behaving around them and what would make the view stronger or weaker.
In this chapter, we will do that on SAHI using Gold Mini.
Suppose the broader environment is putting pressure on Gold because the Dollar is strengthening or real yields are firming. That gives us a possible bearish starting point.
Now we need to see whether the chart agrees.
Start With The Bigger Picture
Open Gold Mini on SAHI and move to the 4-hour chart.
The broader structure is pointing lower. Price is making lower highs and lower lows inside a declining formation, giving us a bearish higher-timeframe view.
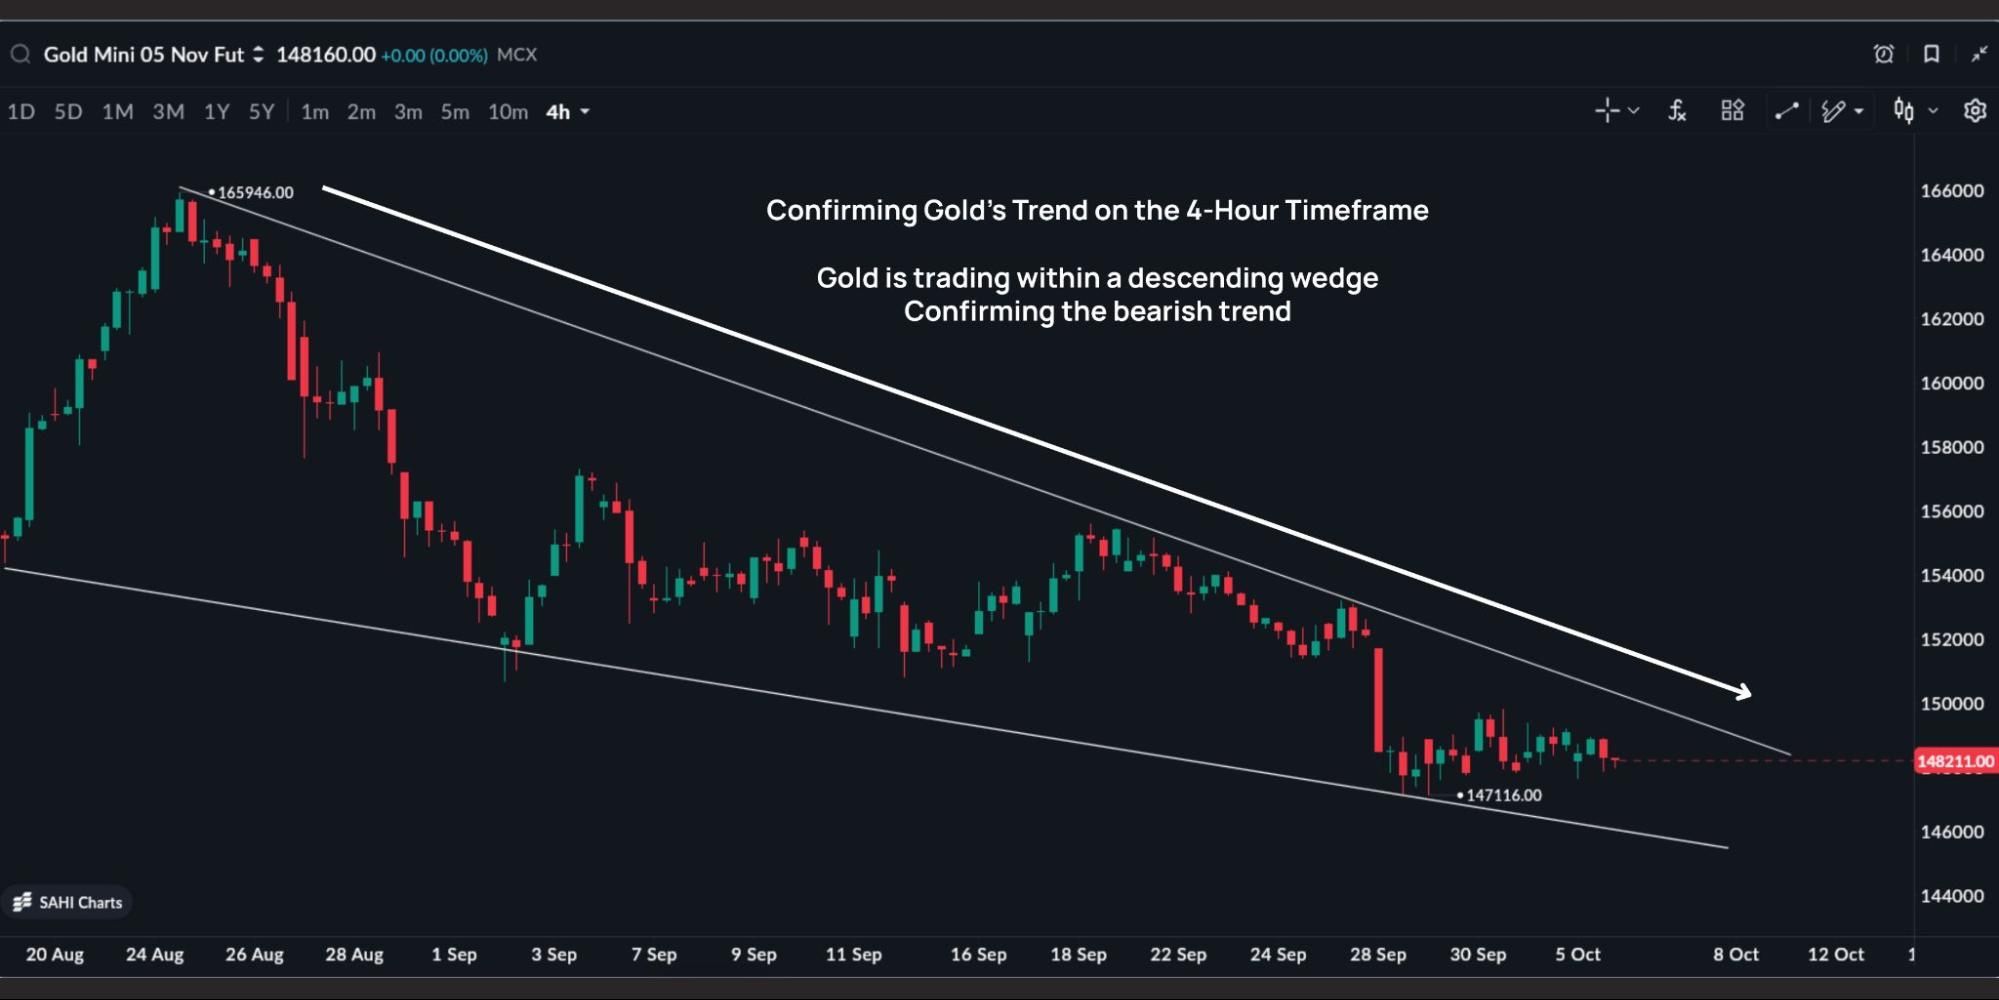
For now, that tells us the direction worth investigating.
The macro backdrop and the chart are pointing broadly the same way. Gold is under pressure, and the 4-hour structure reflects it.
The next question is what is happening inside that larger move.
Move Down The Timeframes
Switch to the 1-hour chart.
Here, the fall has lost some momentum. Gold Mini is moving between Key Levels around ₹1,49,350 and ₹1,47,500. The wider trend remains bearish, while the immediate market has moved into consolidation.
Then move to the 10-minute chart.
Price has reached the lower Key Level, found support and pulled back higher. That gives us a more useful place to start thinking about a trade. Selling after a sharp fall would mean entering near the lower end of the move. A pullback towards resistance could offer a cleaner area to watch for renewed selling pressure.
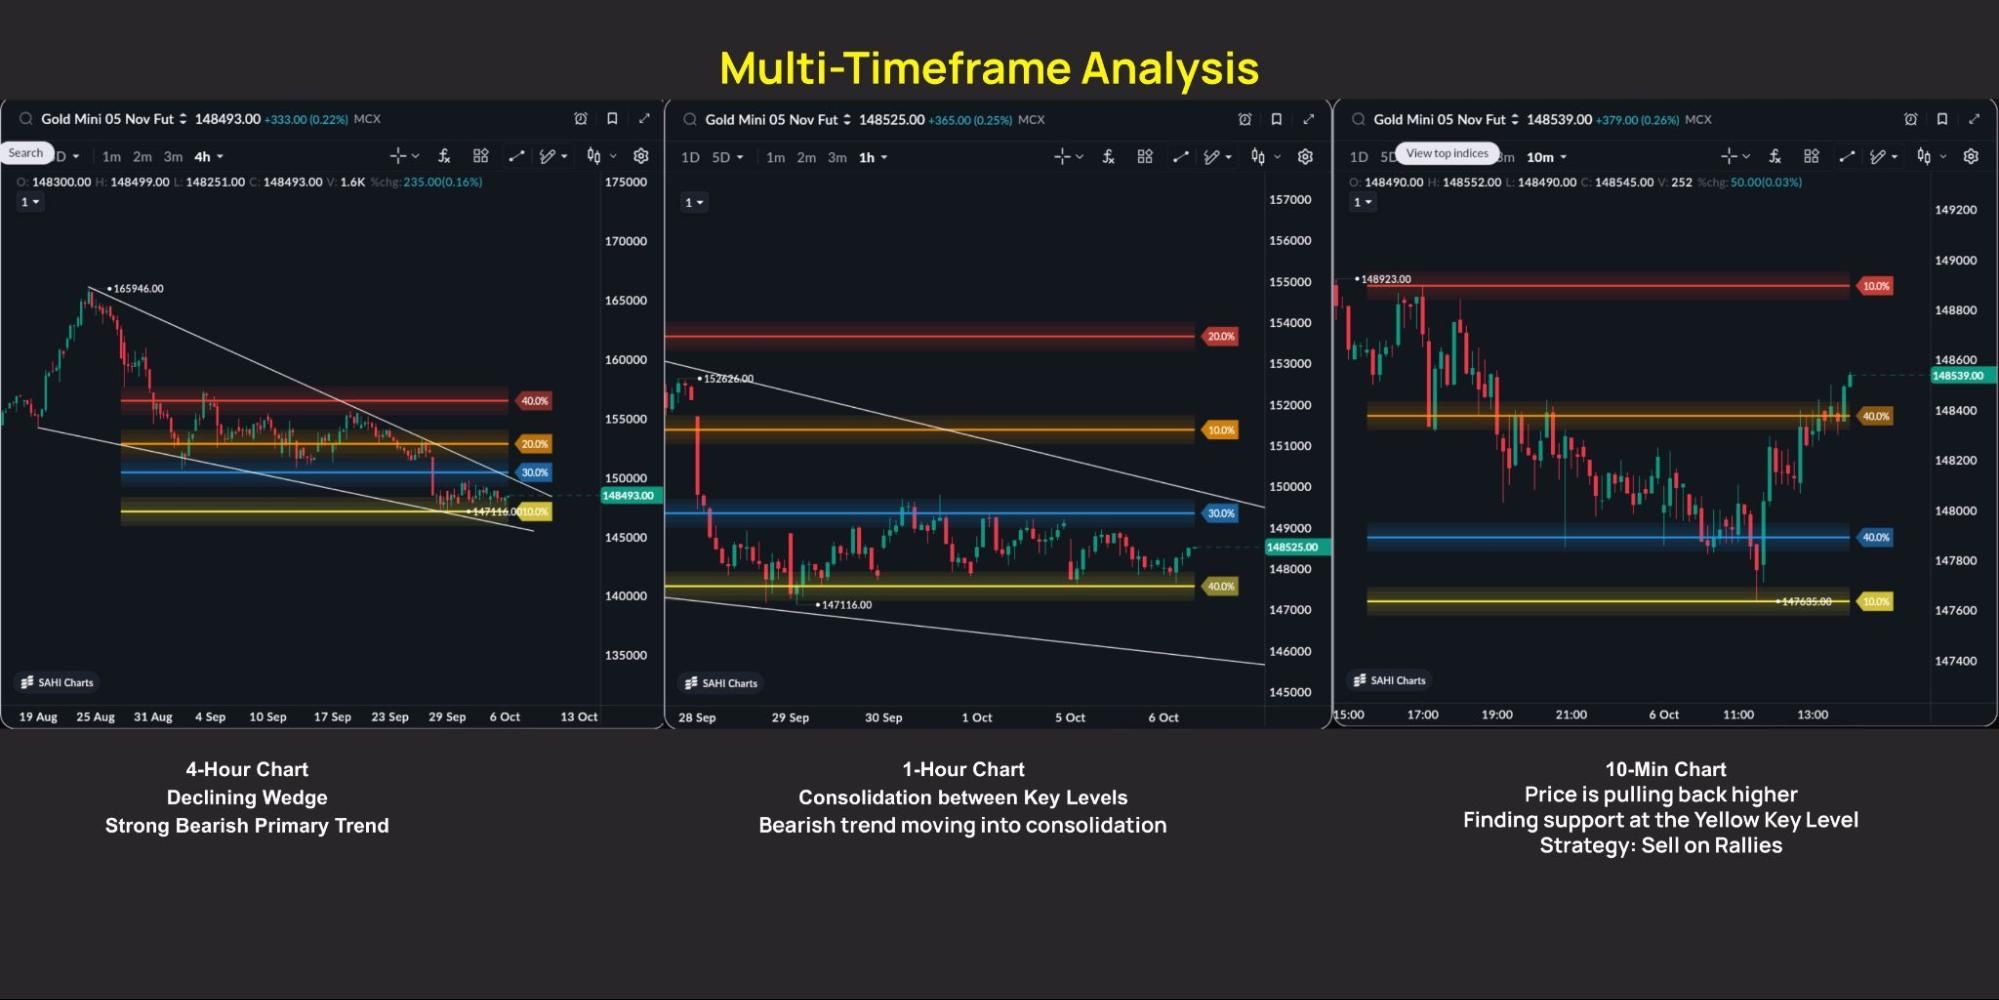
The three charts now fit together naturally.
The 4-hour chart gives us the broader bearish direction. The 1-hour chart shows a pause in that trend. The 10-minute chart shows the pullback developing inside that pause.
So the working idea becomes:
Wait for the rise. Watch how Gold behaves near resistance.
Mark The Areas That Matter
SAHI's Key Levels indicator helps identify areas where price has a higher chance of attracting attention.
In this example, the lower area around ₹1,47,500 has already mattered. Price reacted there and moved higher from it.
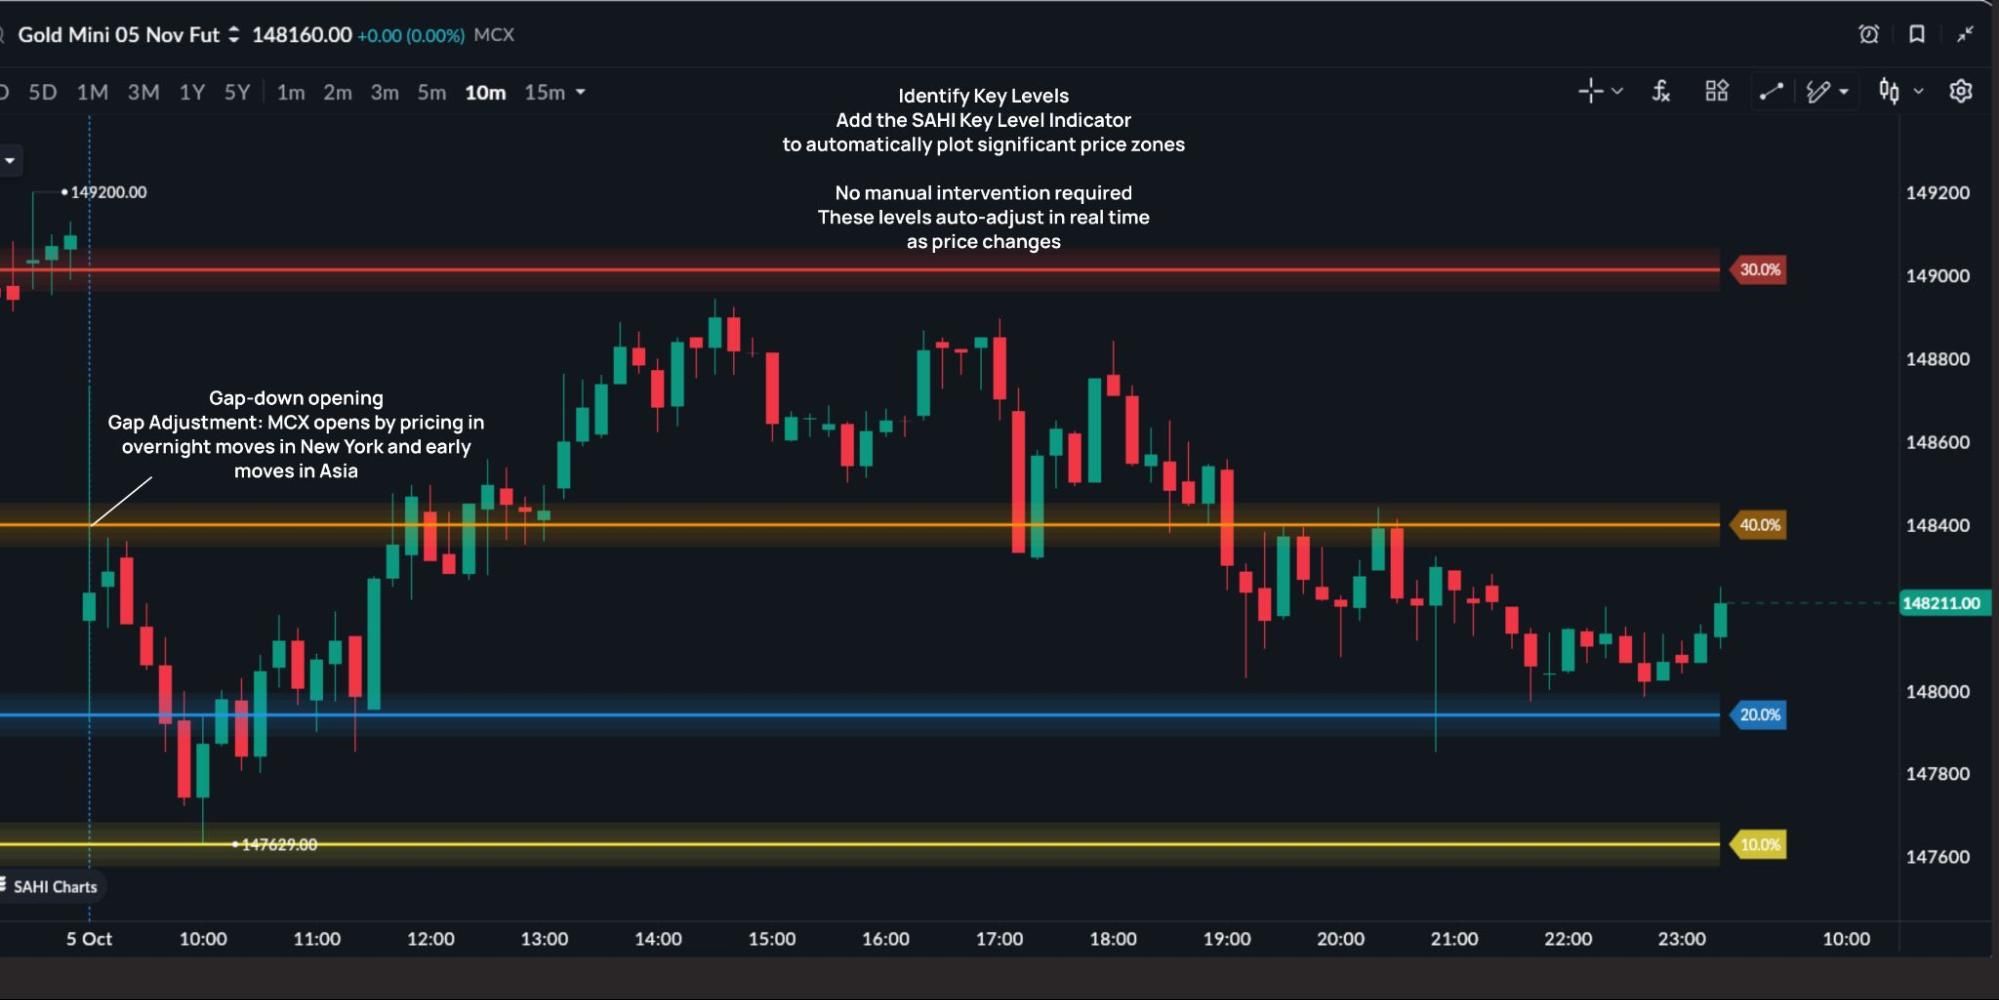
Now watch the reaction.
A clean break through a level tells a different story from repeated rejection. Several small candles around a level tell a different story from a sharp move straight through it. Long wicks, failed attempts to continue and repeated tests can all help show how buyers and sellers are behaving around the area.
This is where the lower timeframe earns its place.
The higher timeframe has already given us the bearish bias. The lower timeframe helps us judge whether the pullback is beginning to run out of steam.
Add Volume And Session Context
Commodity activity changes through the day.
Participation can pick up as international markets overlap, major data is released or larger flows enter the market. Volume helps us see whether the move on the chart is attracting broader participation.
On SAHI, MCX commodity contracts trade from 9:00 AM to 11:30 PM (11:55 PM when US daylight saving is not in effect), which covers the European and US session overlap.
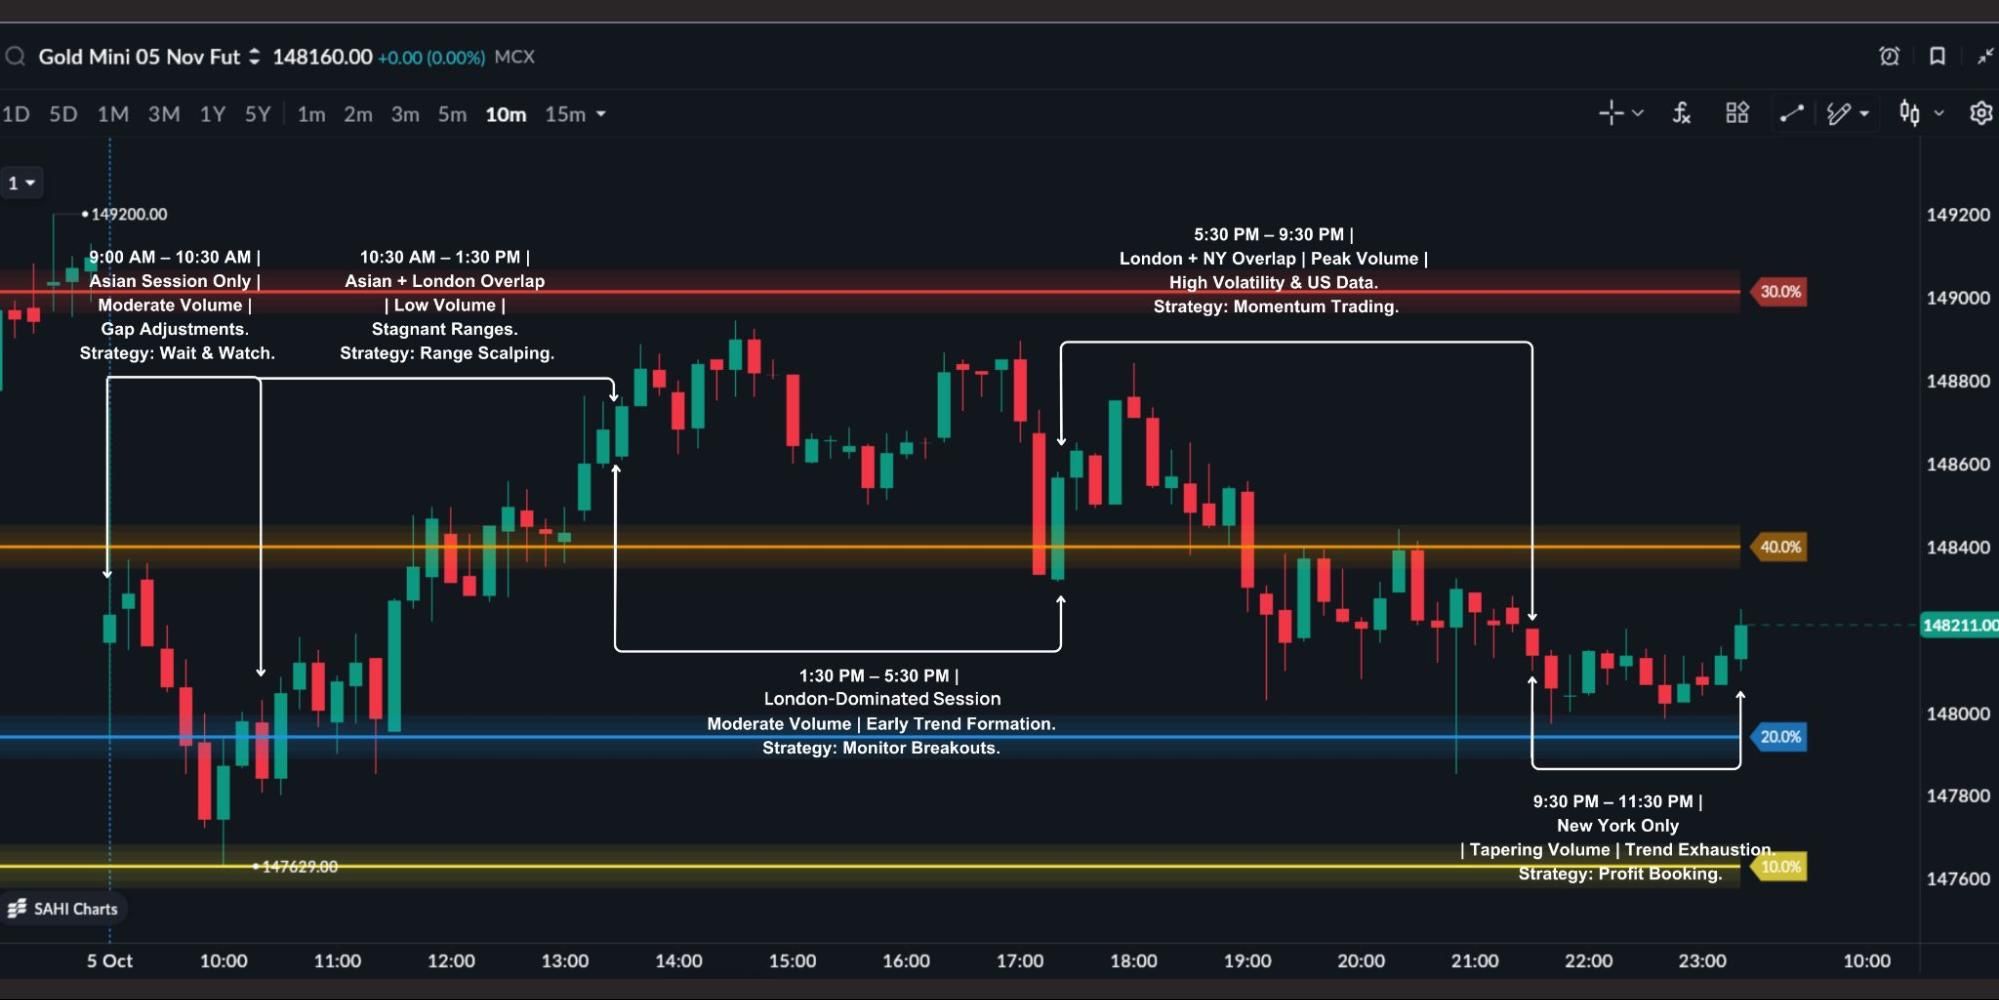
Suppose Gold begins rejecting a resistance area while activity is also picking up. That carries more weight than the same candle formation appearing during a very quiet stretch.
Volume gives the price action another layer of context.
Check The Indicators
Now add a couple of simple indicators.
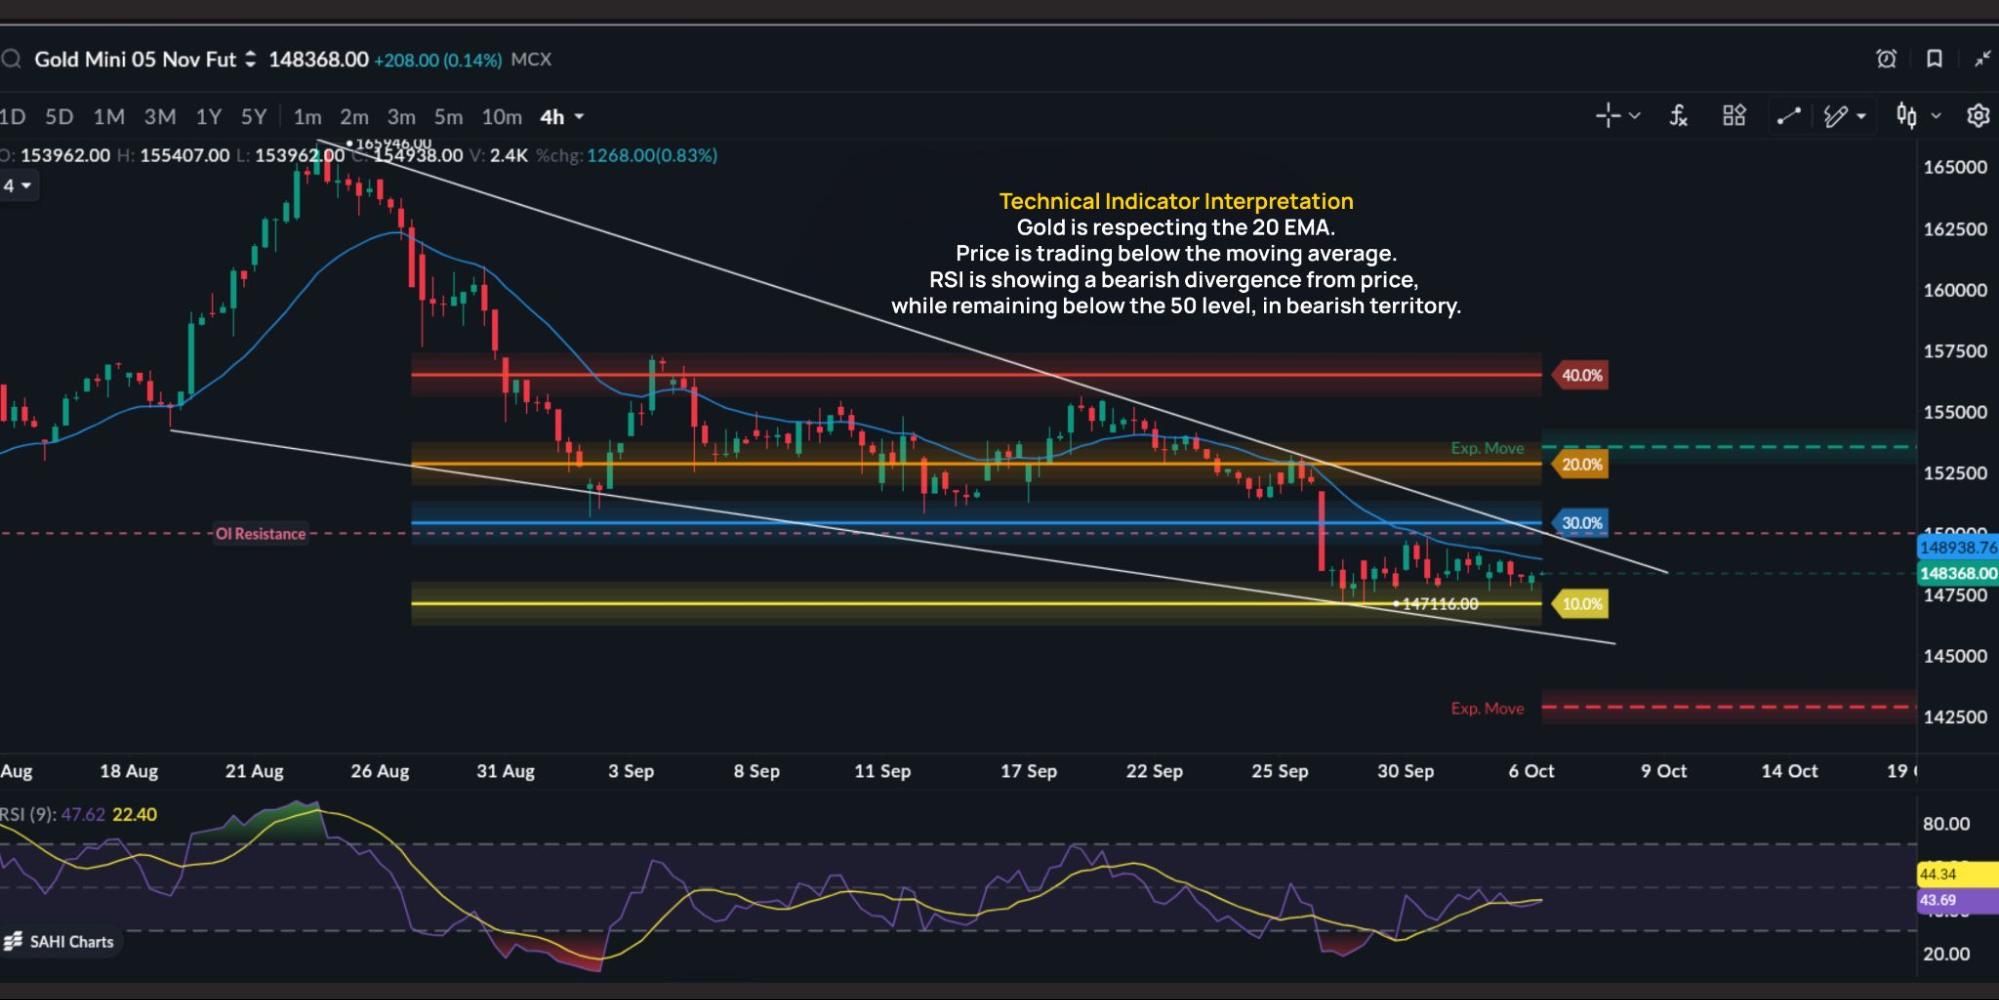
In the Gold Mini example, price remains below the 20 EMA, while RSI(9) is below its midpoint. Both are consistent with the bearish structure already visible on the chart.
This is where indicators are most useful.
The chart has already shown us the trend, the important areas and the pullback. EMA and RSI help us judge whether momentum is still broadly aligned with that reading.
If they begin moving against the rest of the setup, that gives us a reason to be more cautious.
Turn The View Into A Scenario
We can now put the pieces together.
Gold Mini has a bearish higher-timeframe structure. The 1-hour chart is consolidating. The 10-minute chart has bounced from the lower Key Level and is pulling back. Price remains below the 20 EMA and momentum is still weak.
The next step is to define the trade area.
SAHI's Expected Move indicator gives us a way to visualise how the market could develop from here.
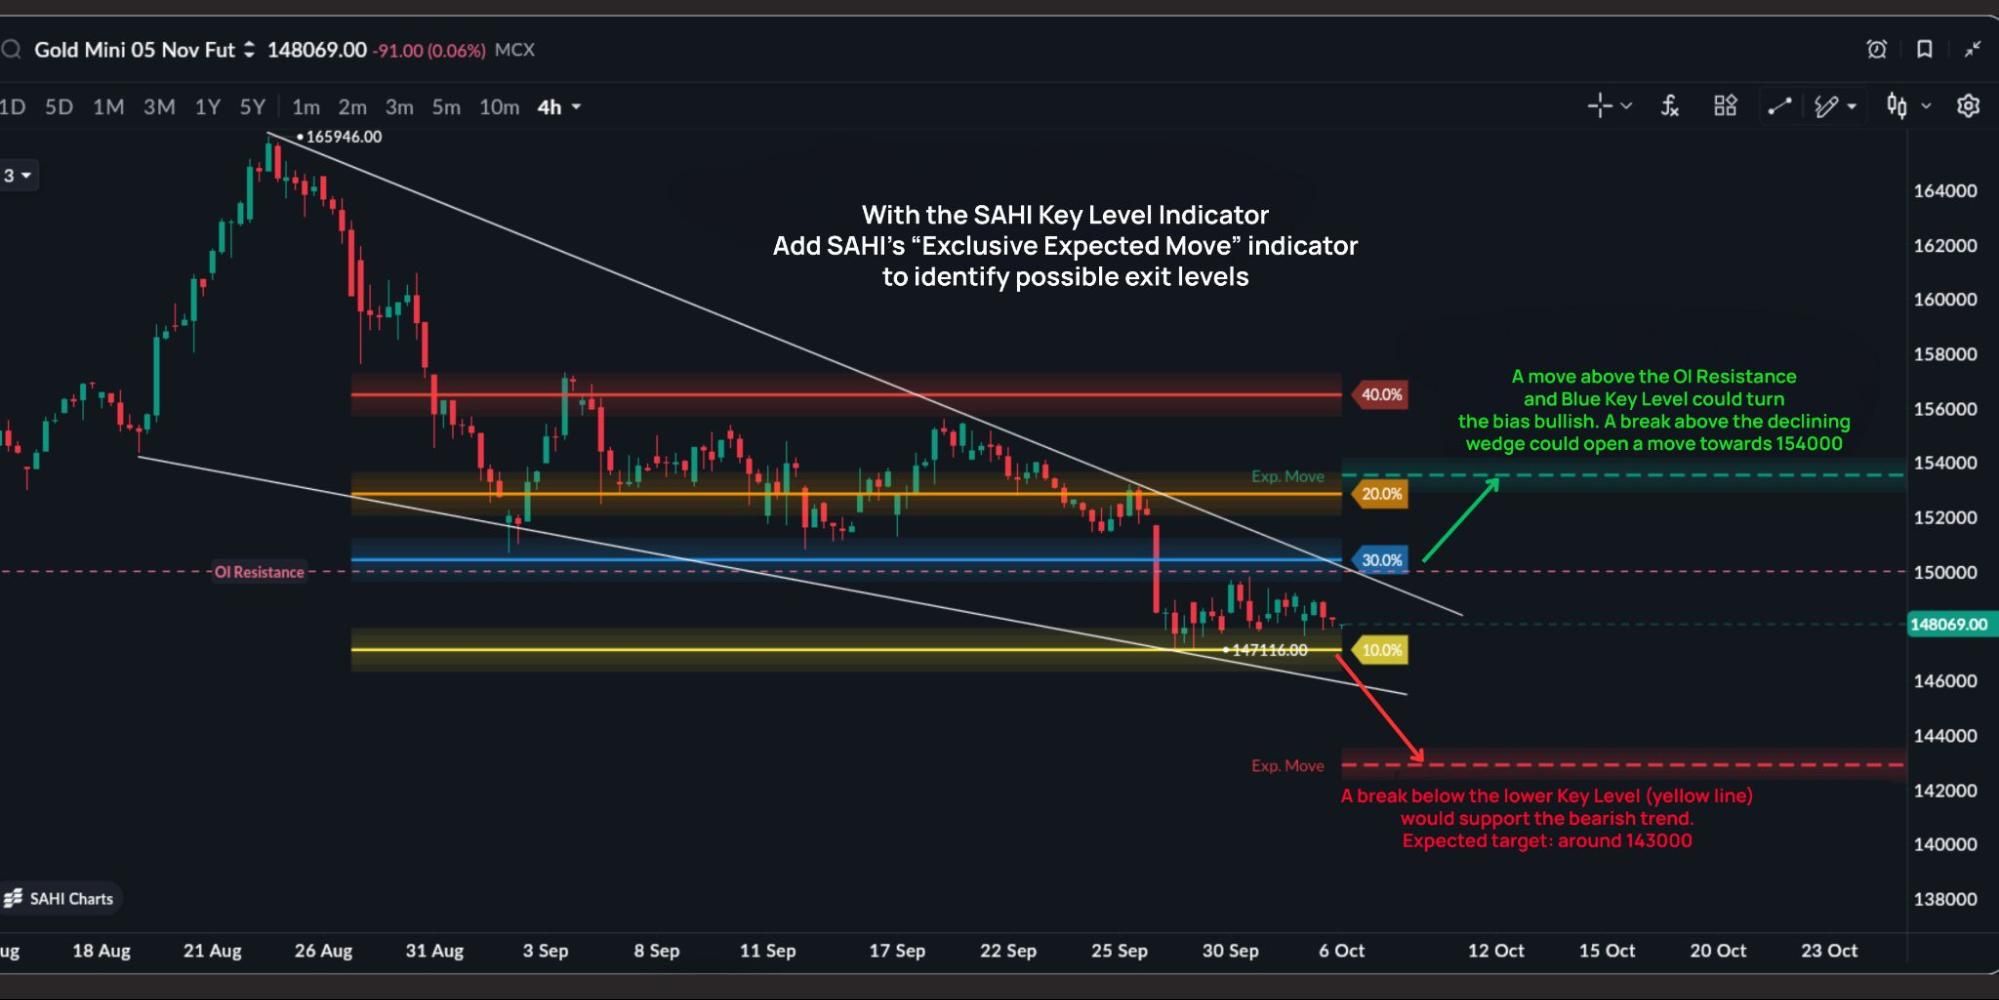
In the example, the bearish scenario points towards roughly ₹1,43,000 if Gold confirms a move below the lower Key Level around ₹1,47,500. The alternative path points towards roughly ₹1,54,000 if price moves through the resistance area above.
That gives us a usable scenario.
The possible entry area sits around the pullback towards the resistance zone near ₹1,49,350, provided bearish price action appears there.
The invalidation area sits above the resistance zone. A sustained move through it would weaken the bearish structure we are relying on.
The possible target comes into view if the bearish setup confirms and price breaks lower, with the projected move towards the ₹1,43,000 area becoming relevant.
Now the market view has enough shape to be useful.
We know what we are watching, where we would become interested and what would tell us the idea is no longer working.
How Should We Express The View?
We have arrived at a bearish Gold view.
There are three reasonable routes from here.
Sell Gold Futures gives direct exposure to the move.
Buy a Gold Put expresses the same bearish view through an Option.
Stay out if the setup never confirms, the invalidation level breaks first or the trade simply does not offer enough room for the risk being taken.
BEARISH GOLD VIEW
↓
SELL GOLD FUTURES | BUY GOLD PUT | NO TRADE
For now, that is as far as we need to go.
Choosing the exact Futures contract, deciding the quantity, selecting an Option expiry or strike, calculating the premium and setting the final trade parameters come in Chapter 16.
The market view comes first. The instrument follows from it.

The thinking behind this process is set out in How Do You Analyse a Commodity Trade?.
Key Takeaways
- Start with the catalyst and the higher-timeframe structure before looking for an entry.
- Use different timeframes for different jobs: broader direction, current condition and possible timing.
- Key Levels help identify areas worth watching, while price behaviour shows what is happening around them.
- Volume, EMA and RSI add context to a view already visible in the price structure.
- Define the possible entry, invalidation and target before deciding whether the view belongs in Futures, Options or no trade.
Test yourself
Five quick questions on Chapter 15: Analysing a Commodity on Sahi
Commodity knowledge check
How well do you understand commodity markets?
Answer all five questions to check what you have picked up from this chapter. Each answer comes with a short explanation.
 5 questionsUnder 3 minutes
 Instant score