
What's New on SAHI
Here's what's new on SAHI this week — September 8, 2026.

What's New on SAHI
Here's what's new this week on SAHI.
Custom Timeframes
Every trader reads the market differently. Some trade the 3 minute chart. Some live on the 45 minute. If your preferred interval wasn't on SAHI's default timeframe bar, you had to work around it. Not anymore.
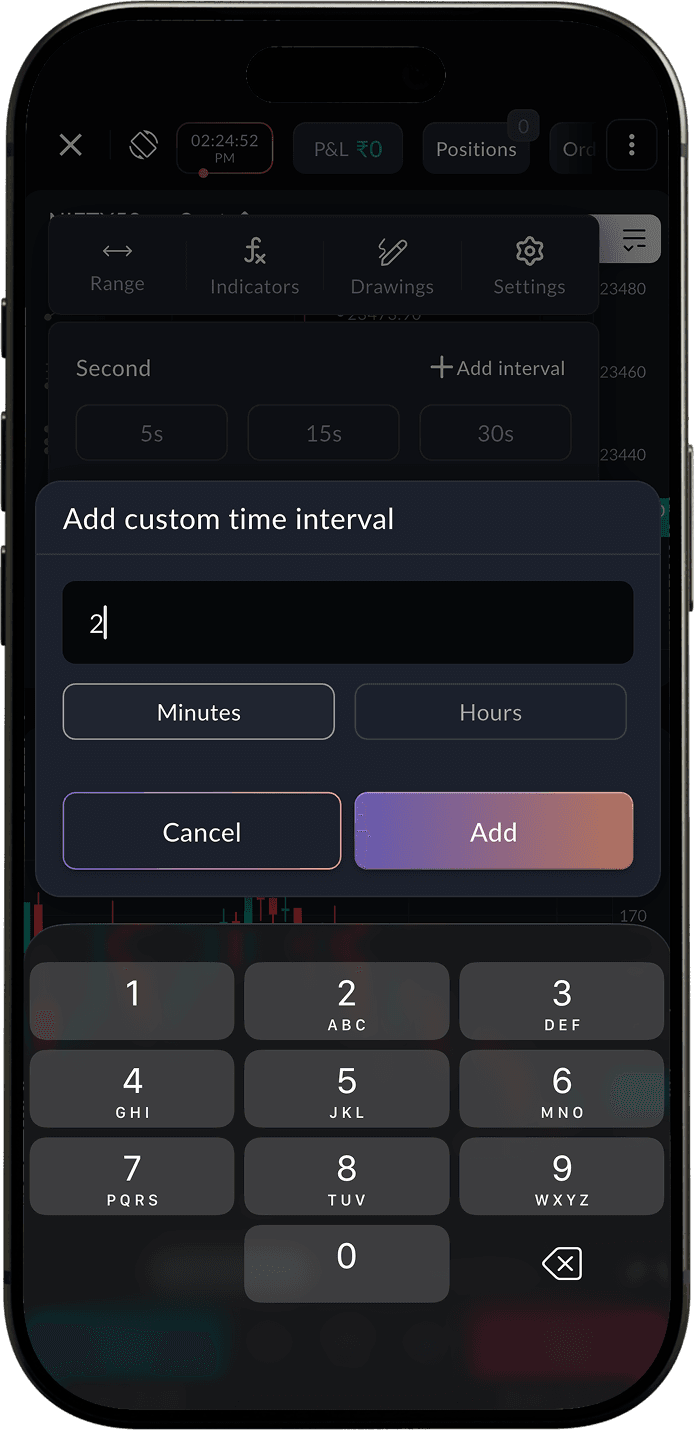
You can now add your own custom intervals directly to your chart. Tap the timeframe selector on any chart, tap Add Interval, choose between minutes or hours, and enter the value you want. It gets saved to your timeframe bar and stays there every session, so you never have to set it up again.
Your chart, your timeframe, your way.
Watchlist Chart and Column View
Your watchlist is where your trading day starts. We have made it more powerful.
You can now switch between two views directly from your watchlist: chart view and column view.
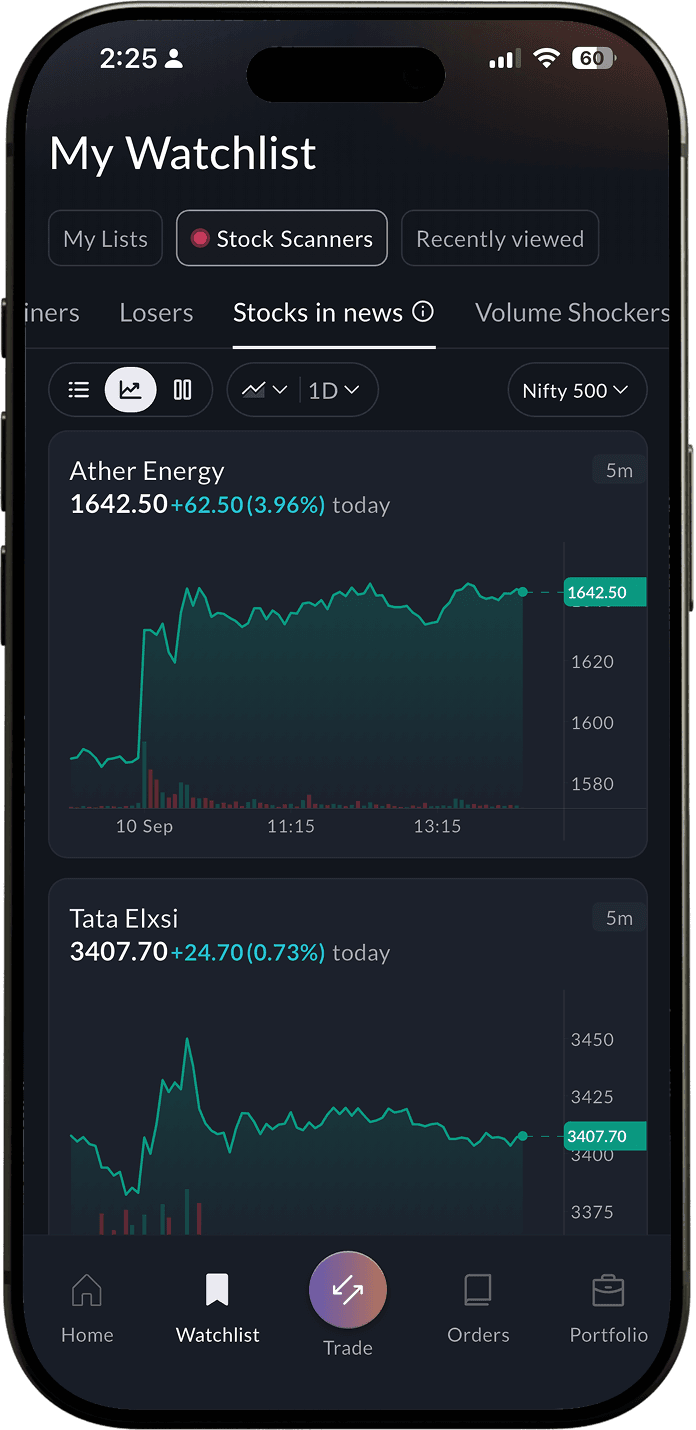
In chart view, every instrument on your watchlist shows a live chart. You can customise the chart type for each instrument, choosing from Line, Step Line, Area, Candle, Heikin Ashi, Hollow Candle, or Renko, and set the time range to 1D, 5D, 1M, 3M, 1Y, or 5Y. A quick visual read on every instrument, without opening a single chart.
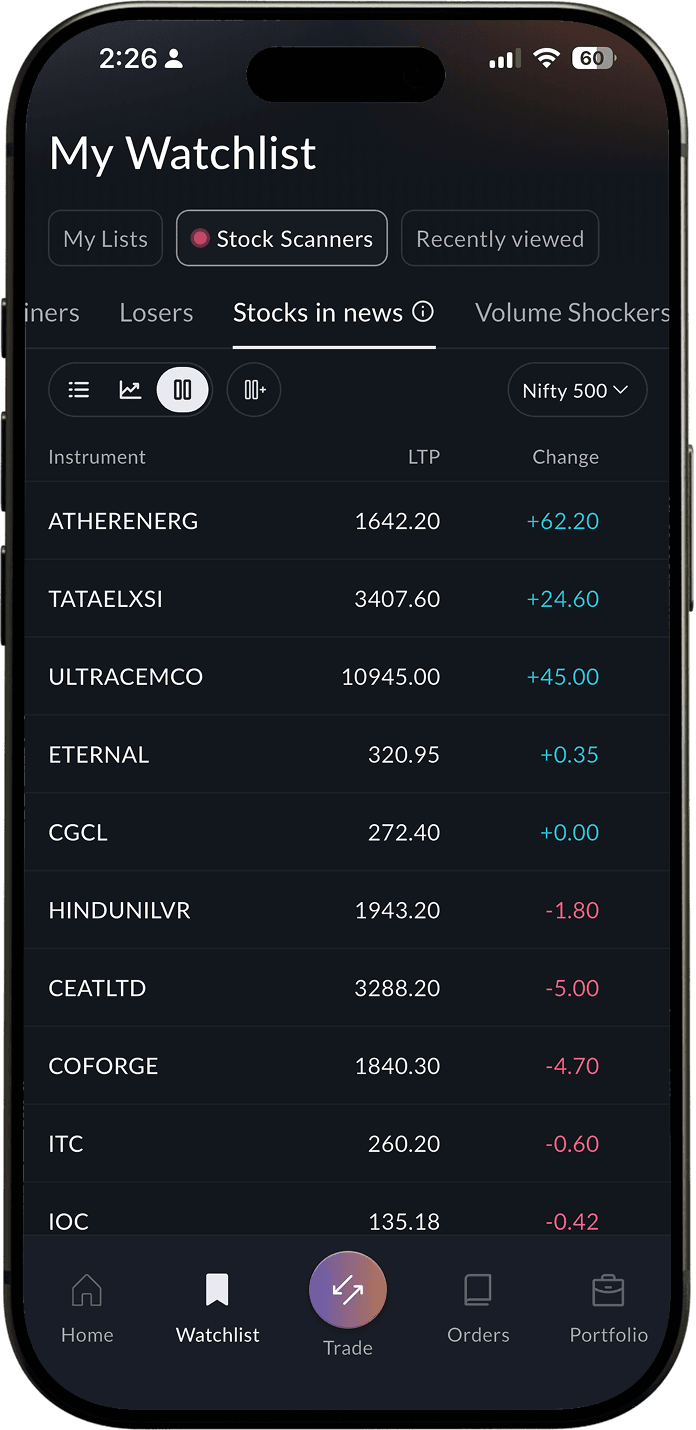
In column view, you get a clean, data-dense list of everything you are tracking. You are in full control of what data you see. Add, remove, and reorder columns from a list that includes LTP, Change, Change %, Traded Volume, VWAP, Best Bid Price, Best Ask Price, 52W High, 52W Low, Upper Circuit, Lower Circuit, Day High, Day Low, Open, Traded Value, Last Traded Time, and more. Drag to reorder. Reset any time.
Your watchlist, your data.
Options OI Buildup
Open interest tells you where conviction is sitting in the market. Options OI Buildup puts that data front and centre, live on your home screen, so you walk into every session with context.
Here is what you can see and how to use it.
Switch between Bullish and Bearish to filter by market sentiment. Then go deeper with four positioning filters.
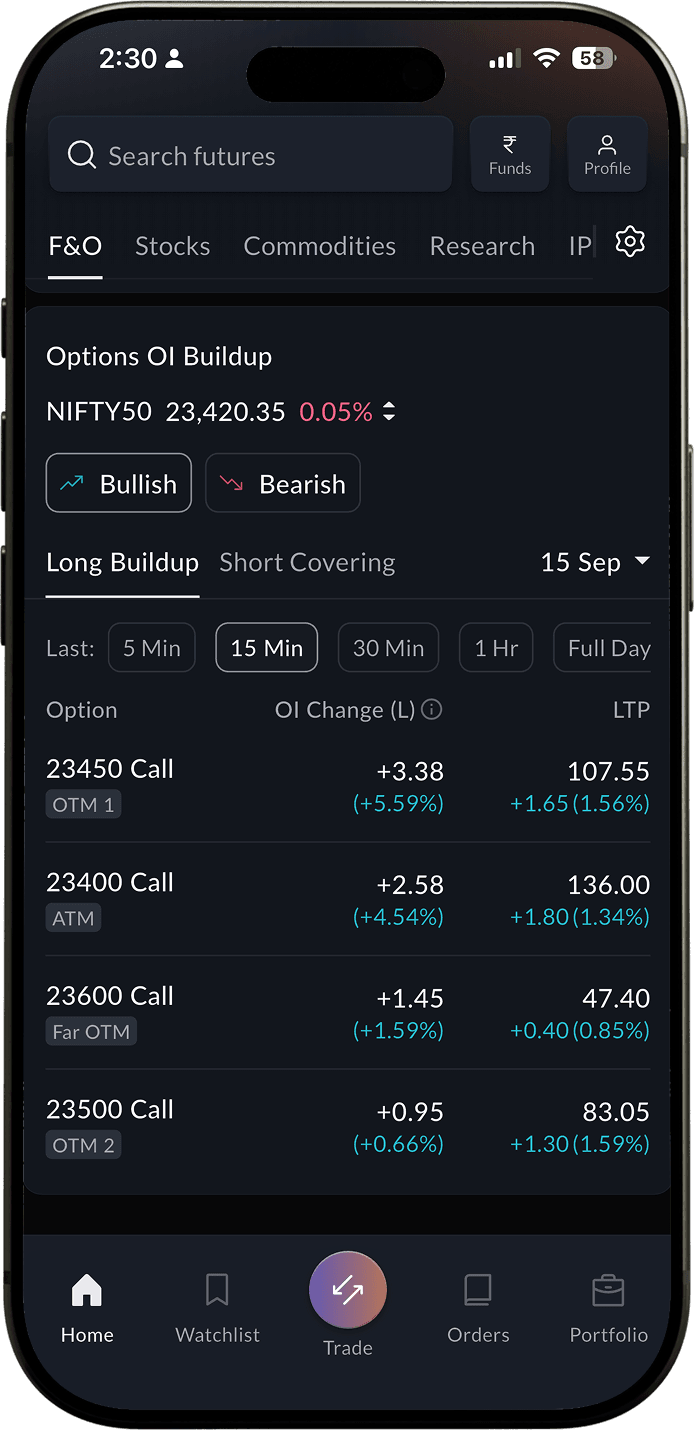
Long Buildup shows you strikes where both open interest and price are rising, a signal that fresh longs are being added and bullish conviction is building.
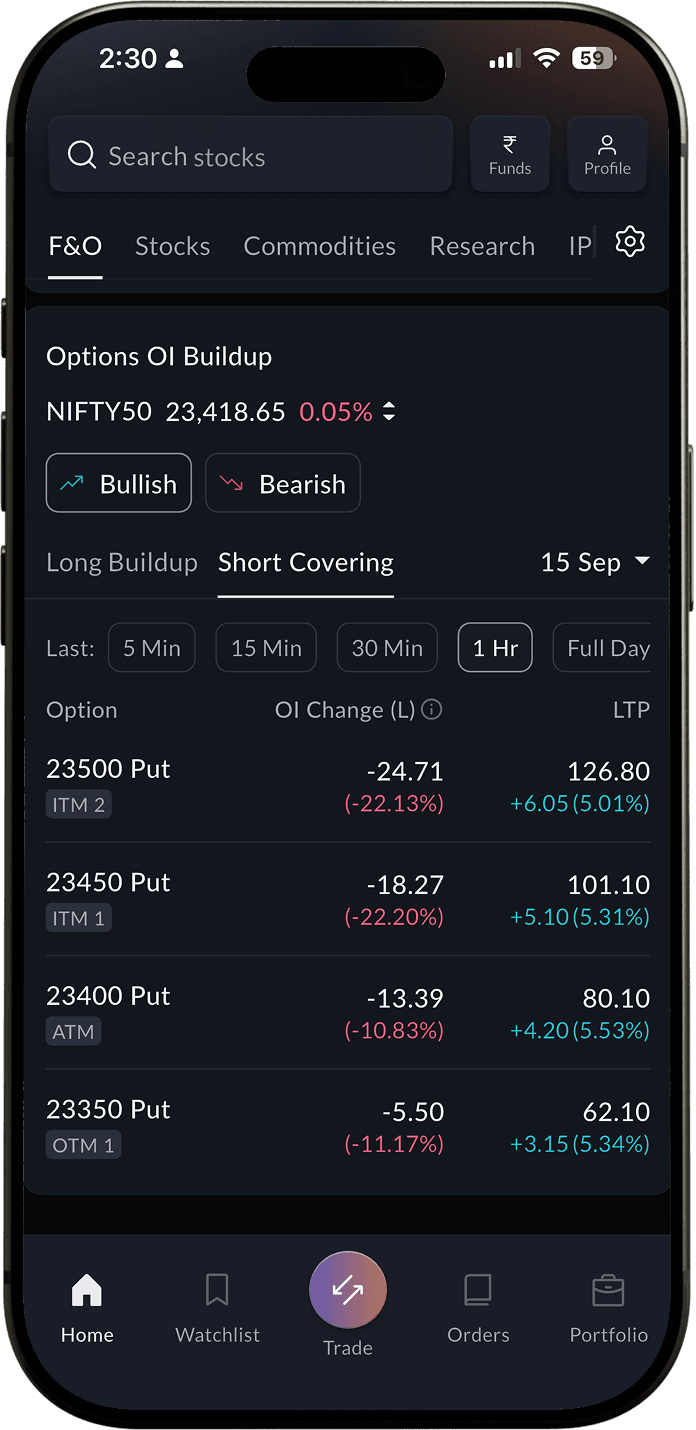
Short Covering shows you strikes where open interest is falling but price is rising, suggesting that short positions are being unwound, which can signal a potential reversal or relief rally.
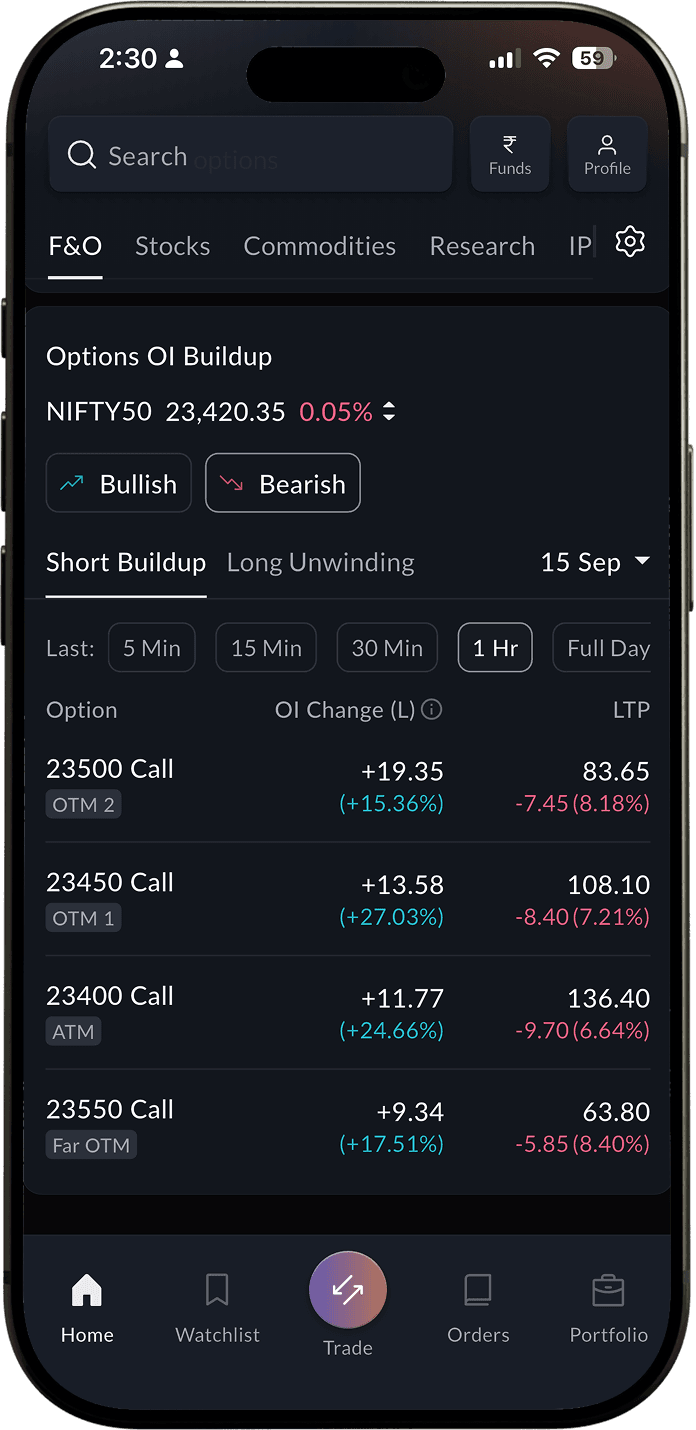
Short Buildup shows you strikes where both open interest and price are falling, a signal that fresh shorts are being added and bearish conviction is building.
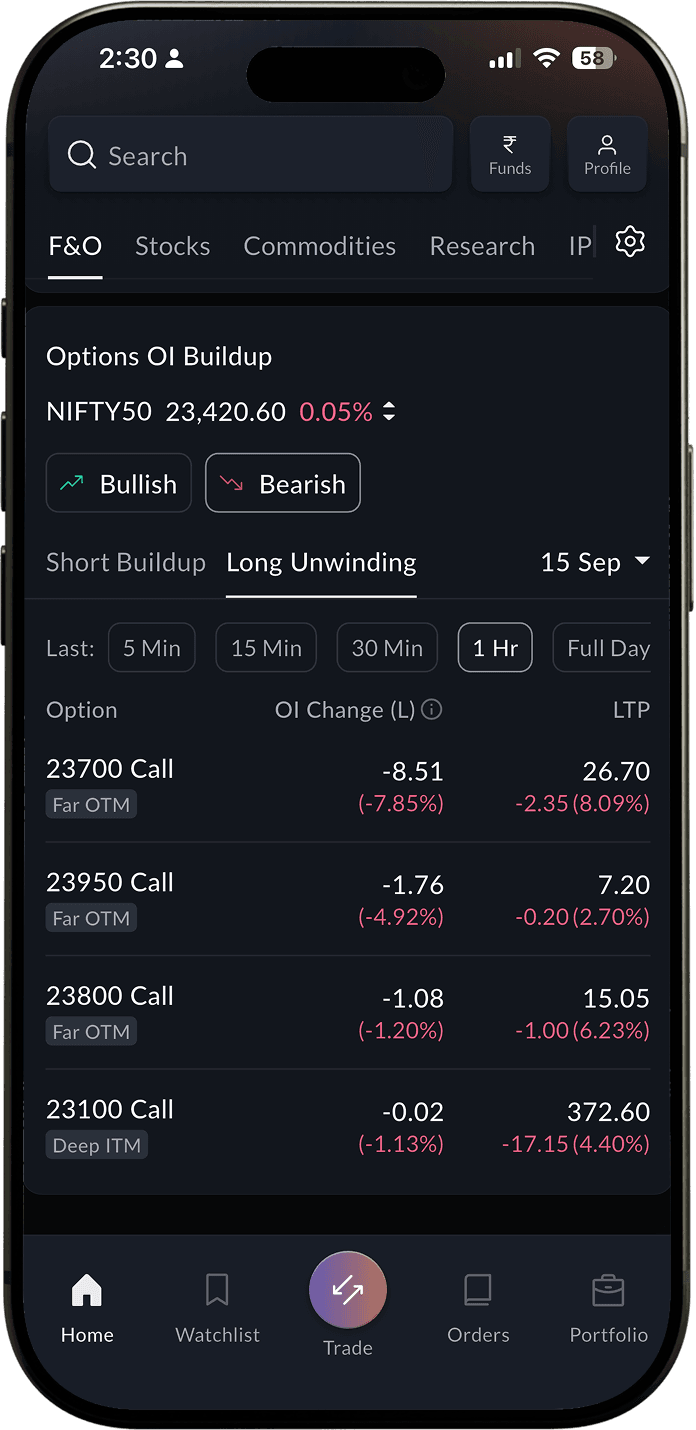
Long Unwinding shows you strikes where open interest is falling and price is also falling, suggesting that long positions are being exited, which can indicate weakening bullish momentum.
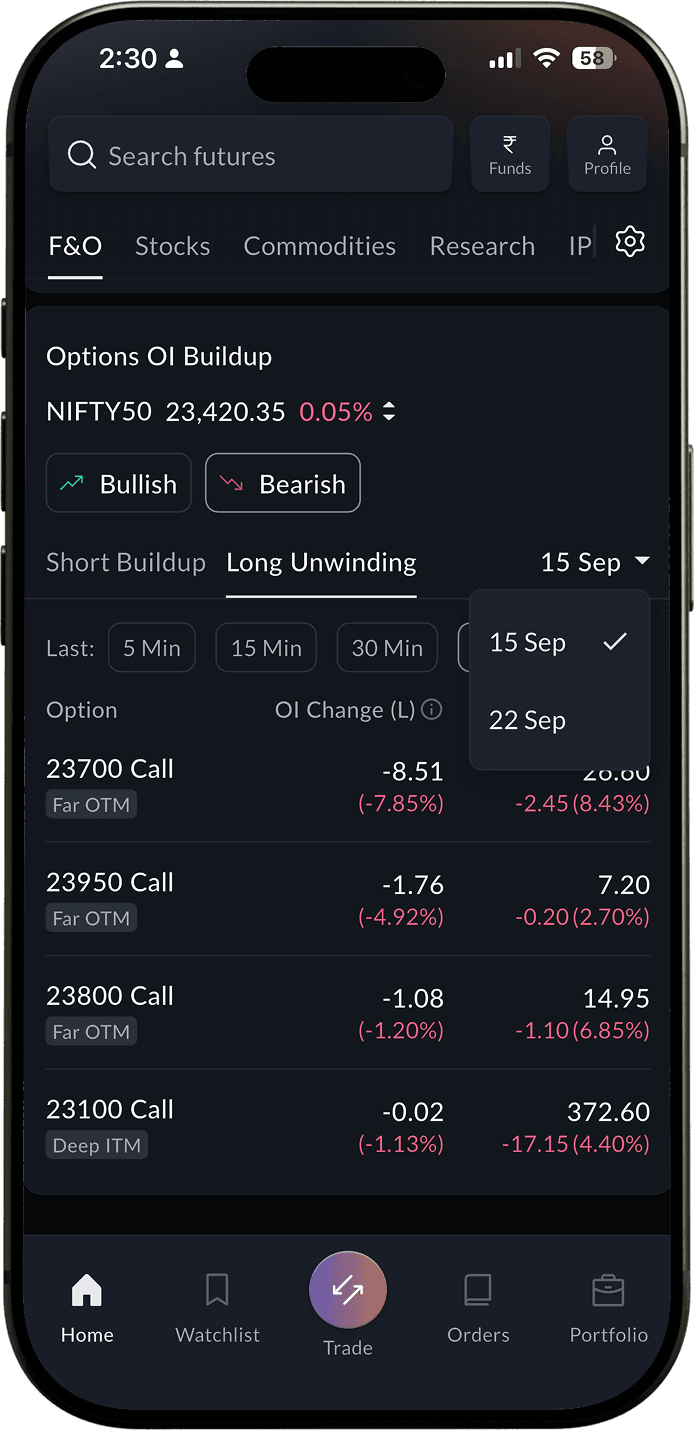
You can also select the expiry you want to track and the timeframe you want to analyse. 5 minutes, 15 minutes, 30 minutes, 1 hour, or full day. The data updates in real time so you are always looking at what is happening now, not what happened an hour ago.
Update to the latest version to start exploring.
All topics
Click the link, confirm the box next to sahi.com is checked — ignore any other results.