
We Added 17 AI-Powered Indicators to Sahi. All Free.
The indicators Indian traders have been asking for, built natively into Sahi charts. No subscription. No switching apps. Just open your chart and trade.

17 New AI Based Indicators on SAHI Charts
For months, traders on Reddit, Telegram, and trading community forums have been asking the same question: why can't I use the indicators I love inside my trading app? The requests kept coming, year after year, with no answer in sight.
We heard it. We built it.
Today we are introducing 17 new AI and machine-learning powered indicators on SAHI charts, free of cost. These are among the most favourited and most discussed indicators across the global trading community, and they are now available directly inside SAHI, on your live charts, without any additional subscription.
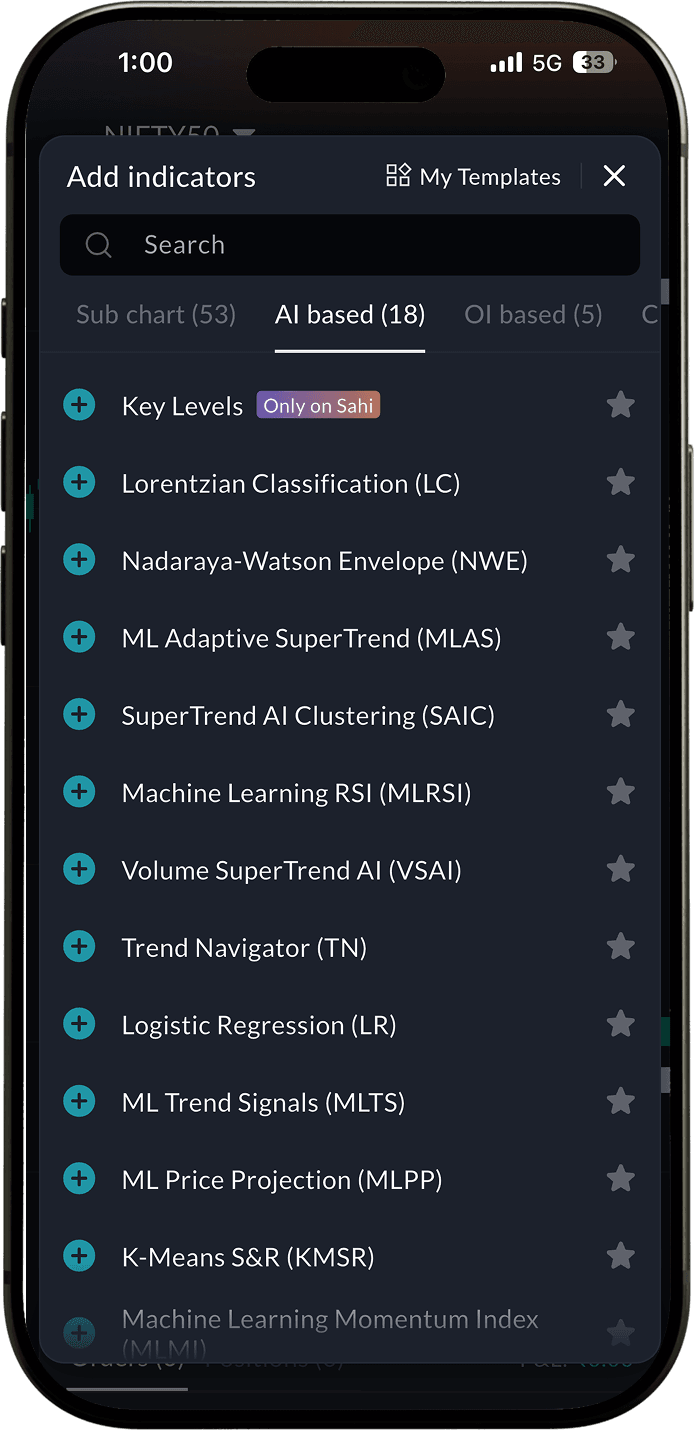
SAHI builds its own charting engine. That means we are not dependent on a third-party chart provider to decide which indicators traders can access. We can build anything directly into our charts. And so we did. The 17 new AI/ML indicators join an existing library of 100+ indicators including Key Levels, Expected Move, and OI Profile. All accessible from one screen, all free.
Lorentzian Classification (LC)
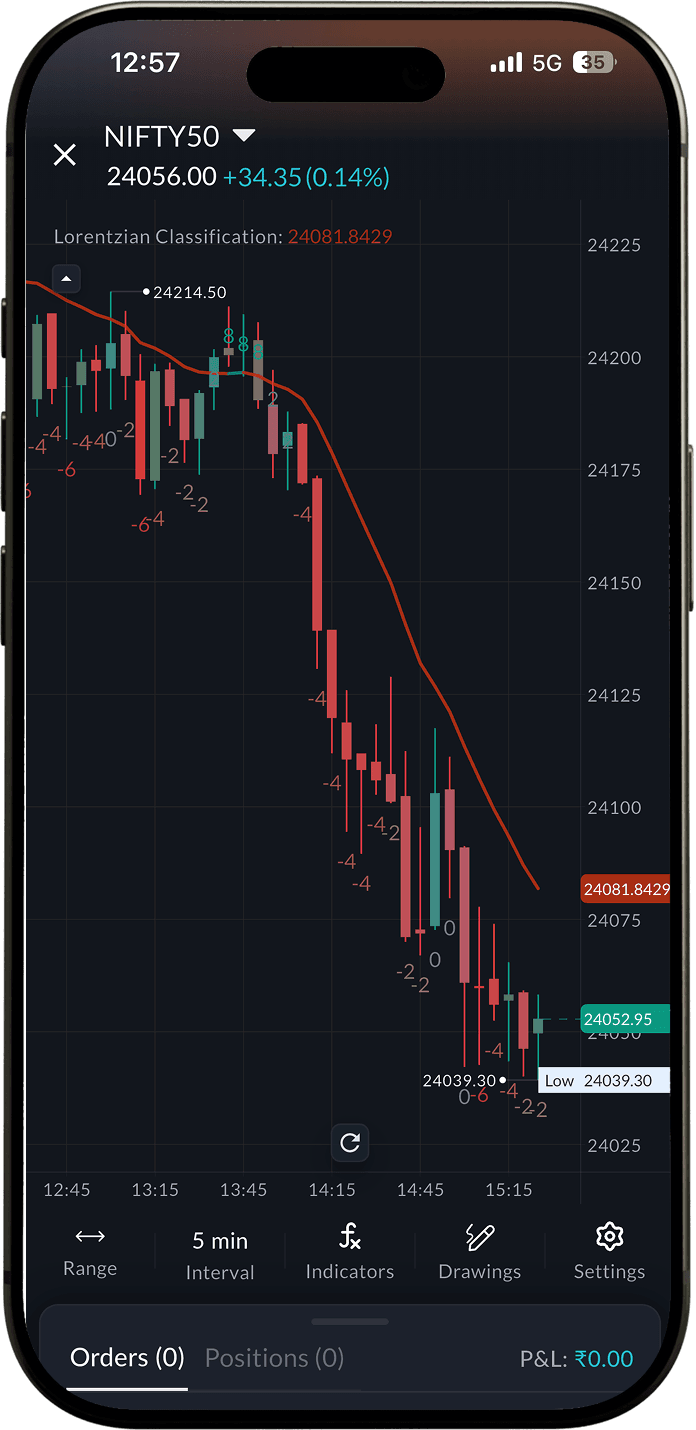
Lorentzian Classification is a machine learning indicator that uses k-nearest neighbours classification to predict the likely direction of the next price move. Instead of reacting to recent price action alone, the algorithm scans thousands of historical bars, finds past market states that most closely resemble the current one, and uses what happened after those states to generate a directional signal.
On the SAHI chart it plots a smoothed kernel regression curve over your candles, colors each bar according to the classifier's current prediction, and displays numerical confidence scores on the chart. A Trade Stats box in the top right shows live session performance metrics including signal hit rate, number of trades, and signal accuracy.
Best for: Intraday F&O traders on 5-minute Nifty and BankNifty charts who want a signal grounded in historical pattern matching rather than a fixed formula.
Nadaraya-Watson Envelope (NWE)
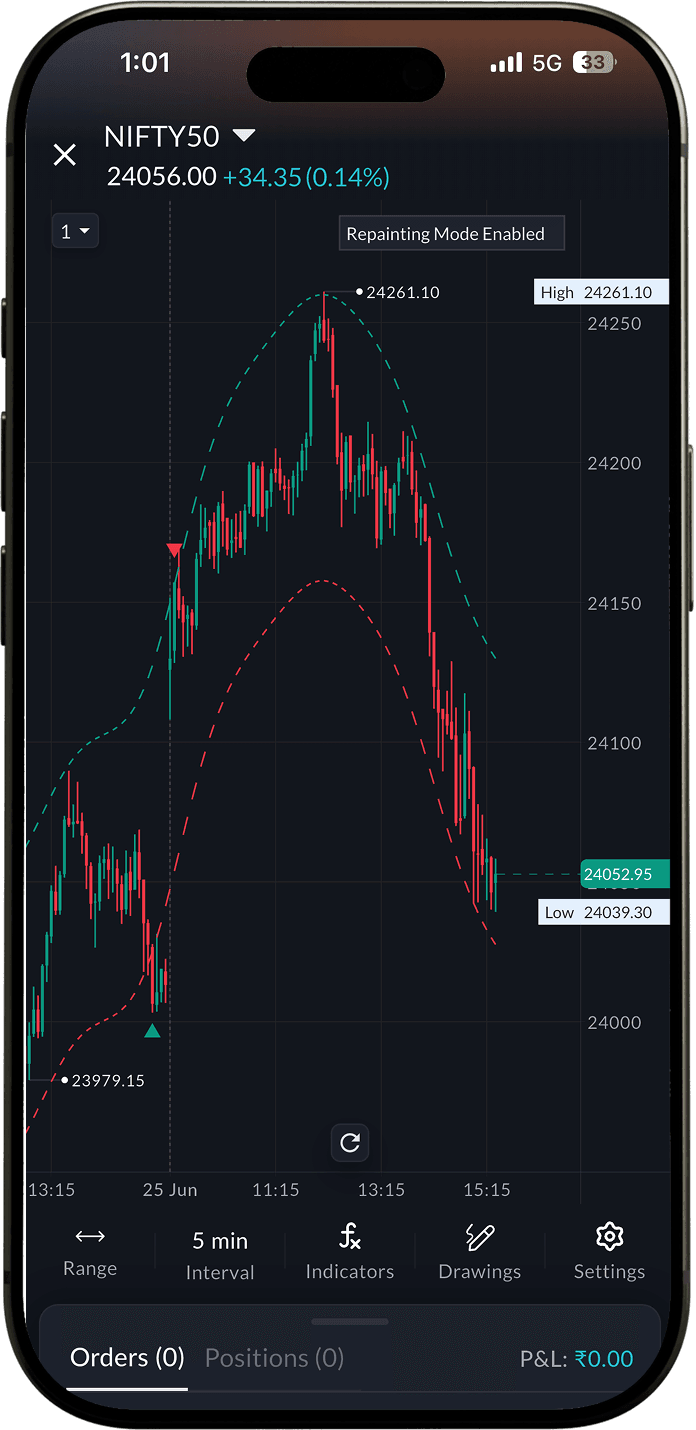
Nadaraya-Watson Envelope is a statistical smoothing indicator that fits a curved, weighted average through recent price action using a Gaussian kernel. Bars closer in time get more weight, bars further away get less. The result is a smooth, non-linear trendline that follows price without the lag spikes you get from simple moving averages. Around that midline it builds an envelope by measuring how far price typically strays from the curve, then scaling that distance by a multiplier to get upper and lower bands.
On the SAHI chart it draws two bands, a teal upper band and a red lower band, that hug price like a dynamic channel. Whenever price breaks out beyond a band and then crosses back inside, the indicator places a small arrow at that candle to mark the re-entry.
Best for: Mean reversion traders looking for price to snap back inside the channel after an overextended move on Nifty or BankNifty.
ML Adaptive SuperTrend (MLAS)
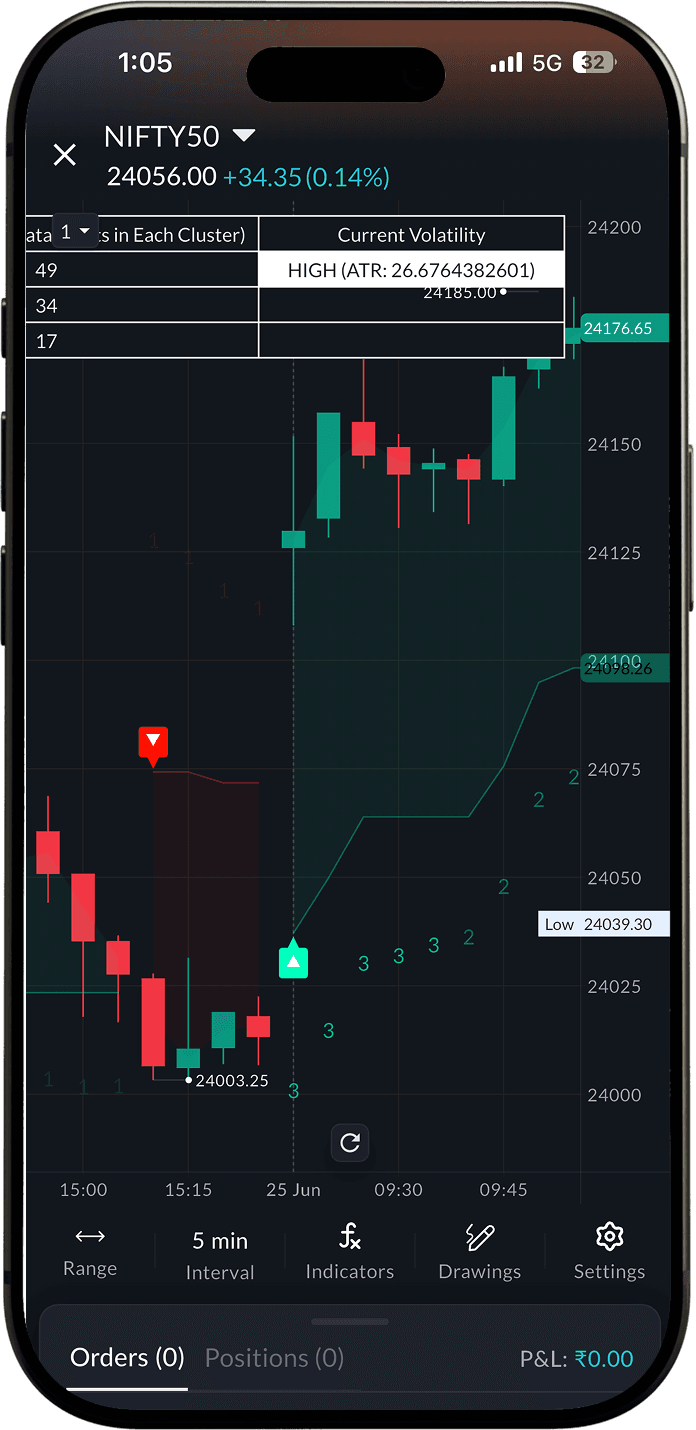
ML Adaptive SuperTrend uses k-means clustering to group recent ATR values into three volatility buckets: High, Medium, and Low. It then runs the SuperTrend calculation using whichever bucket's centroid matches the current bar's volatility. A regular SuperTrend uses a fixed ATR multiplier for every market condition. This one automatically tightens or widens its band depending on whether the market is calm, moderately volatile, or in a spike.
On the SAHI chart it draws a single adaptive SuperTrend line below price when bullish and above price when bearish, a gradient fill between the line and candle bodies, a small labelled arrow each time the trend flips, and a table in the top-right corner summarising all three volatility clusters and which one is active right now.
Best for: Trend-following traders who are tired of SuperTrend giving false signals when volatility shifts mid-session.
SuperTrend AI Clustering (SAIC)
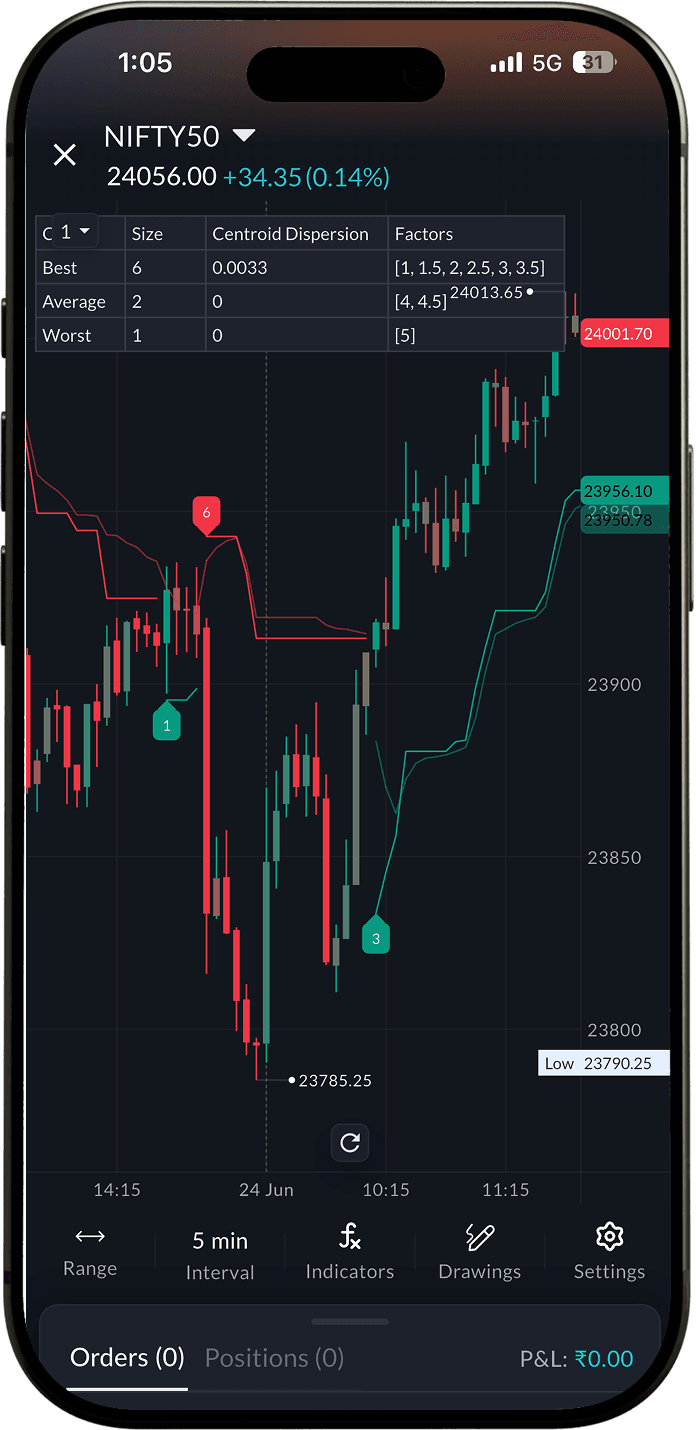
SuperTrend AI Clustering runs many SuperTrend calculations in parallel, each with a different ATR multiplier across a user-defined range, and then uses k-means clustering to sort those factor variants into three performance groups: Best, Average, and Worst. It picks the factor from your chosen cluster to drive the final trailing stop. The result is a SuperTrend line that self-tunes to whichever multiplier has been performing best on the current instrument and timeframe, rather than requiring you to guess a single fixed factor.
On the SAHI chart it draws two overlaid lines: a Trailing Stop line that flips between teal and red as trend changes, and a smoother Trailing Stop AMA line that confirms the same direction at a gentler slope. A dashboard table in the corner shows the three clusters' sizes, centroid dispersions, and the factor values assigned to each cluster.
Best for: Traders who use SuperTrend regularly but spend too much time manually optimising the ATR factor for each setup.
Machine Learning RSI (MLRSI)
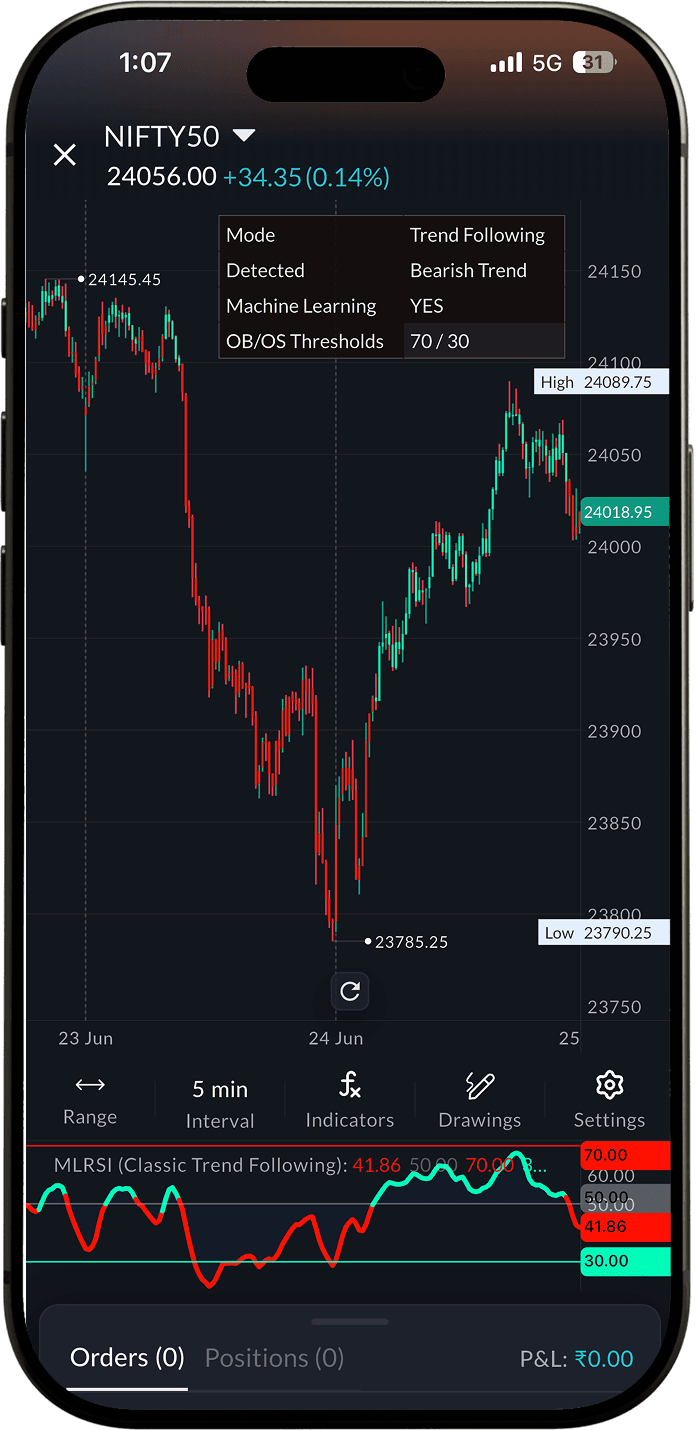
Machine Learning RSI starts from a standard RSI and blends in a K-Nearest Neighbours prediction. Each bar, the indicator looks back over a historical window, finds the K past RSI states that most closely resemble the current one using momentum, volatility, and slope as matching features, and weights their outcomes to produce a smarter RSI reading. An optional post-processing filter further smooths the result. The net effect is an RSI that reacts less to random noise while still catching real momentum shifts.
On the SAHI chart it draws a single coloured line in a separate pane, a 50 midline, gradient-filled overbought and oversold zones, and a small status table in the top-right corner. The main line and the price chart bar colours both change to reflect the current trend or impulse state.
Best for: Traders who use RSI for momentum confirmation and want a version that is less likely to give false overbought or oversold readings in trending markets.
Volume SuperTrend AI (VSAI)
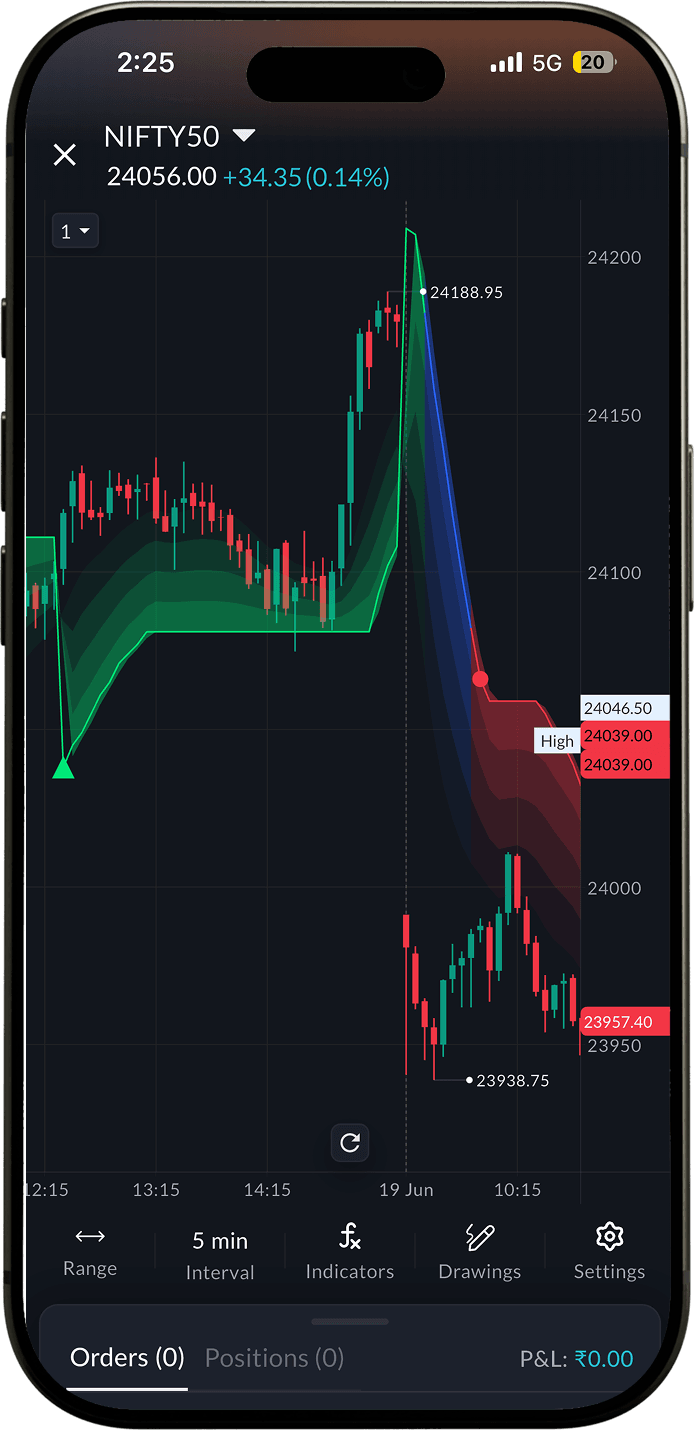
Volume SuperTrend AI combines a volume-weighted SuperTrend with a K-Nearest Neighbors machine learning layer. The SuperTrend bands are built using a volume-weighted moving average of price rather than raw price, so a burst of high volume shifts the bands more than quiet candles do. The KNN layer then classifies the current bar as bullish, bearish, or neutral based on how price has recently behaved relative to the trend.
On the SAHI chart it draws one continuous trend line that changes colour (lime green for bullish, red for bearish, blue for neutral), a gradient cloud between that line and a short-term price reference, small dots that mark the first bar of a new trend direction, and triangles that mark confirmed crossover signals.
Best for: Volume-aware trend traders who want confirmation that a trend change has institutional backing before entering.
Trend Navigator (TN)
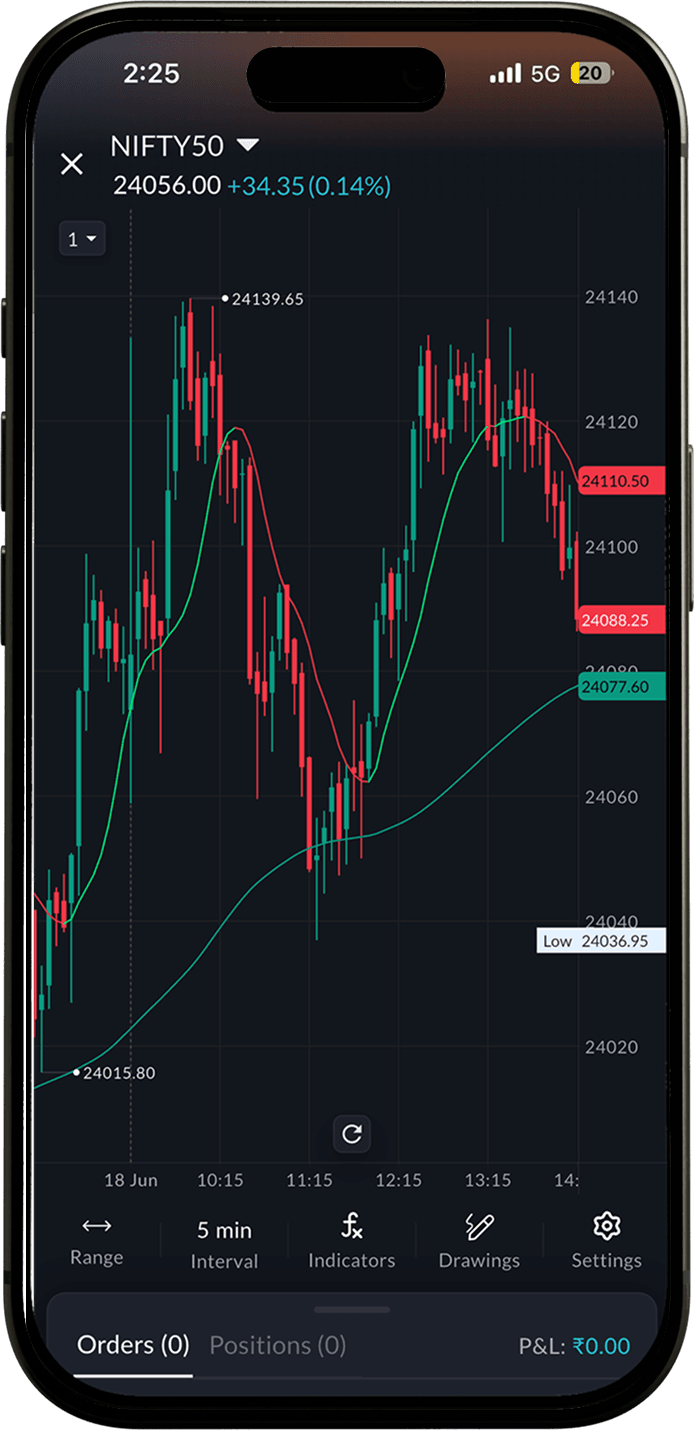
Trend Navigator uses a K-Nearest Neighbors machine-learning classifier to decide the current market direction. Instead of a fixed formula, it looks at how recent smoothed price values compare to historical ones, finding the closest historical neighbours, and votes on whether the trend is up or down. The result is a trend line that adapts to price behaviour rather than lagging in a fixed, predictable way.
On the SAHI chart it draws two lines overlaid on price: a KNN Classifier Line that changes colour bar by bar to show the live trend direction (lime green for up, red for down, orange for flat), and a slower Average KNN Classifier Line in teal that acts as a trend-confirmation baseline.
Best for: Traders who want a simple, clean trend-direction signal without cluttering their chart with oscillators.
Logistic Regression (LR)
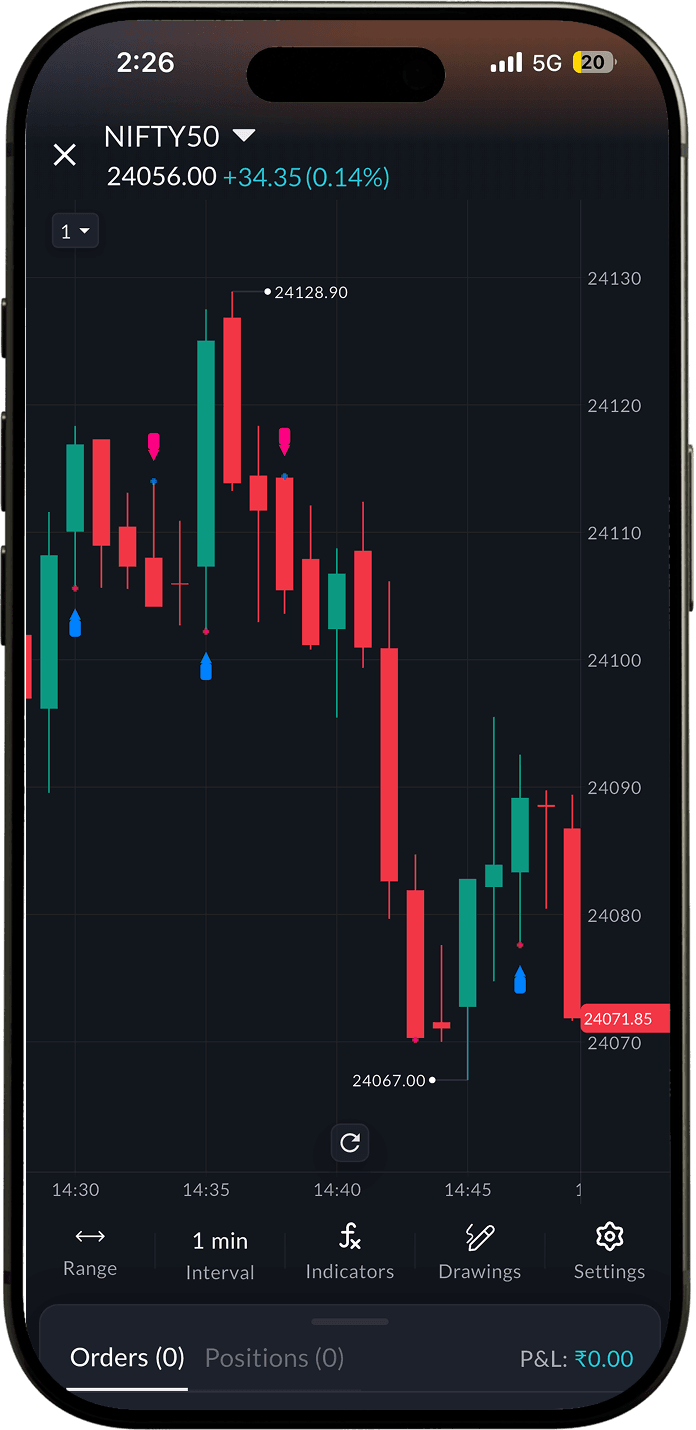
Logistic Regression is a machine-learning model adapted for price charts. It trains on price data bar by bar, computes a probability-like prediction, and classifies the market as either bullish or bearish. The core math is a sigmoid function updated through gradient descent over several hundred iterations each bar. In plain terms: the indicator keeps asking whether the current price pattern looks more like the start of a rally or the start of a drop, and flips its answer only when the evidence crosses a threshold.
On the SAHI chart it draws aqua arrow-up labels below bars when it turns bullish, and pink arrow-down labels above bars when it turns bearish. When a trade has run for its allotted holding period, it marks the exit with a cross. Optionally it can overlay two curves and display a small stats label showing cumulative return, trade count, signal accuracy, and signal hit rate.
Best for: Traders who want a classification-based signal that is explainable and rooted in a well-understood statistical model.
ML Trend Signals (MLTS)
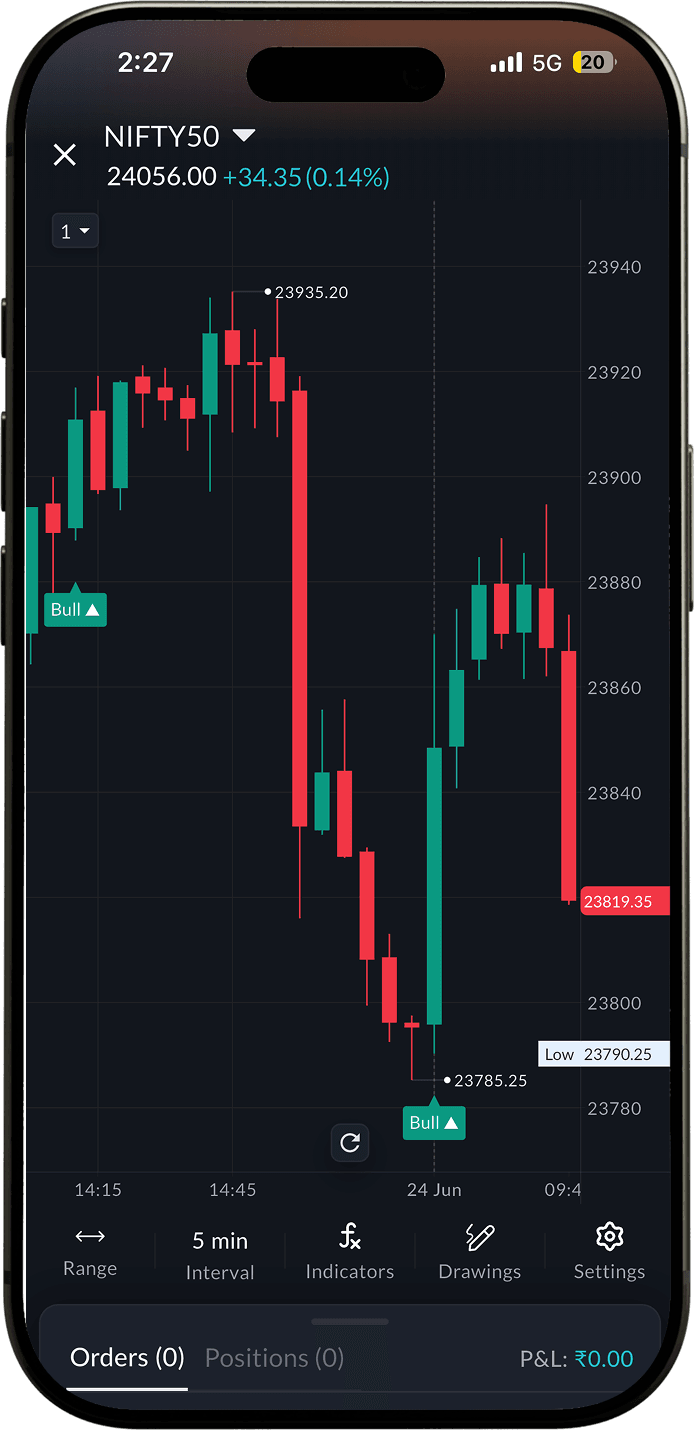
ML Trend Signals is an adaptive, self-tuning trend indicator built around a SuperTrend engine. Instead of running with fixed parameters, it runs a continuous background test matrix, scoring simulated long and short positions every bar and feeding those results into an optimiser. The optimiser then gradually adjusts the indicator's own sensitivity and band width to suit the current market character.
On the SAHI chart it draws exactly two things: a teal Bull label that appears below a candle when a bullish signal fires, and a red Bear label that appears above a candle when a bearish signal fires. There are no bands, ribbons, or lines plotted. The intelligence is entirely in the logic that decides when those labels appear.
Best for: Traders who want a minimal, clean signal marker without visual noise on the chart.
ML Price Projection (MLPP)
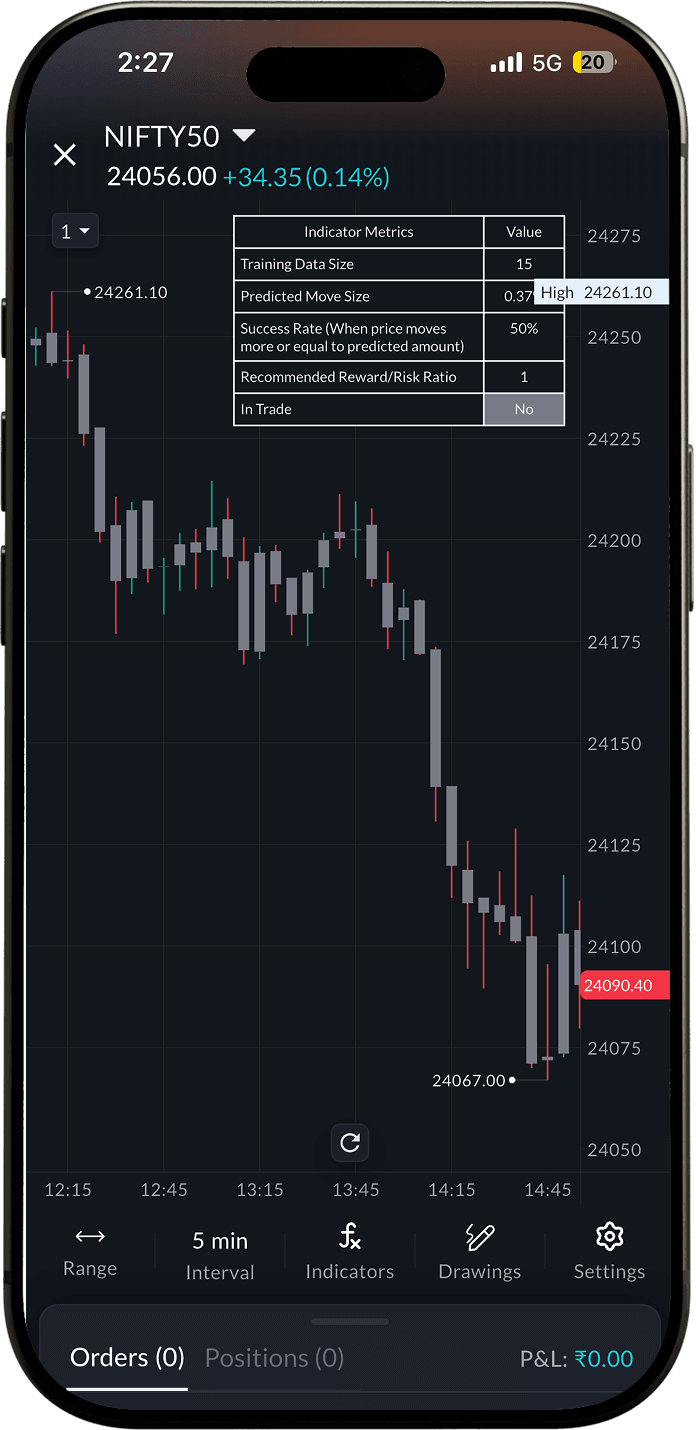
ML Price Projection uses kernel regression to estimate how far price is likely to move after a trend signal fires. Each time the selected trend indicator flips direction, the script looks back at every similar market condition it has seen before, measuring similarity across eight features including volatility, volume, RSI, and choppiness, and weights those past outcomes by how closely they match today. From that weighted average it derives a predicted move size and places a take-profit target and a stop-loss level at that distance.
On the SAHI chart it draws a green box above the signal bar for take-profit and a red box below for stop-loss on bullish signals, with the colours reversed for bearish signals. A small metrics table shows the model's training data size, the current predicted move size, the historical success rate, and the recommended reward-to-risk ratio.
Best for: Traders who want data-backed target and stop-loss levels rather than manually estimating how far a move might run.
K-Means Support & Resistance (KMSR)
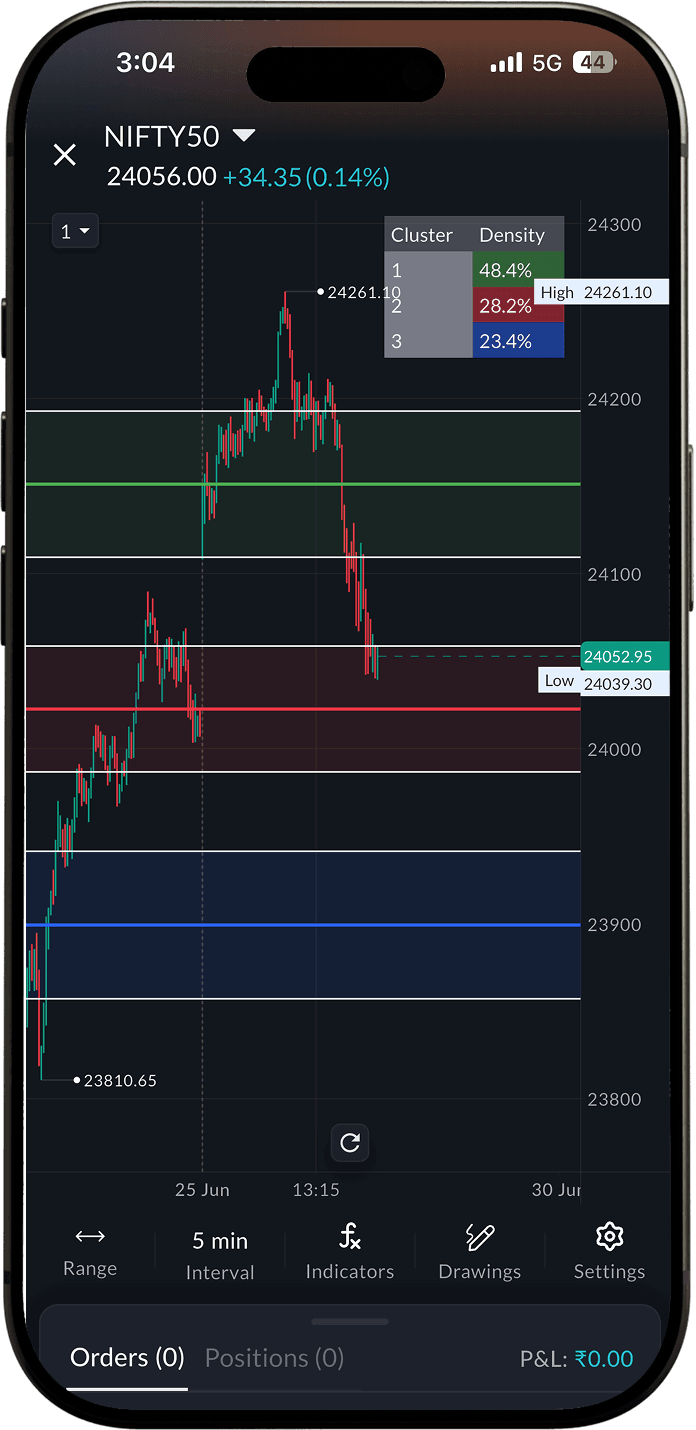
K-Means Support and Resistance uses the k-means clustering algorithm to automatically find the price levels where closing prices have historically congregated the most. Instead of drawing every pivot high and low, it mathematically groups the last N closing prices into a small number of clusters and plots each cluster's centre as a horizontal line. The result is a compact, objectively derived set of support and resistance levels that are not hand-drawn and not subjective.
On the SAHI chart it draws 3 to 5 horizontal lines, each colour-coded by cluster. When Show SD Bands is enabled, each line is wrapped in a faint shaded band showing how tightly price has traded around that cluster centre. A small table in the top-right corner shows each cluster's number and density.
Best for: Traders who want objective support and resistance levels without the subjectivity of manually drawing pivot zones.
Machine Learning Momentum Index (MLMI)
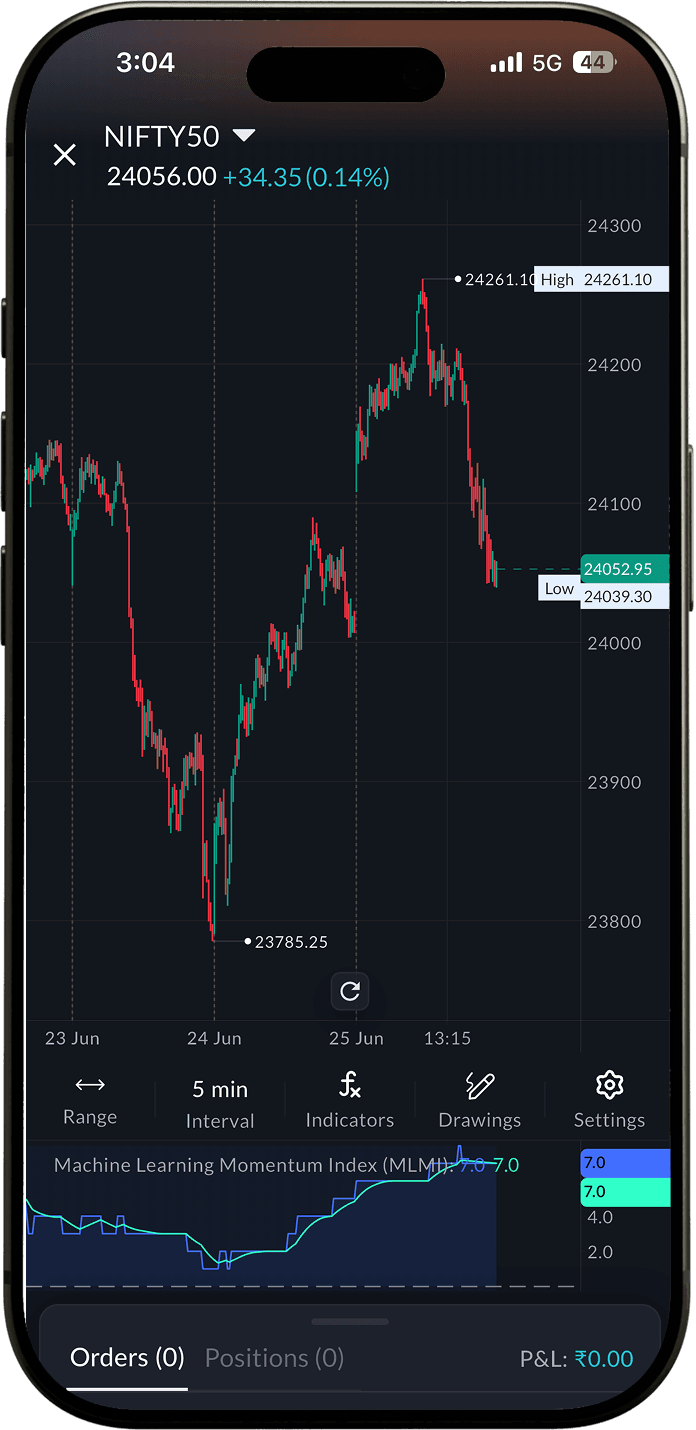
Machine Learning Momentum Index uses a k-Nearest Neighbors algorithm to make a momentum prediction for the current bar. It builds a historical library of past momentum states, each state described by two smoothed RSI values (a fast one and a slow one), and at every new bar asks which past states looked most similar and whether price went up or down afterward. The sum of those neighbours' outcomes becomes the prediction line.
On the SAHI chart it plots in a separate pane below price. You see a blue prediction line, a teal signal line, a zero line running horizontally through the middle, and two gradient fills: a green haze above zero for bullish territory and a red haze below zero for bearish territory.
Best for: Traders who use momentum oscillators as a primary filter and want one that adapts to recent market structure.
ML Moving Average (MLMA)
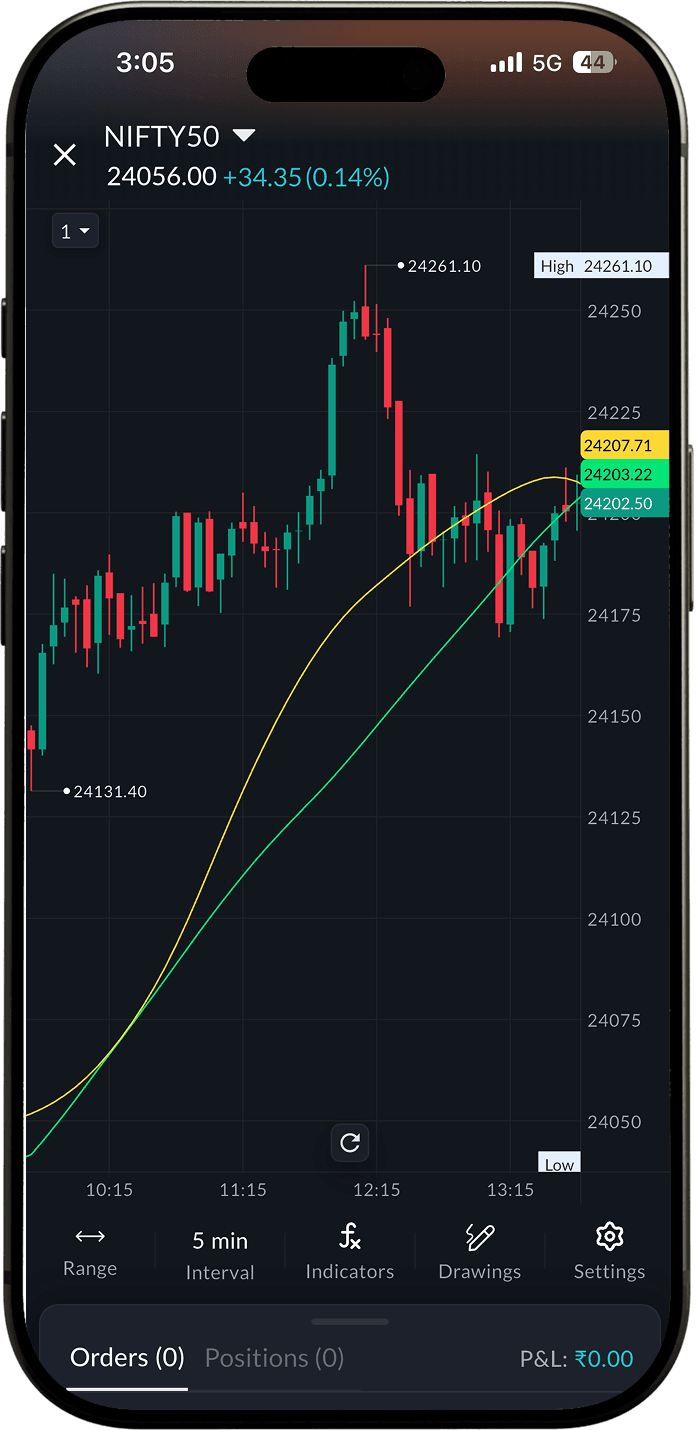
ML Moving Average uses two separate machine-learning algorithms: a weighted k-Nearest Neighbours classifier and a KNN-based averaging function. The first labels every bar as bullish or bearish, then fits a live linear-regression slope to the run of labels since the last trend flip. The second finds the closest historical price values to a smoothed average and takes their mean, a complementary way to pull a noise-filtered curve from price.
On the SAHI chart it draws up to five overlapping elements: a colour-coded moving average line that turns green, red, or blue depending on the trend label; a slope line whose angle and colour show the strength and direction of the current run; and two additional curves that track price with different smoothing depths.
Best for: Traders who use moving averages as their primary trend filter and want one that adjusts its behaviour based on recent pattern history.
kNN Market Architecture (KNNMA)
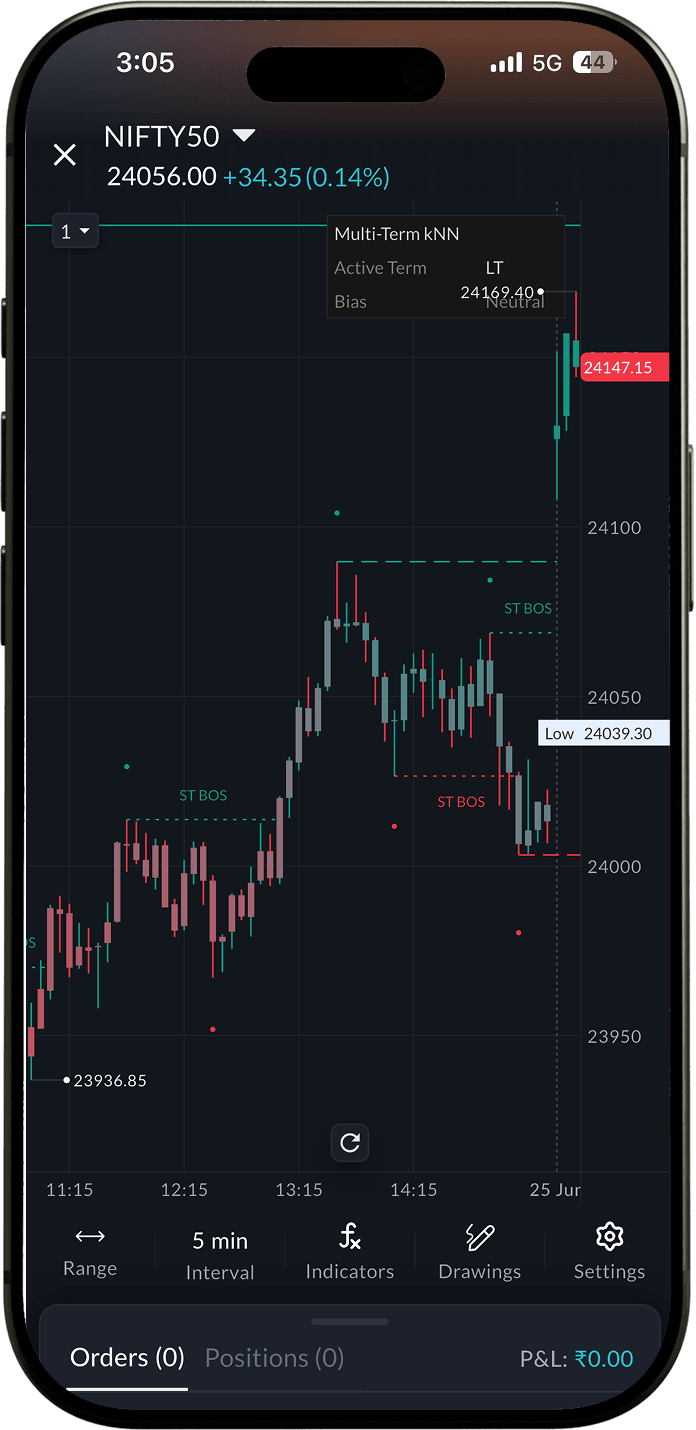
kNN Market Architecture identifies validated market structure (swing highs and lows) across three timeframe tiers simultaneously, then filters each pivot using a k-Nearest Neighbours classifier before accepting it. Instead of marking every pivot the chart produces, the algorithm compares each new candidate against a rolling library of past pivots using relative ATR and relative volume at the pivot bar, and only confirms the point if its kNN confidence score clears a threshold.
On the SAHI chart it draws three layers of horizontal lines (short-term dotted, medium-term dashed, long-term solid) in green for highs and red for lows. A gradient system paints every candle based on where price sits relative to the active structure range. A Delta Tank label tracks cumulative volume delta since the last structure point.
Best for: Structure-based traders using SMC or ICT concepts who want a machine-learning filter to remove low-quality pivot points.
Neural Network Bull and Bear Signals (NNBBS)
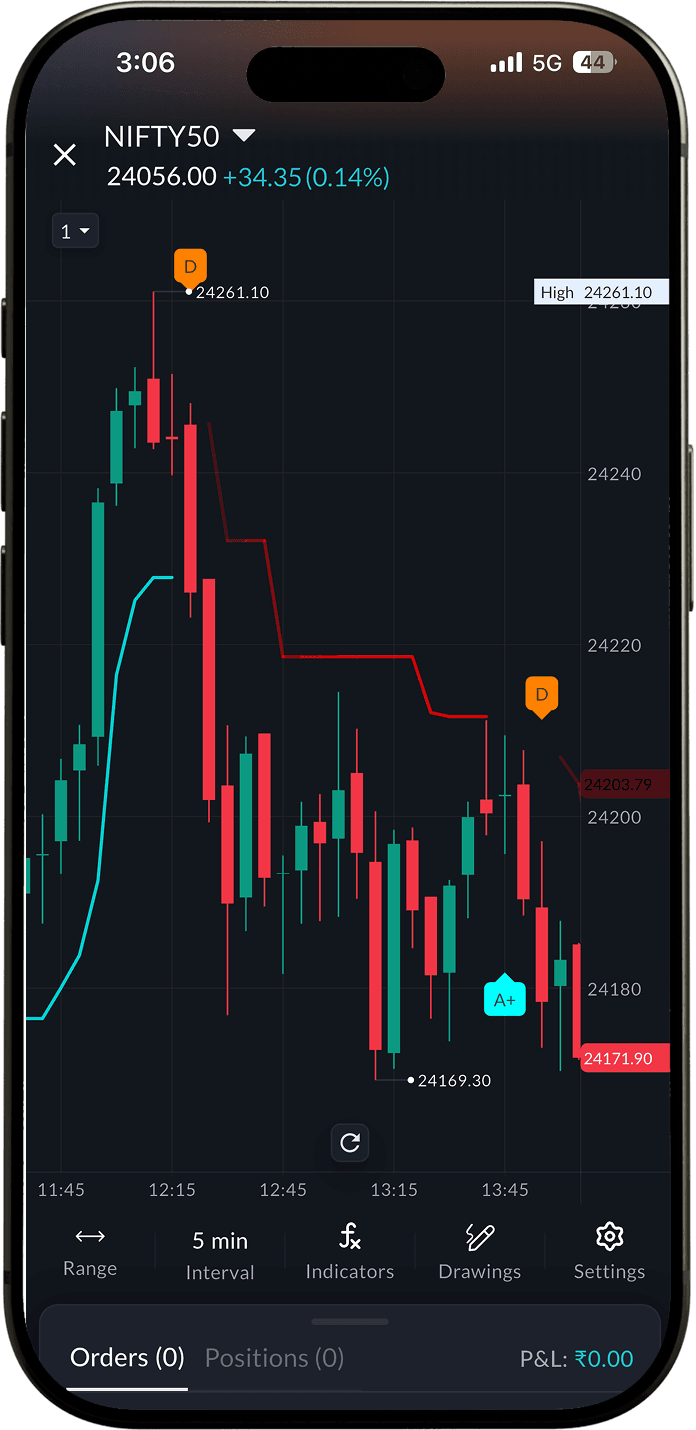
Neural Network Bull and Bear Signals uses a small, fixed neural network to score every potential entry before showing it on the chart. When a momentum flip occurs, the indicator runs the raw signal through five market context inputs: an adaptive momentum filter, two moving average relationships, proximity to recent support and resistance pivots, swing structure, and a market regime check via ADX. Those five scores are fed into three hidden layers with tanh activation and a final sigmoid output, producing a confidence score between 0 and 1. Signals are letter-graded A+ through F and shown only if they pass the grade filter you have set.
On the chart it draws grade labels placed directly above or below each qualifying bar, and once a label fires, a trailing SuperTrend stop line that follows price until the trade is invalidated. There are no oscillator panels. Just the labels and the stop line on the main price chart.
Best for: Traders who want a neural network-filtered entry signal with a built-in trailing stop, without managing a complex multi-panel setup.
Machine Learning Momentum Oscillator (MLMO)
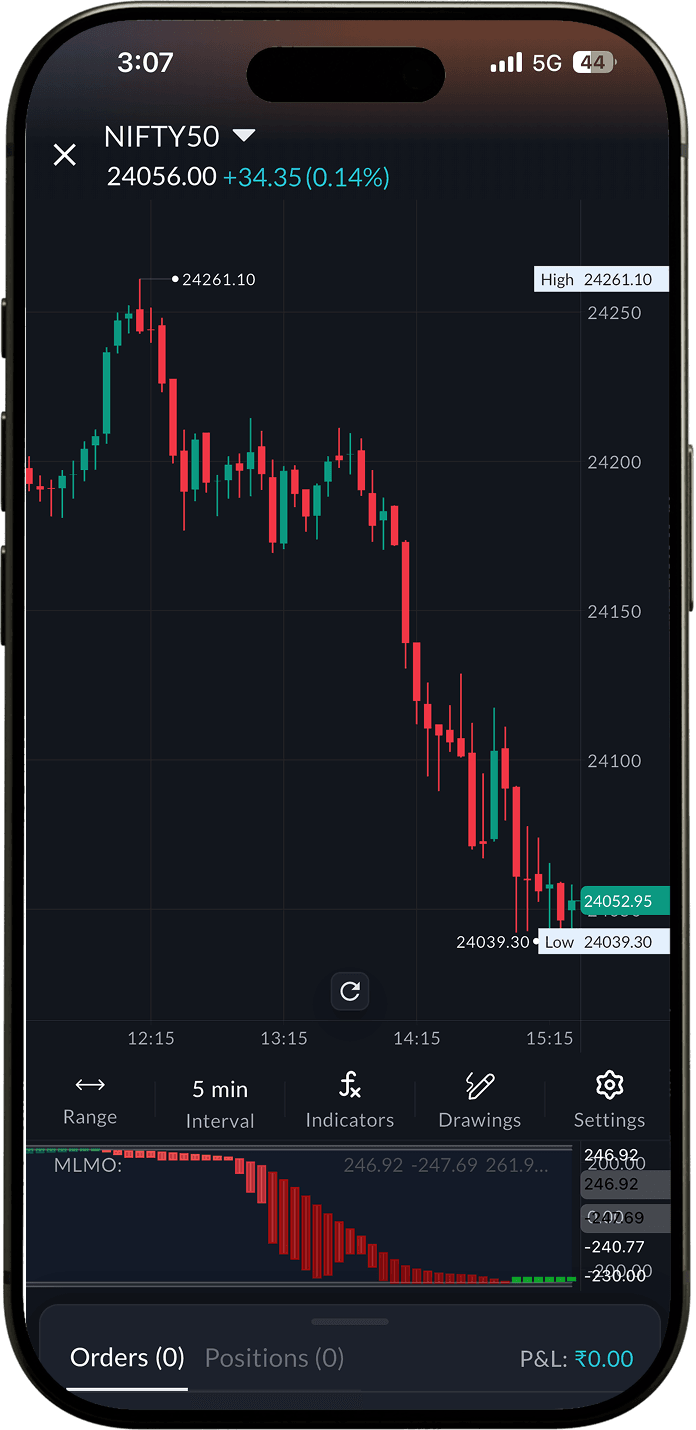
Machine Learning Momentum Oscillator uses a k-Nearest Neighbours algorithm to read momentum. At each bar it computes two momentum signals (a faster bear signal and a slower bull signal), then finds the N most similar past bars from the entire chart history and votes those neighbours' directions together into a single prediction value. The result is an oscillator that adapts its shape to the data it has seen rather than using a fixed formula.
In the separate pane below the chart the indicator draws a column of candles made from its raw prediction and a smoothed version of that prediction. The background of the oscillator is a gradient that shifts from red near the top of the historical range to blue near the bottom.
Best for: Traders who want an oscillator that self-adjusts to the current market's noise level rather than requiring manual parameter tuning.
Kernel Momentum (KM)
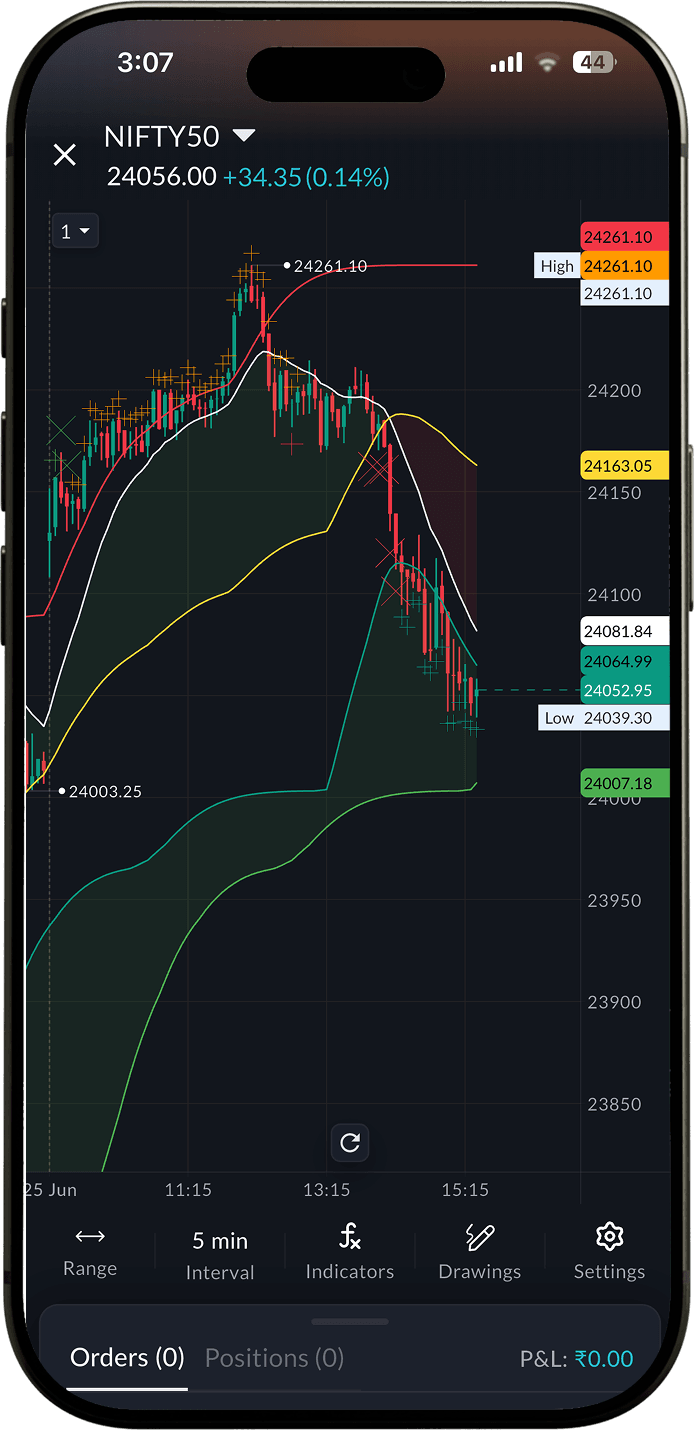
Kernel Momentum uses a Rational Quadratic Kernel to filter price, highs, and lows across two zone widths simultaneously. Instead of a fixed moving average, the kernel weighs recent bars more heavily while still considering older bars, giving a smooth, lag-reduced view of where price sits relative to its historical range. On top of that, it computes a faster Gaussian kernel and watches for the two kernels to cross, which flags shifts in short-term momentum direction.
On the SAHI chart it draws six lines forming an inner band and an outer band around price, a mid line through the inner band, and a coloured fill between the kernel of close and the mid line. When signals are enabled it plots small cross markers above and below bars for four distinct conditions: regular bullish momentum, regular bearish momentum, overly bullish momentum stretch, and overly bearish momentum stretch.
Best for: Traders who want a kernel regression-based momentum view that is more statistically robust than a standard moving average crossover system.
All 17 indicators are live on SAHI now. Open your chart, tap Indicators, and go to the AI based tab to find them.
All topics
Click the link, confirm the box next to sahi.com is checked — ignore any other results.