

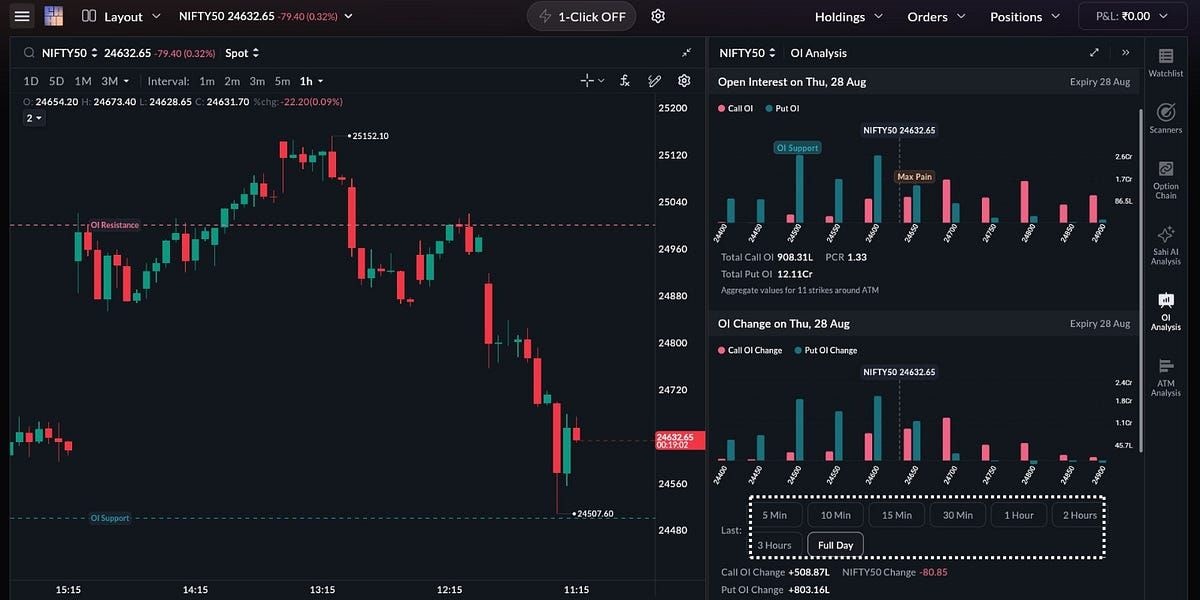
Intraday Leverage Display, Gann Drawing Tools and RizeX Lite
4 min read
Published 11 Sept 2026, 10:00 PM ISTUpdated Tue, 6 Oct, 2026, 05:30 AM IST
Trade Smarter, Not Harder
Receive market breakouts, AI insights, and trading strategies directly in your inbox.
What's New on SAHI
Here's what's new on SAHI this week.
Intraday Leverage Display
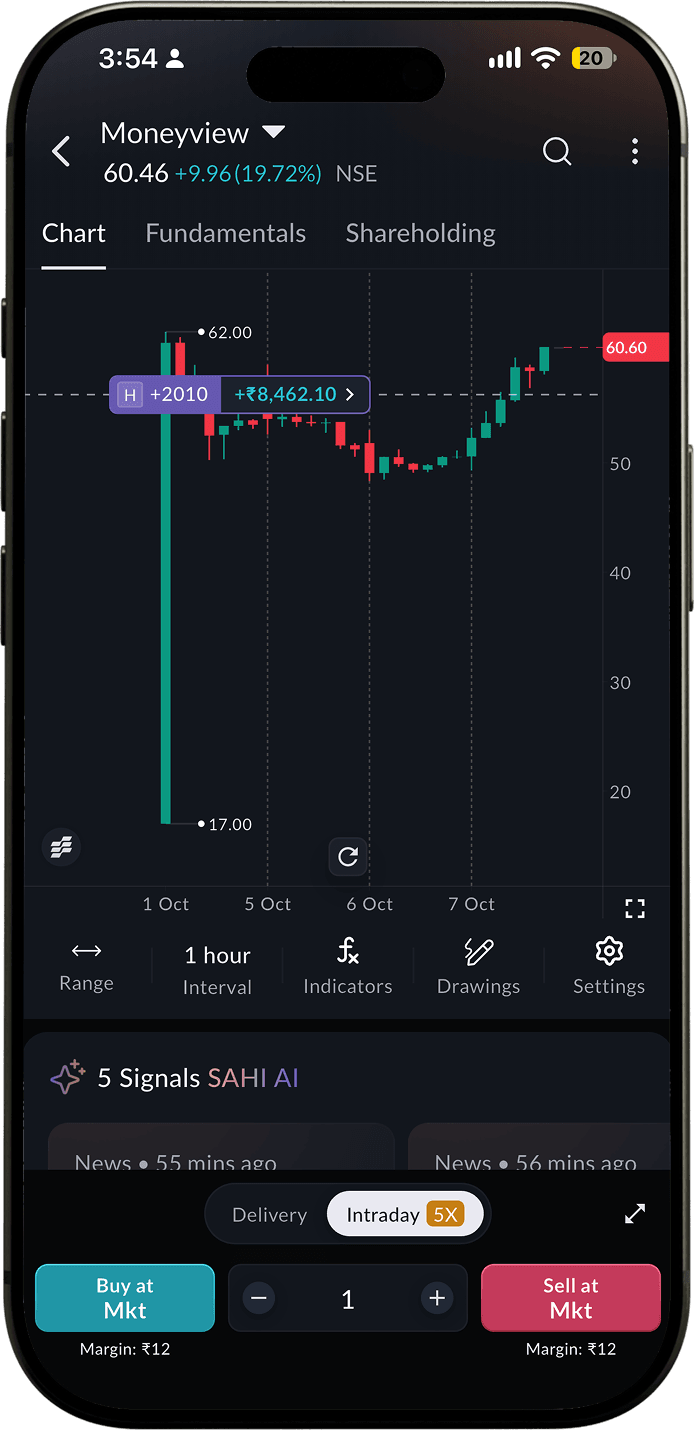
When you trade intraday, your buying power is not the same as your account balance. It depends on the leverage available for that specific stock, and that number varies. Until now, you had to know it before you opened the order form.
Not anymore.
Your order form and 1-Tap now show you the leverage you get on each stock in intraday mode, right there before you place the trade. From 2X to 5X, depending on the stock. No mental math, no assumptions. You see your buying power before you commit to a position.
Gann Drawing Tools
Gann analysis is one of the oldest and most respected frameworks in technical trading. SAHI now supports four Gann drawing tools, fully customisable and saved across sessions and devices so your work is always there when you come back.
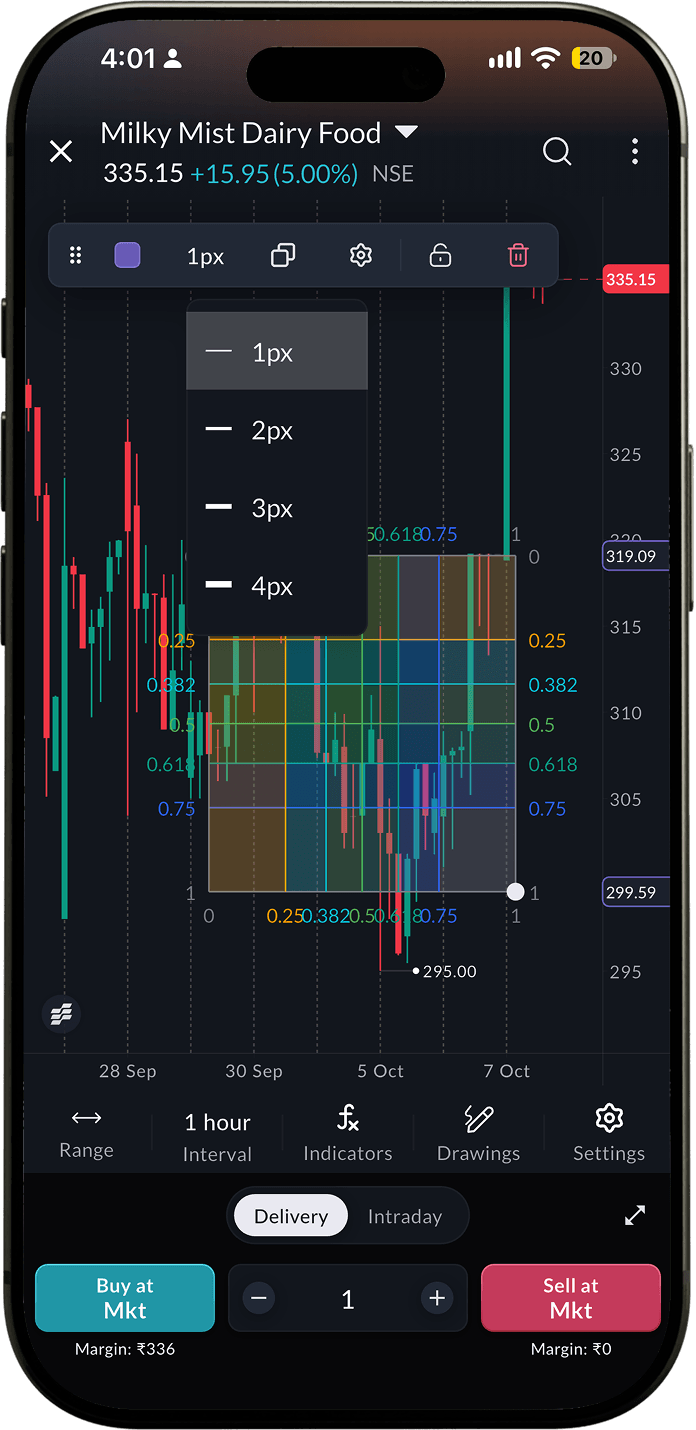
Gann Box divides price and time into a grid of geometric proportions, helping you identify support, resistance, and time cycles simultaneously. Traders use it to spot where price and time converge, which often marks significant turning points.
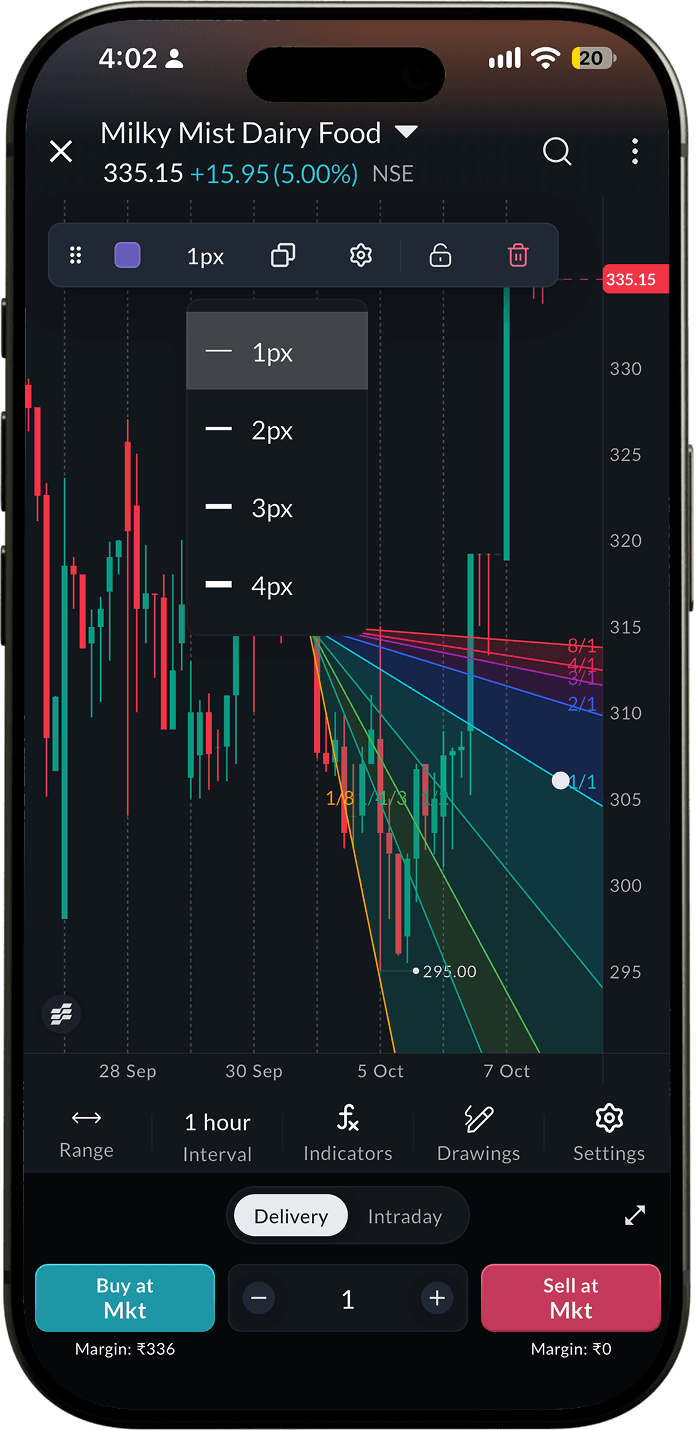
Gann Fan draws a set of diagonal lines from a significant high or low at specific angles, most notably the 1x1 line which represents equal units of price and time. Price trading above the 1x1 is generally considered bullish, below it bearish. The fan lines act as dynamic support and resistance as price moves through time.
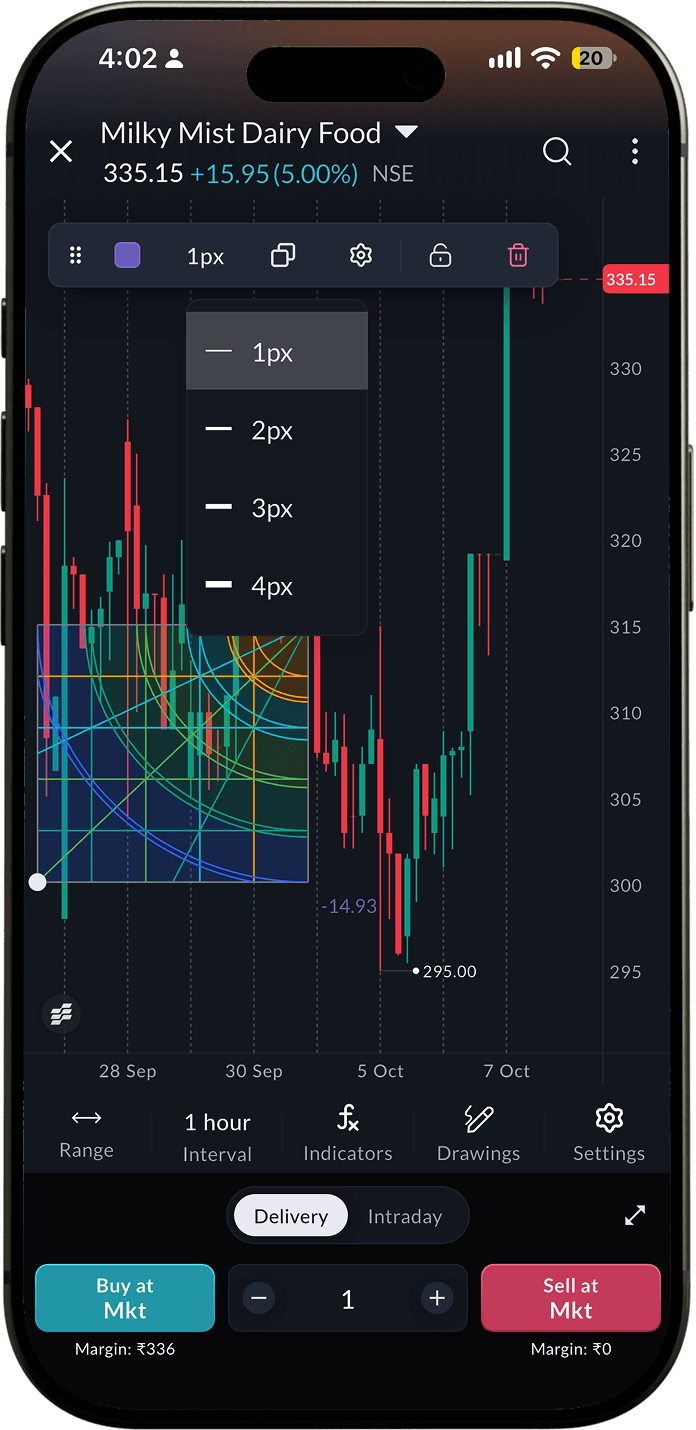
Gann Square builds a square where price and time are equal, letting you project future support and resistance levels from a significant price point. It is particularly useful for identifying where a move may stall or reverse.
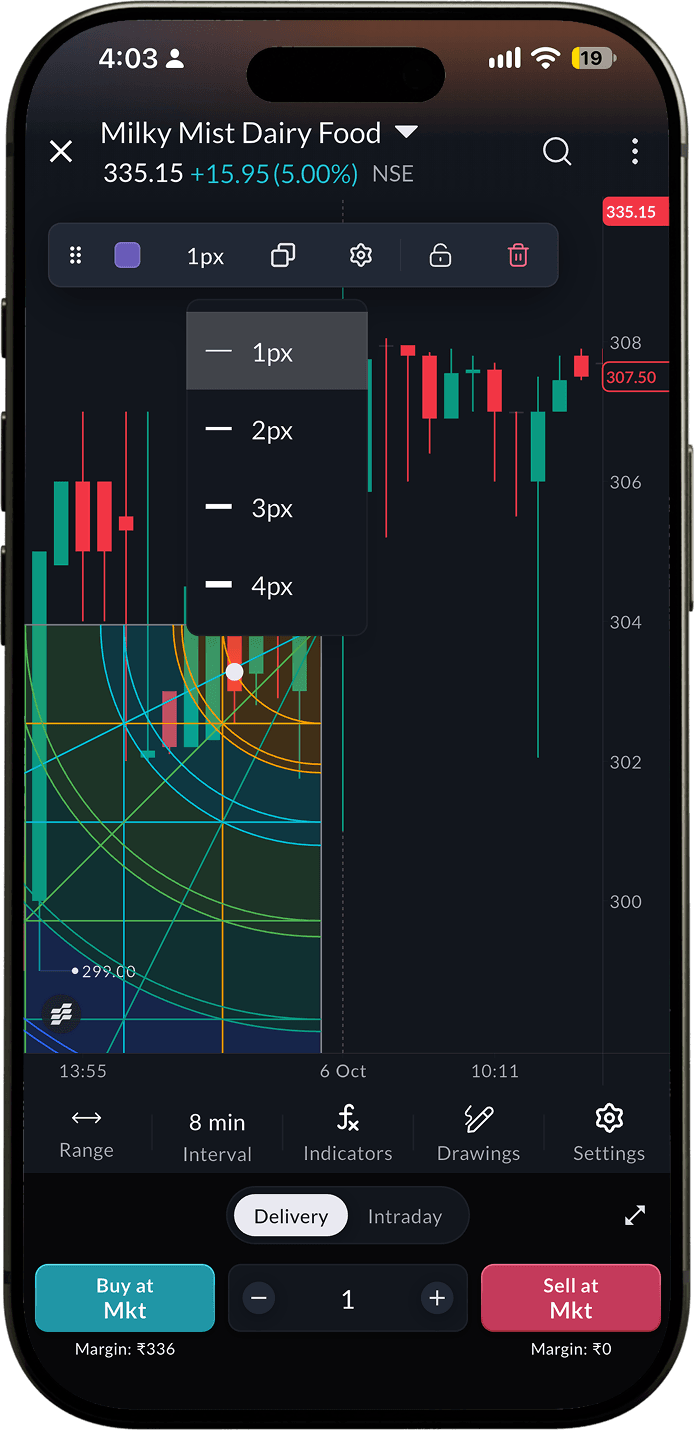
Gann Square Fixed works on the same principle as Gann Square but is anchored to a fixed price value rather than scaling with the chart, giving you a stable reference grid that does not shift as price moves.
All four are under Drawing Tools on any chart. Fully customisable, saved across sessions and devices.
RizeX Lite
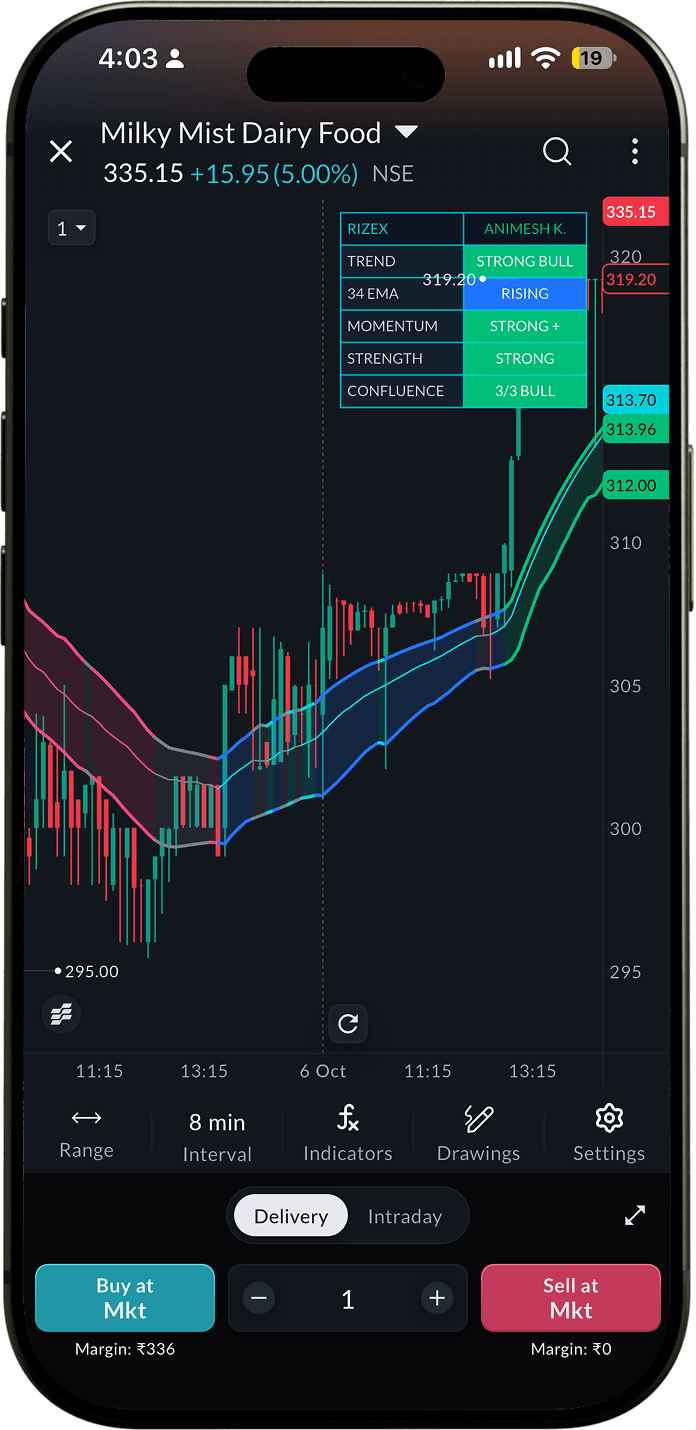
RizeX Lite is a new community indicator, now live on SAHI. Find it under Indicators on any chart and add it directly to your chart.
Related blogs

Recent blogs

Jio Platforms IPO: Everything Investors Need to Know Before Investing
/Posted 2 weeks ago
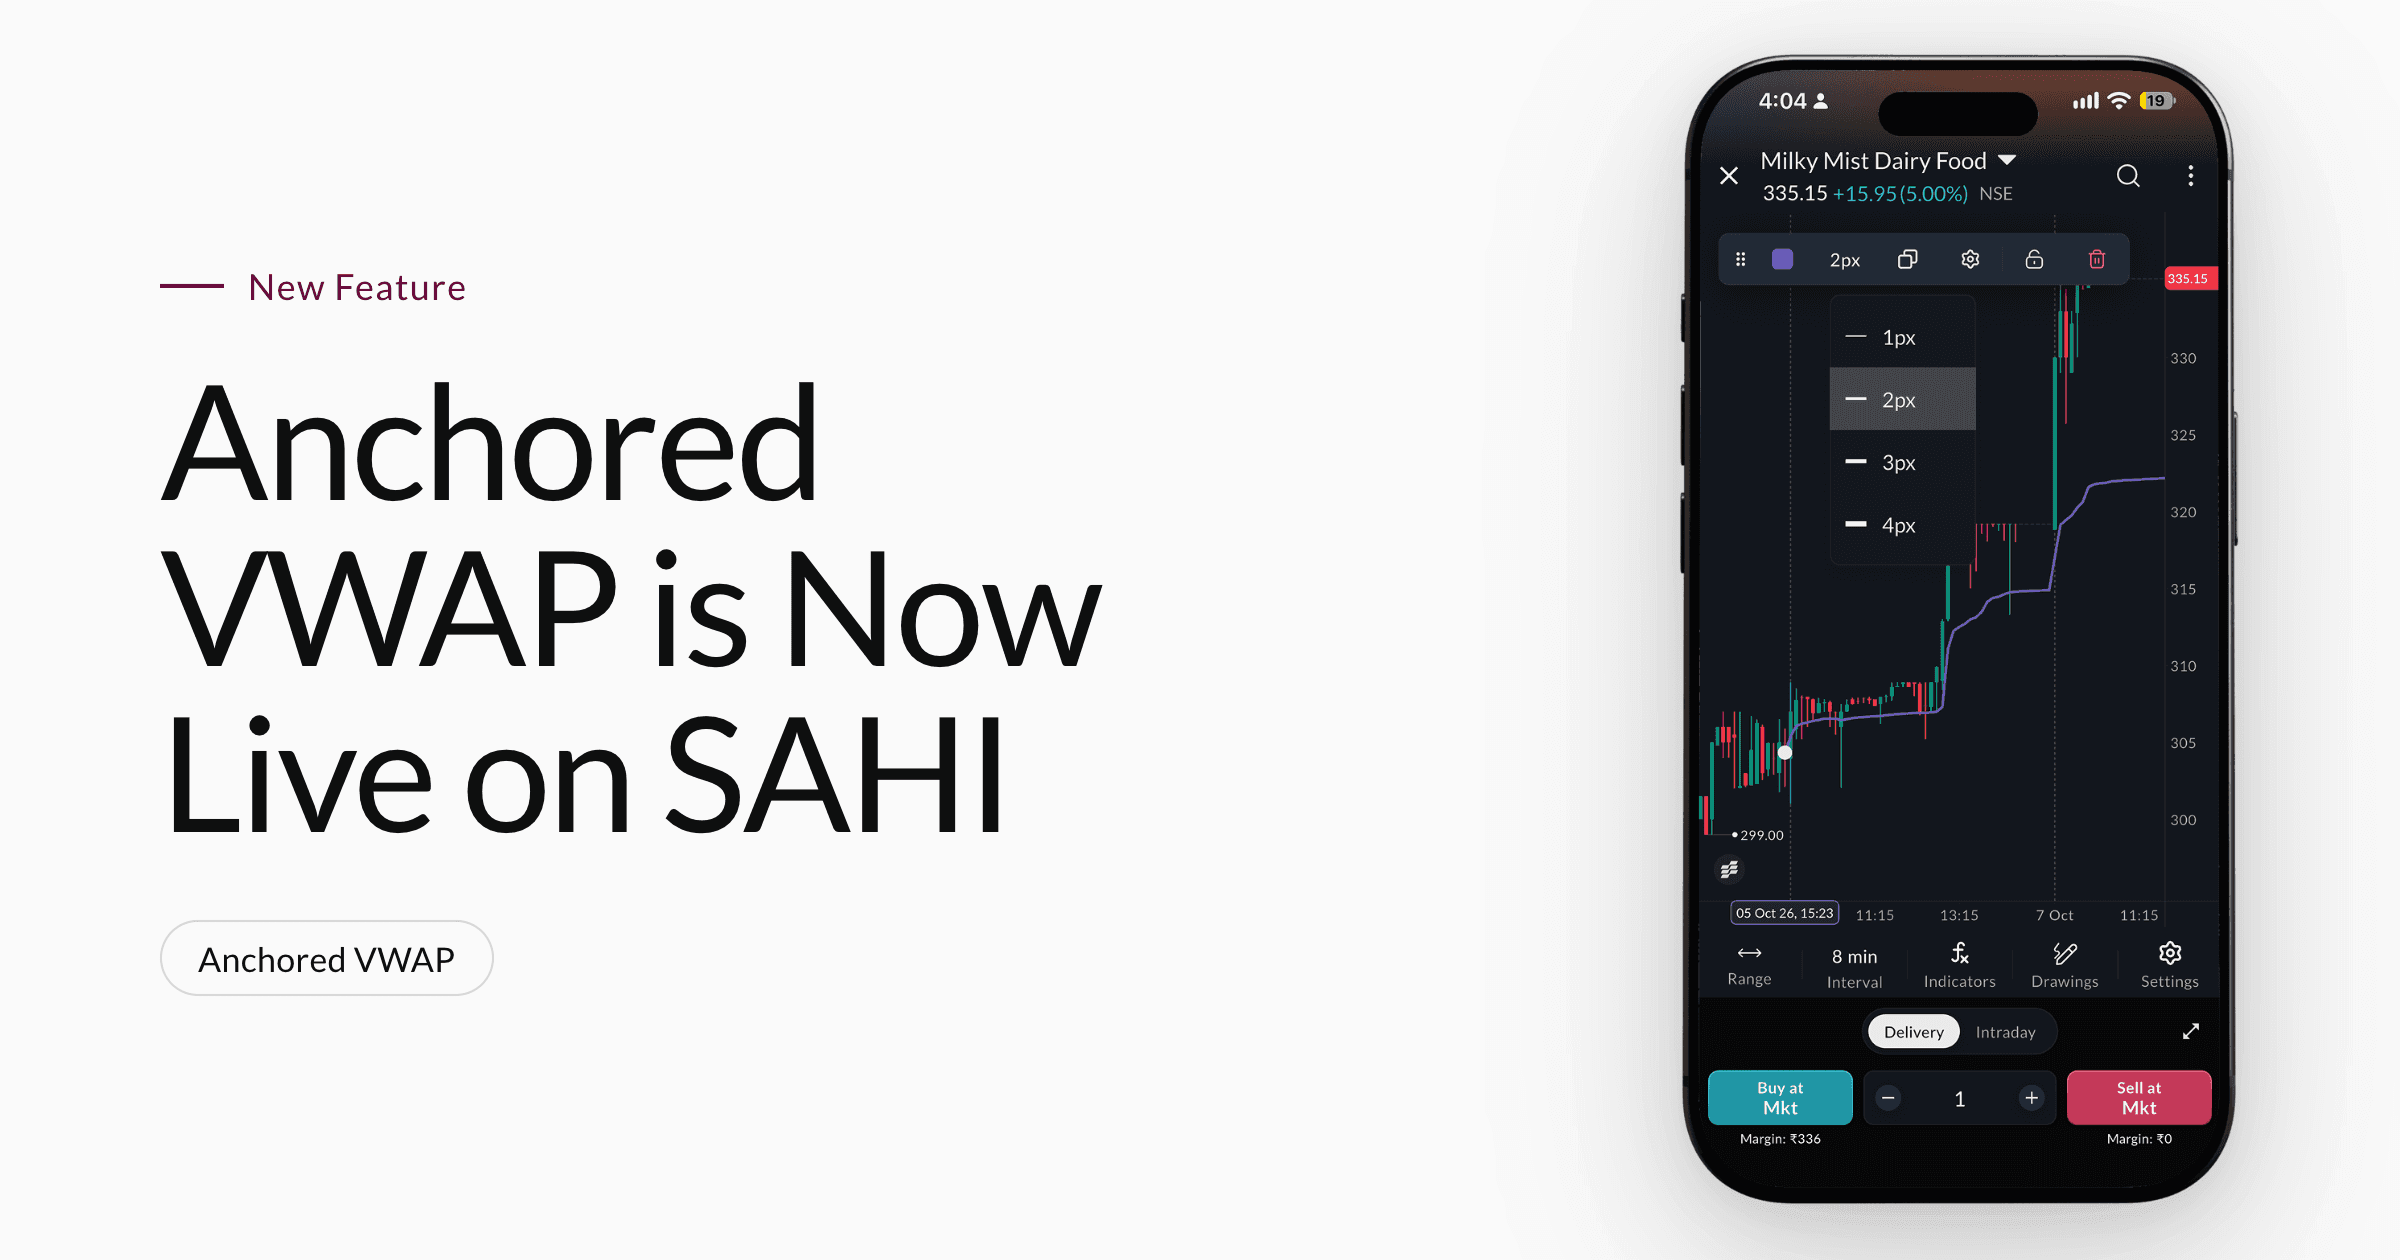
Anchored VWAP is Now Live on SAHI Charts
/Posted 1 month ago
Add Sahi as a Preferred Source on Google
Click the link, confirm the box next to sahi.com is checked — ignore any other results.