
Chart Patterns: Types, Examples and How to Trade Them
A complete guide to the 20+ chart patterns Indian traders actually use, with real examples, a cheat sheet and the rules that separate a real breakout from noise.
Chart patterns are shapes that price forms on a stock chart, such as a head and shoulders or a cup and handle, that hint at where price may move next. They fall into three groups: bullish (price likely to rise), bearish (price likely to fall) and bilateral (price can break either way). No pattern is a guarantee. A pattern becomes tradeable only after price confirms it with a breakout, ideally on strong volume.
Open any trading screen during market hours and you will see candles forming shapes. Some of those shapes repeat so often, across decades and across markets, that traders gave them names. These are chart patterns, and they sit at the center of technical analysis in the stock market.
This guide covers all the chart patterns that matter for Indian traders: what each one looks like, what it signals, and how to trade it. There is a cheat sheet table near the end if you want everything in one place.
What are chart patterns?
A chart pattern is a recognisable shape created by the price movement of a stock, index, or any traded asset. Patterns form because price keeps reacting to the same invisible lines: support and resistance. When price tests a level, fails, tests it again, and fails again, the chart draws a shape. Traders read that shape to judge whether buyers or sellers are winning.
Patterns are not magic. They work because they capture crowd behaviour. A double top forms because buyers ran out of conviction at the same price twice. A flag forms because traders who missed a sharp rally are buying every small dip. The shape is just the footprint of that psychology.
If you are new to reading charts, start with our primer on understanding stock charts and price movements and then come back here.
The three types of chart patterns
Every pattern in this guide belongs to one of three families:
- Reversal patterns signal that the current trend is ending. A stock in an uptrend forms a head and shoulders, breaks the neckline, and the trend turns down.
- Continuation patterns signal a pause, not an end. The stock rests, forms a flag or a triangle, then resumes the original trend.
- Bilateral patterns can break in either direction. A symmetrical triangle tells you a big move is coming but not which way. You trade the breakout, not the prediction.
Bullish chart patterns
These patterns suggest price is likely to move up, either because a downtrend is reversing or because an uptrend is about to resume.
1. Double bottom
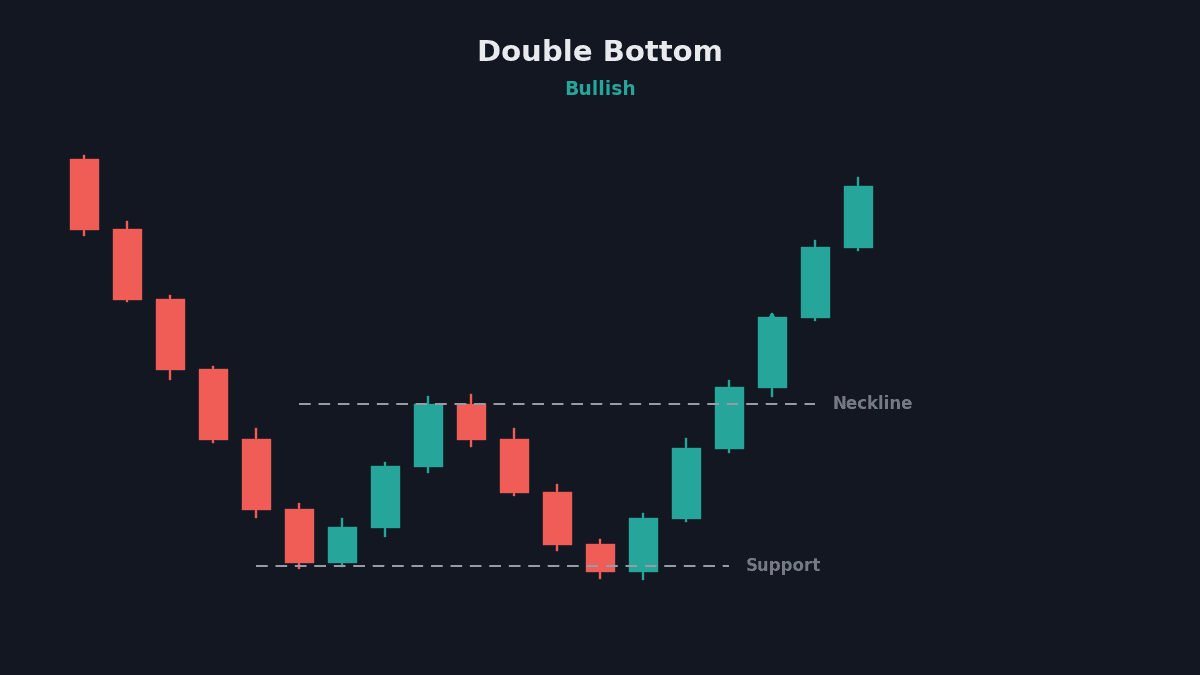
Price falls to a low, bounces, falls back to roughly the same low, and rises again. The chart looks like a W. The pattern confirms when price breaks above the bounce high between the two lows. The target is the height of the W added to the breakout point, with a stop below the second low. HDFC Bank has formed textbook double bottoms near long-term support zones several times.
2. Inverse head and shoulders
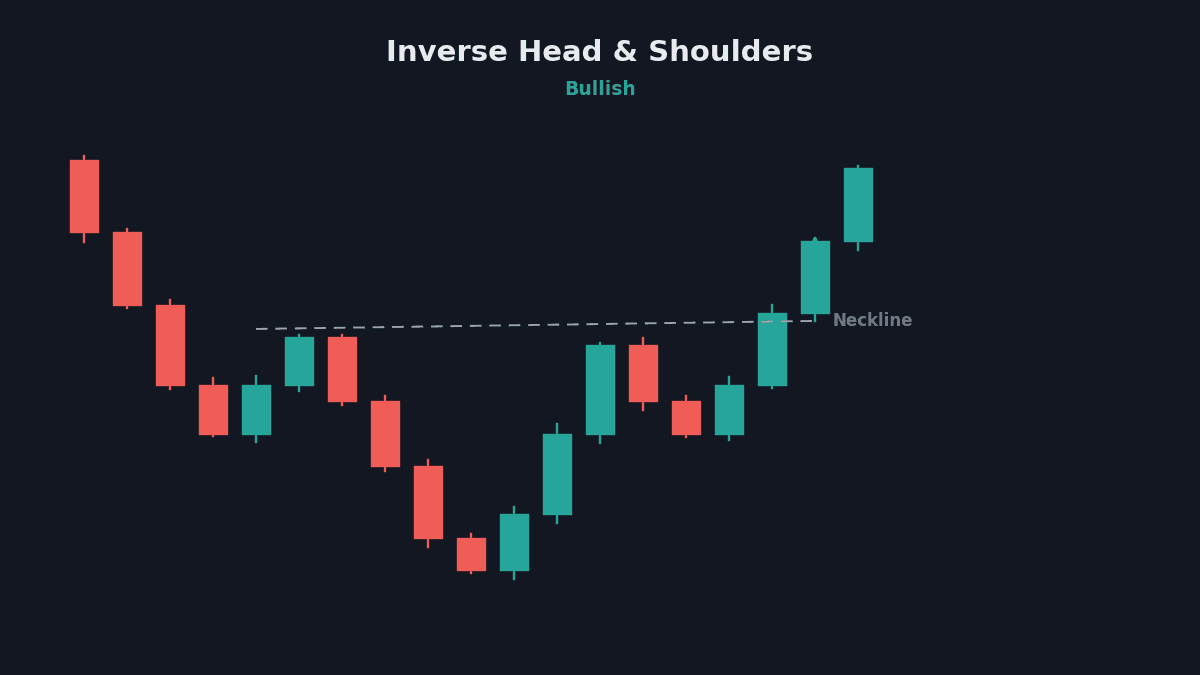
Three troughs, with the middle one (the head) deeper than the two on either side (the shoulders). It appears at the end of downtrends. The buy signal is a break above the neckline joining the two bounce highs. Reliance Industries formed a rough inverse head and shoulders at its 2021 bottom before the next leg up.
3. Cup and handle
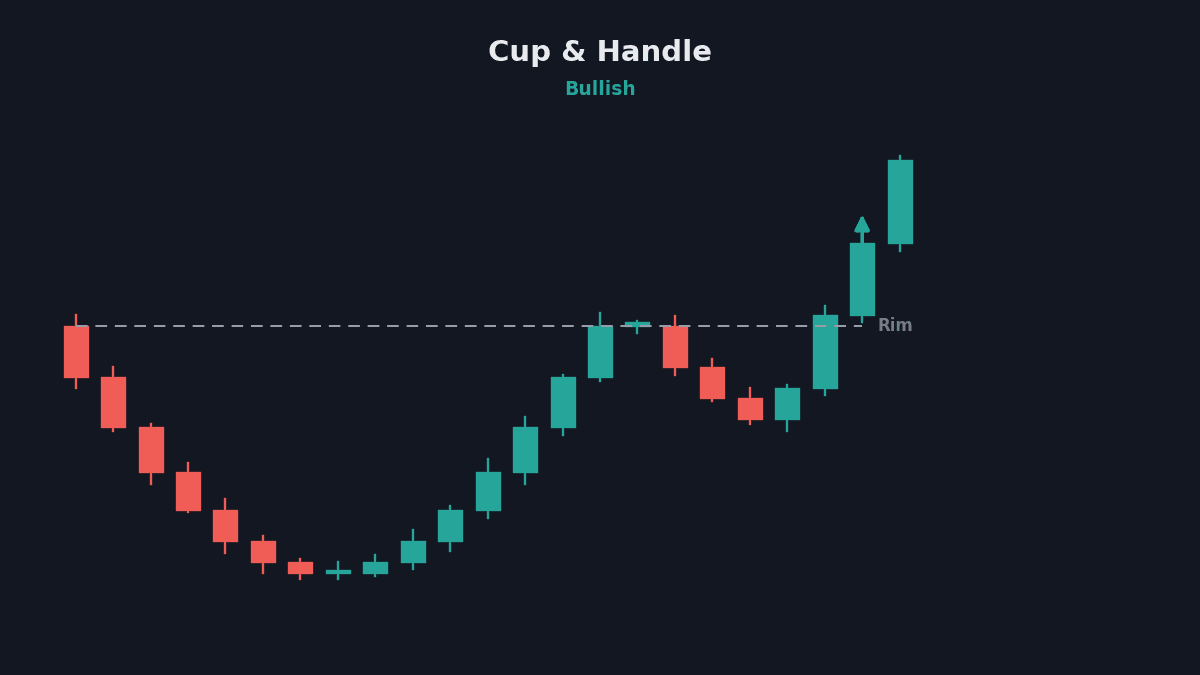
A slow, rounded U-shaped recovery (the cup) followed by a small pullback or sideways drift (the handle). It is a continuation pattern: the stock was in an uptrend, rested, and is getting ready to resume. Entry is the break above the handle; target is the depth of the cup added to the breakout. The Nifty 50 itself formed one between June and August 2020 before breaking out to new highs.
4. Bull flag
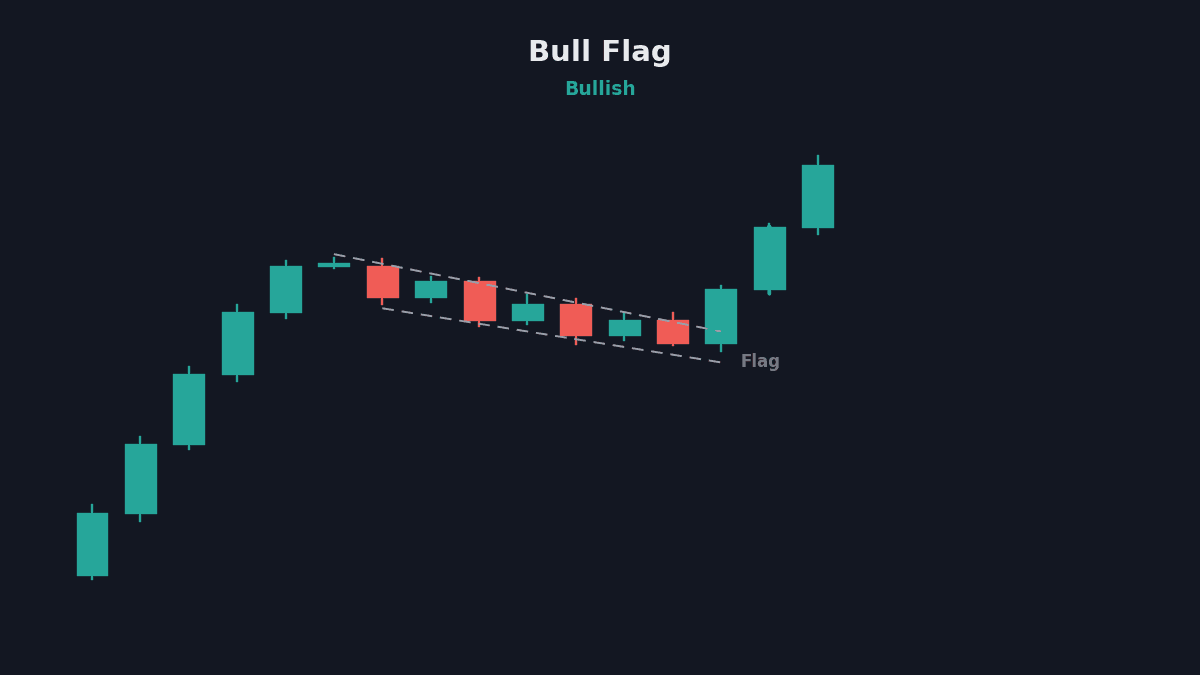
A sharp rally (the pole) followed by a narrow, slightly downward-sloping channel (the flag). The flag shows profit booking absorbed by fresh buyers. A break above the flag's upper line signals continuation, and the measured target is the length of the pole projected from the breakout.
5. Ascending triangle
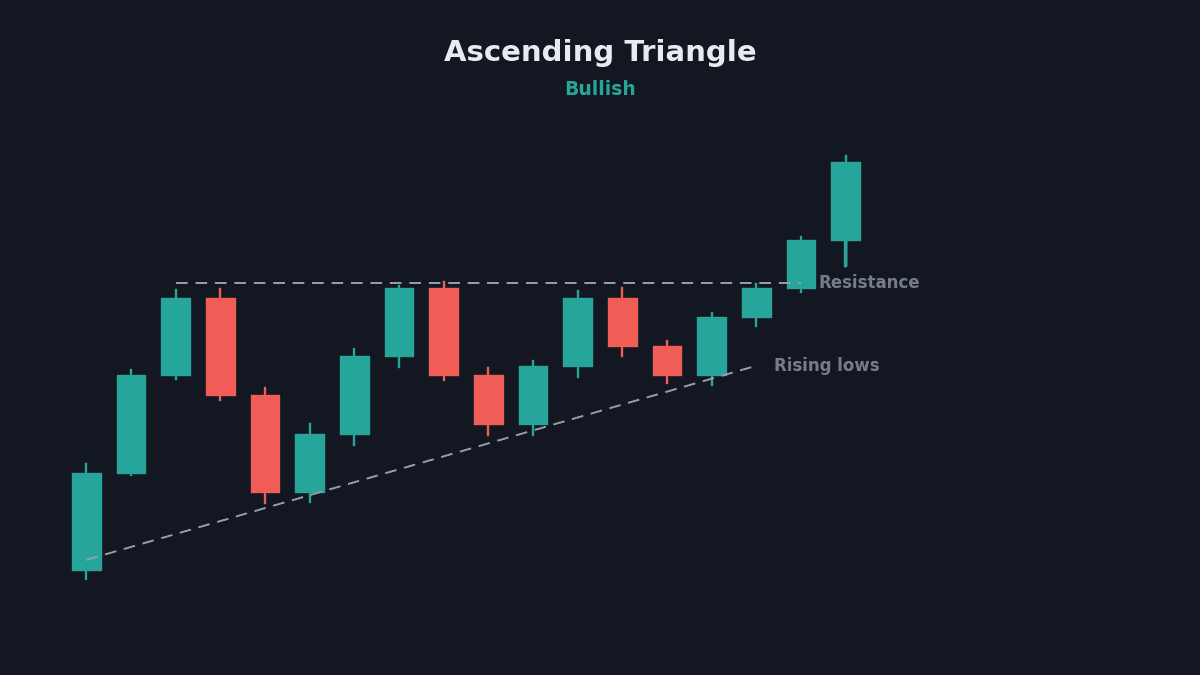
A flat resistance line on top and a rising trendline below. Buyers keep stepping in at higher levels while sellers defend one price. The pressure usually resolves upward. Enter on the breakout above resistance with volume; keep a stop below the most recent higher low.
6. Rounding bottom
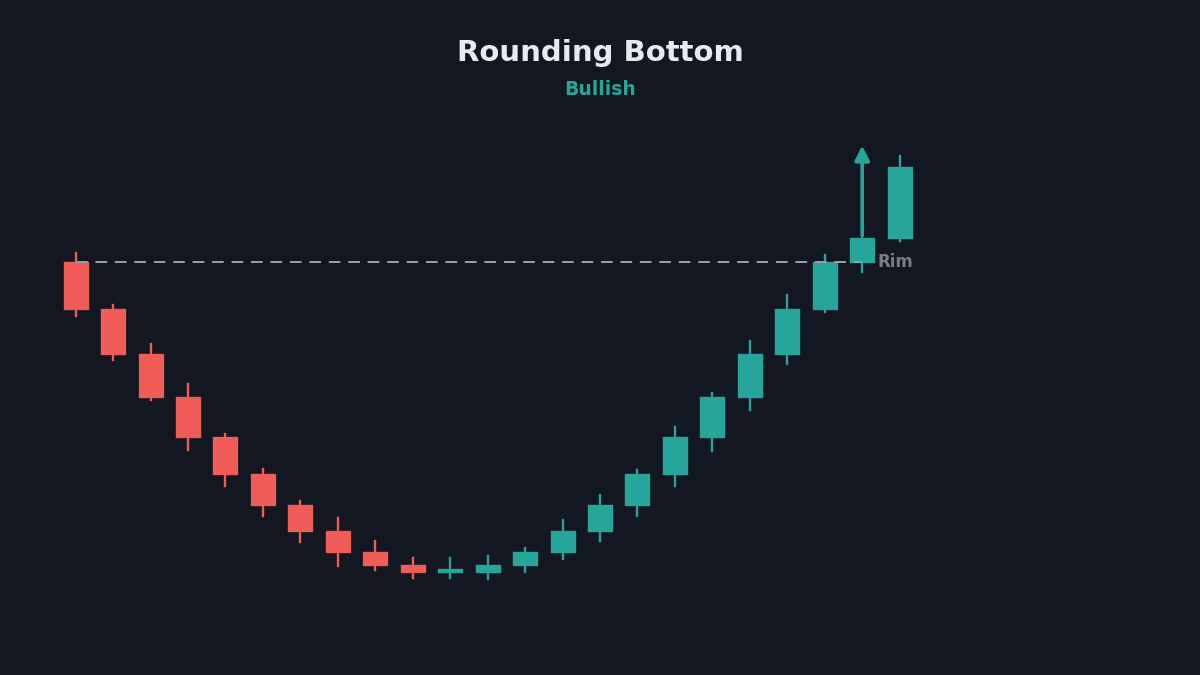
A long, saucer-shaped base that shows selling pressure fading gradually rather than in one event. These take weeks or months to form, which is why they are more useful for positional and swing traders than intraday traders. The signal is close above the rim of the saucer.
7. Triple bottom
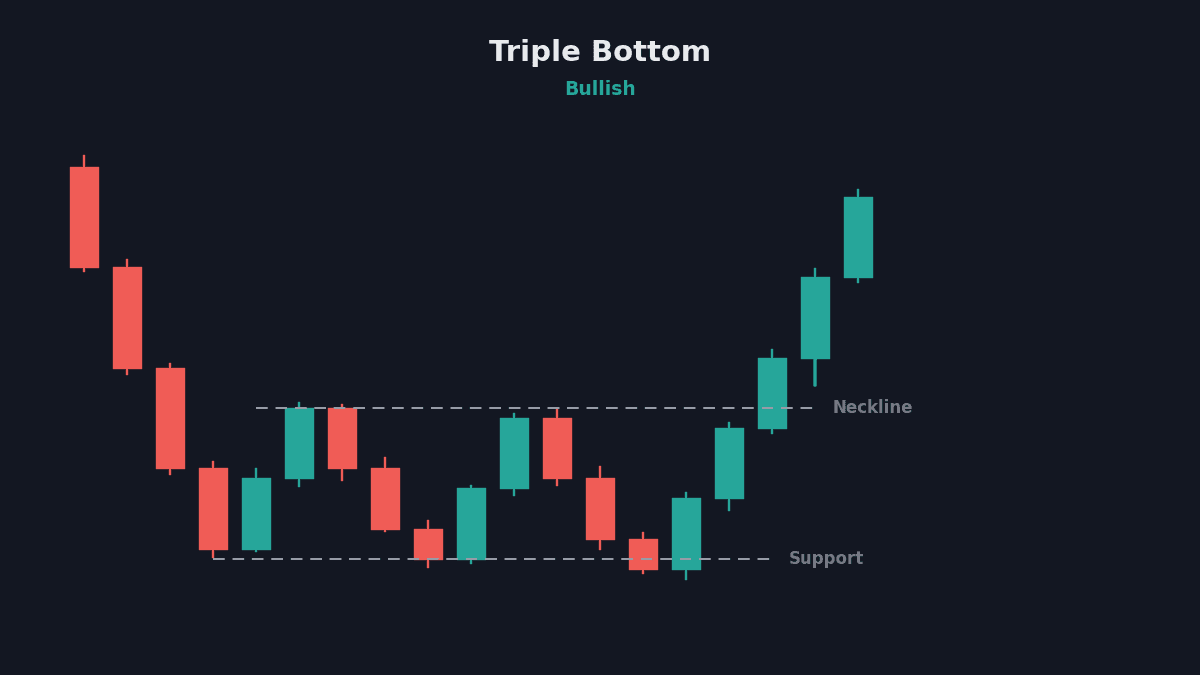
Like a double bottom with one extra test. Three failed attempts to break a support level tell you sellers have tried everything. Confirmation and targets work the same way as the double bottom, and the third test usually comes with visibly lower volume.
Bearish chart patterns
These warn that an uptrend is ending or a downtrend is about to resume.
8. Head and shoulders
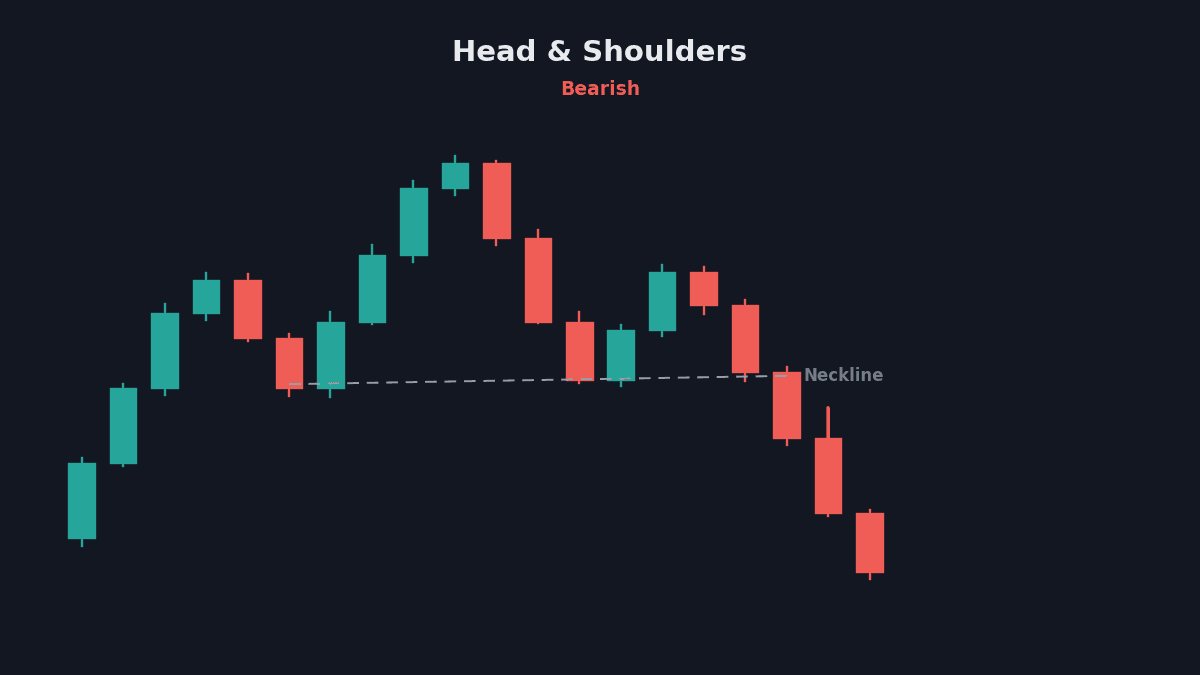
The most watched reversal pattern in technical analysis. Three peaks: a higher high (head) between two lower highs (shoulders). The sell signal triggers when the price breaks the neckline joining the two troughs. Volume typically fades on the right shoulder and expands on the breakdown. The target is the distance from the head to the neckline, projected below the neckline. We covered it with an Infosys example in our chart patterns and trading strategies module.
9. Double top
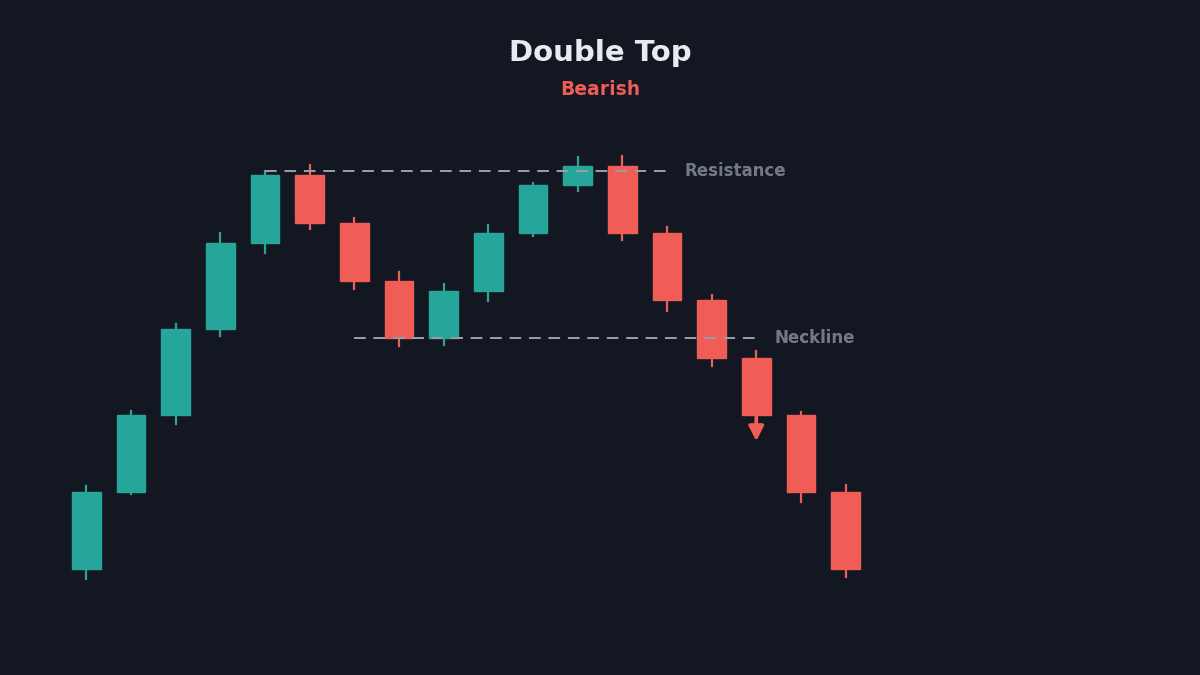
The bearish mirror of the double bottom. Price makes a high, pulls back, and retests the same high and fails. The M shape confirms when price breaks below the pullback low. Tata Motors has printed double tops at major resistance zones before meaningful corrections.
10. Bear flag
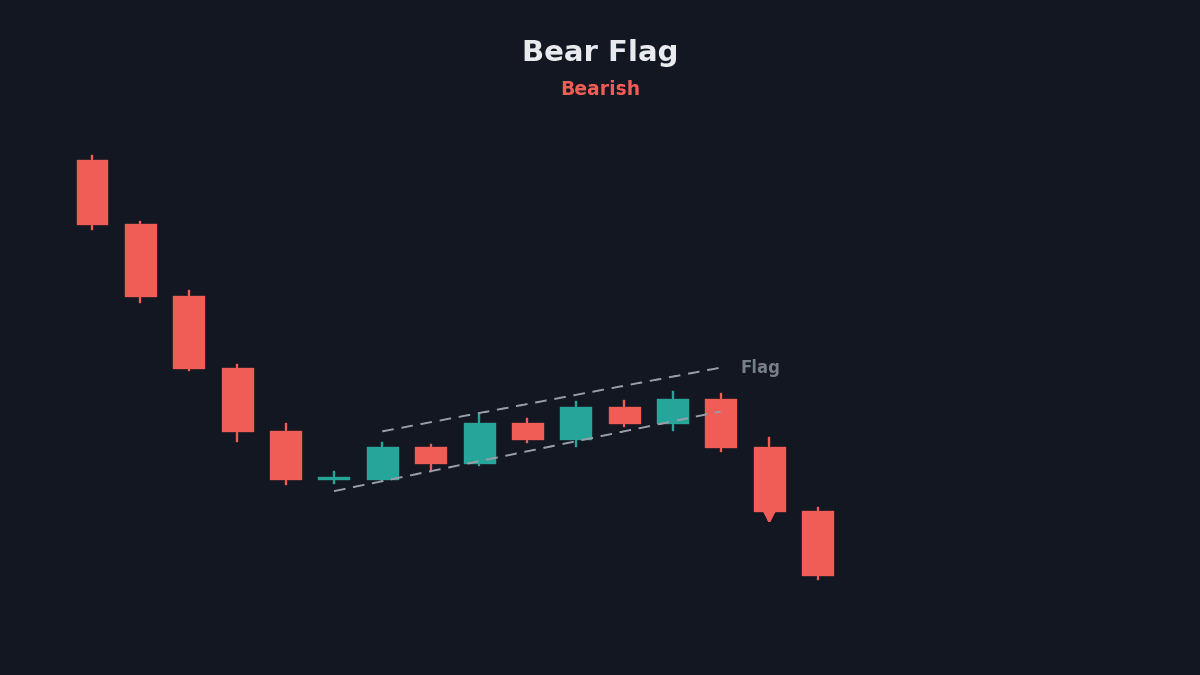
A steep fall followed by a weak, upward-drifting consolidation. The bounce lacks volume, which tells you it is short covering rather than real buying. A break below the flag continues the downtrend, with the pole length as the measured target.
11. Descending triangle
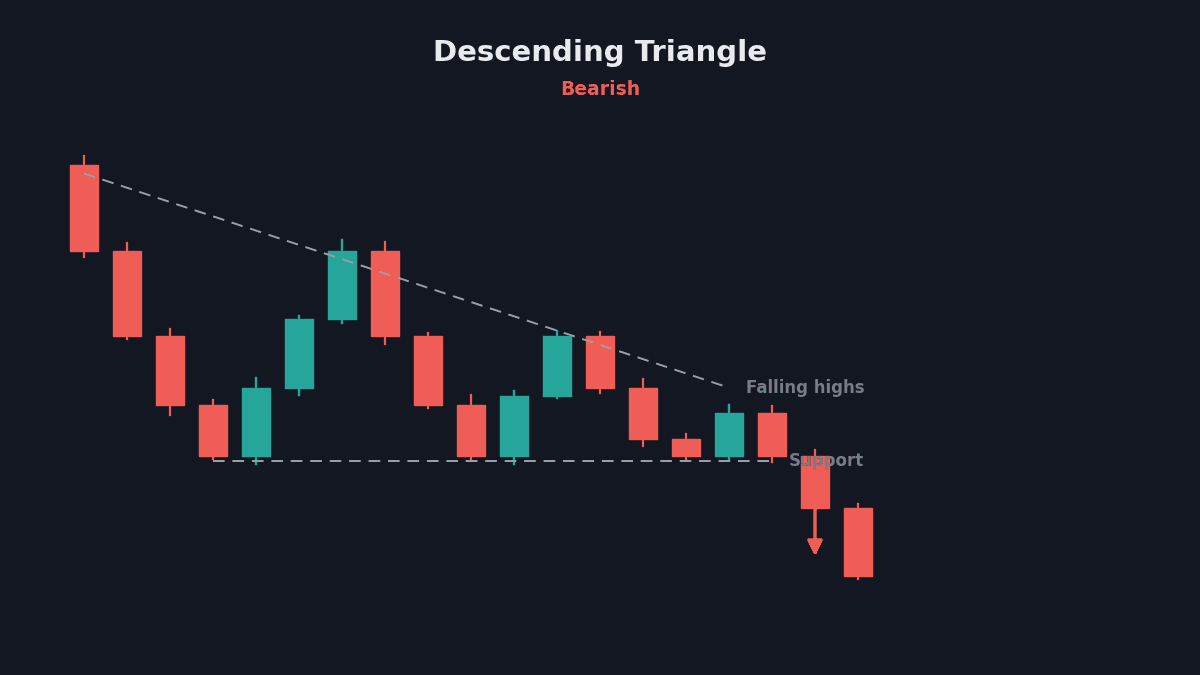
Flat support below, falling trendline above. Sellers keep accepting lower prices while buyers defend one level until it gives way. The breakdown below support was the trigger. These appear frequently on Nifty stocks during distribution phases.
12. Rising wedge
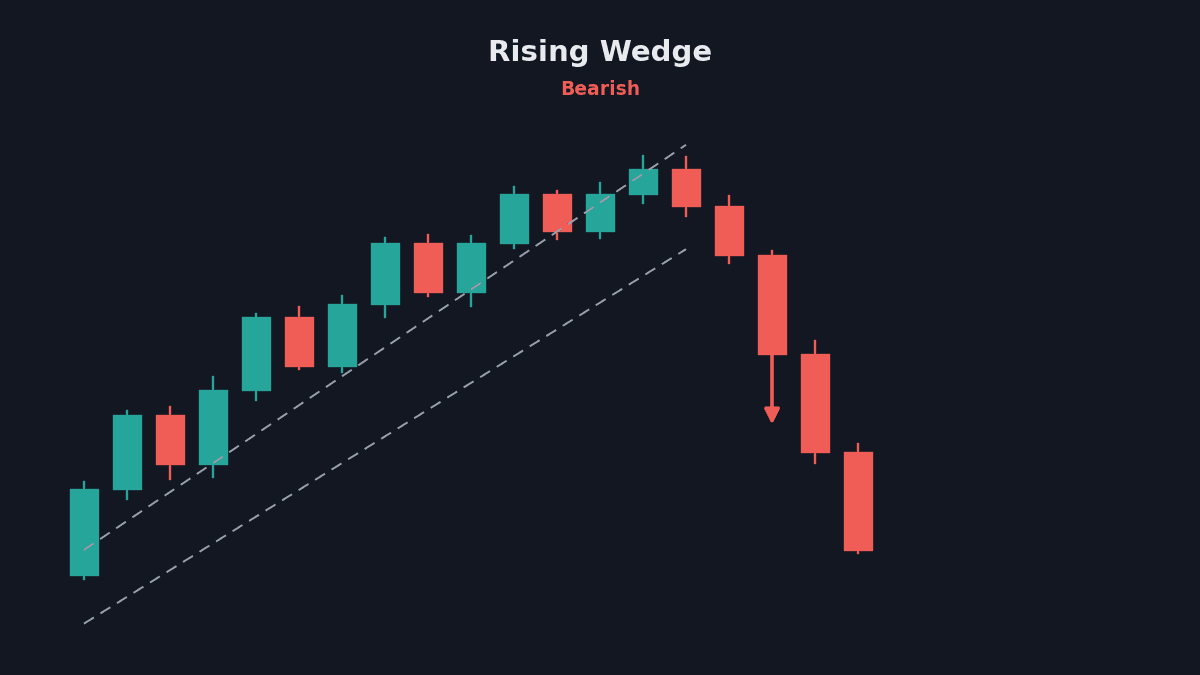
Price grinds higher inside two upward-sloping, converging lines, but each push gains less ground, and volume shrinks. The pattern usually breaks down. It can appear as a reversal at the top of an uptrend or as a weak bounce inside a downtrend.
13. Triple top
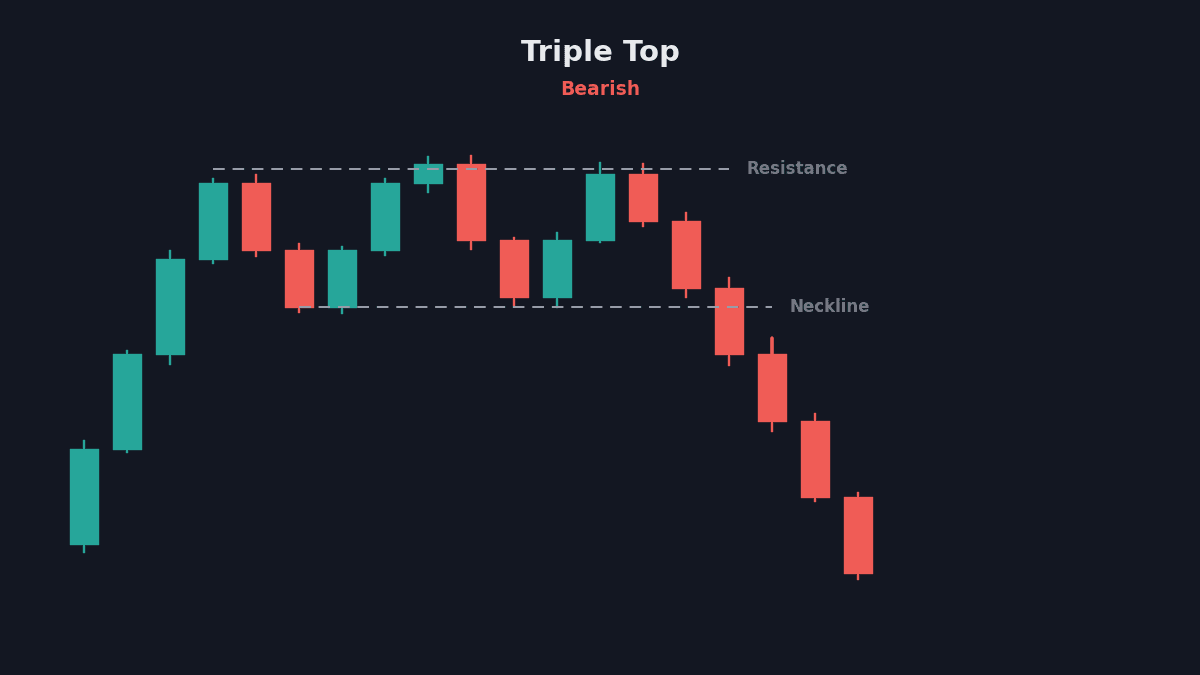
Three failed attempts at the same resistance. Each failure exhausts more buyers. The pattern confirms on a break below the lowest pullback point between the peaks. It takes longer to form than a double top and tends to produce stronger moves once it triggers.
Bilateral chart patterns
These tell you energy is building but not which way it will release. The rule is simple: wait for the break.
14. Symmetrical triangle
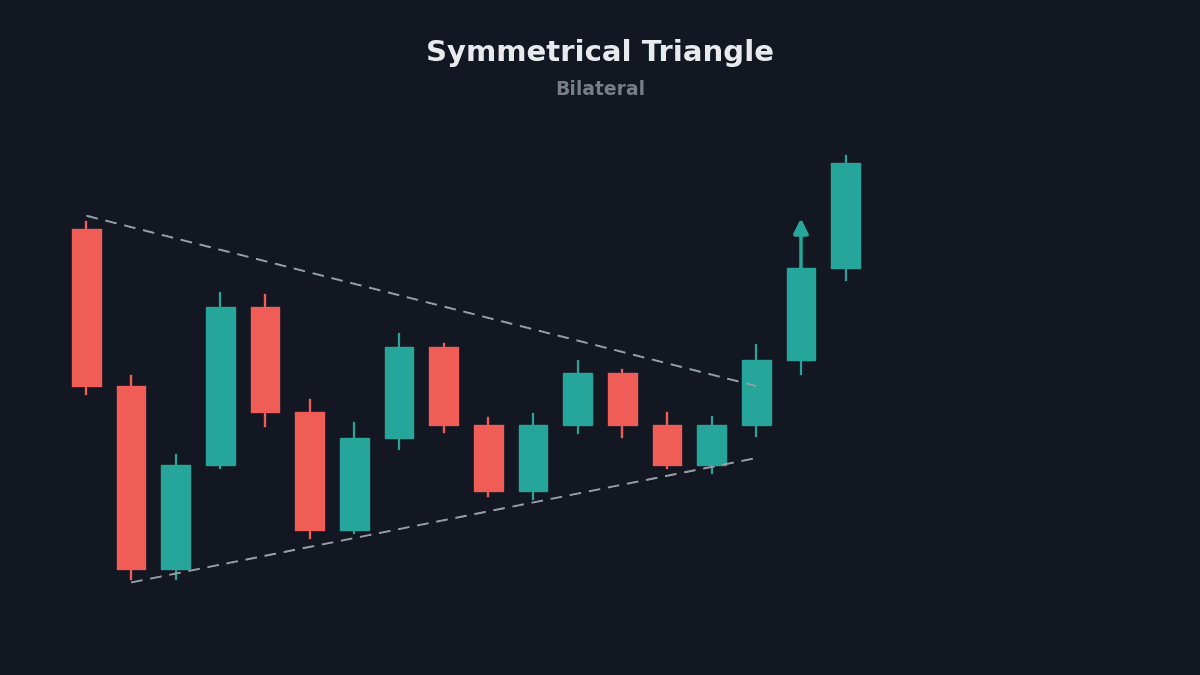
Lower highs and higher lows are squeezing toward a point. Both sides are losing patience. Roughly two-thirds of symmetrical triangles break in the direction of the prior trend, but the honest answer is you trade the breakout, not the guess.
15. Pennant
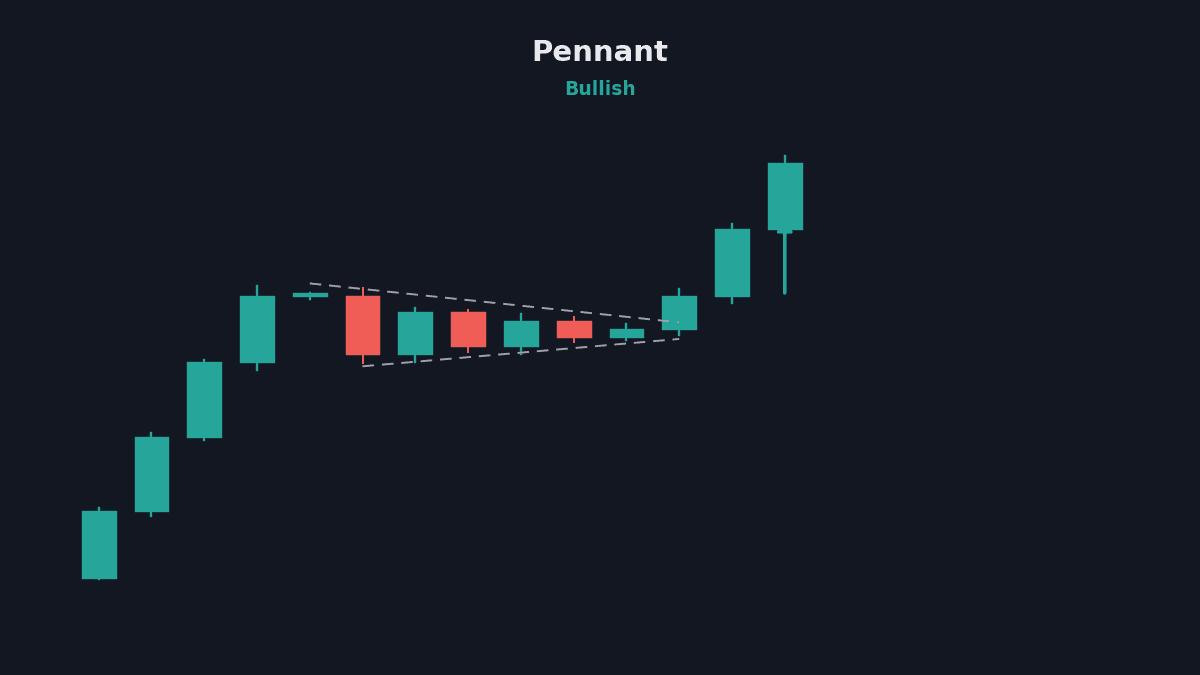
A small symmetrical triangle that forms after a sharp move, the way a flag does. The difference is shape: flags are parallel channels; pennants converge. Pennants resolve fast, usually within a few sessions, in the direction of the pole.
16. Rectangle
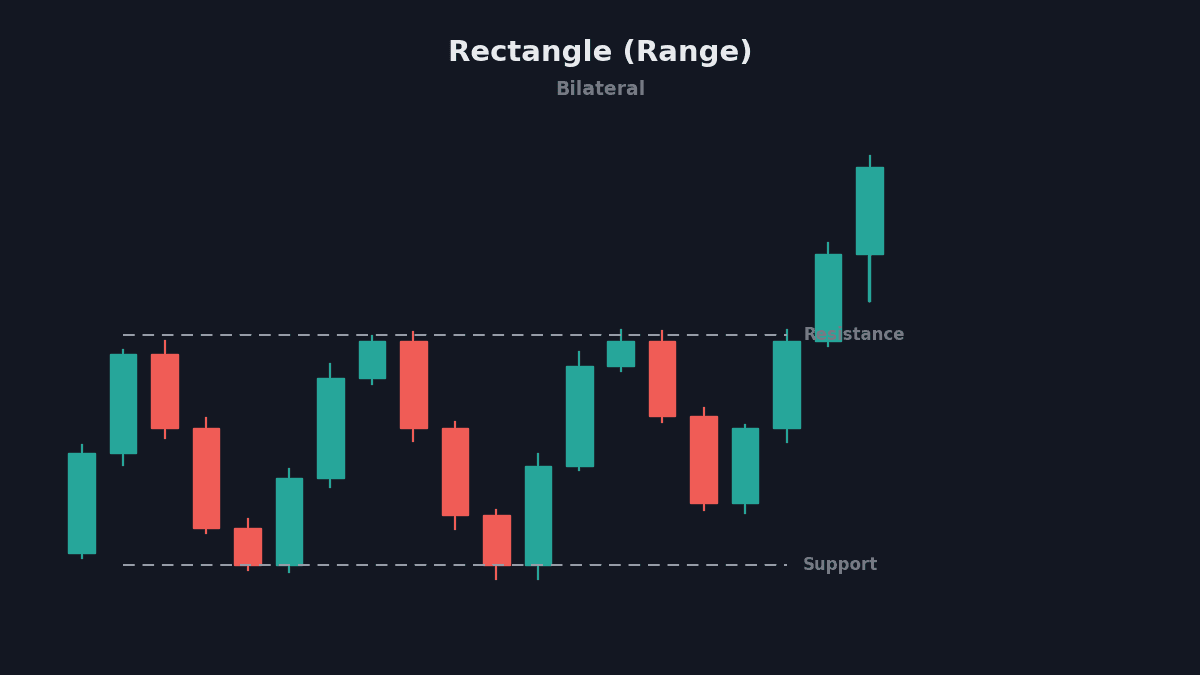
The price bounces between clear horizontal support and resistance. Range traders buy the bottom and sell the top while it lasts; breakout traders wait for one side to fail. The measured move equals the height of the range.
17. Falling wedge
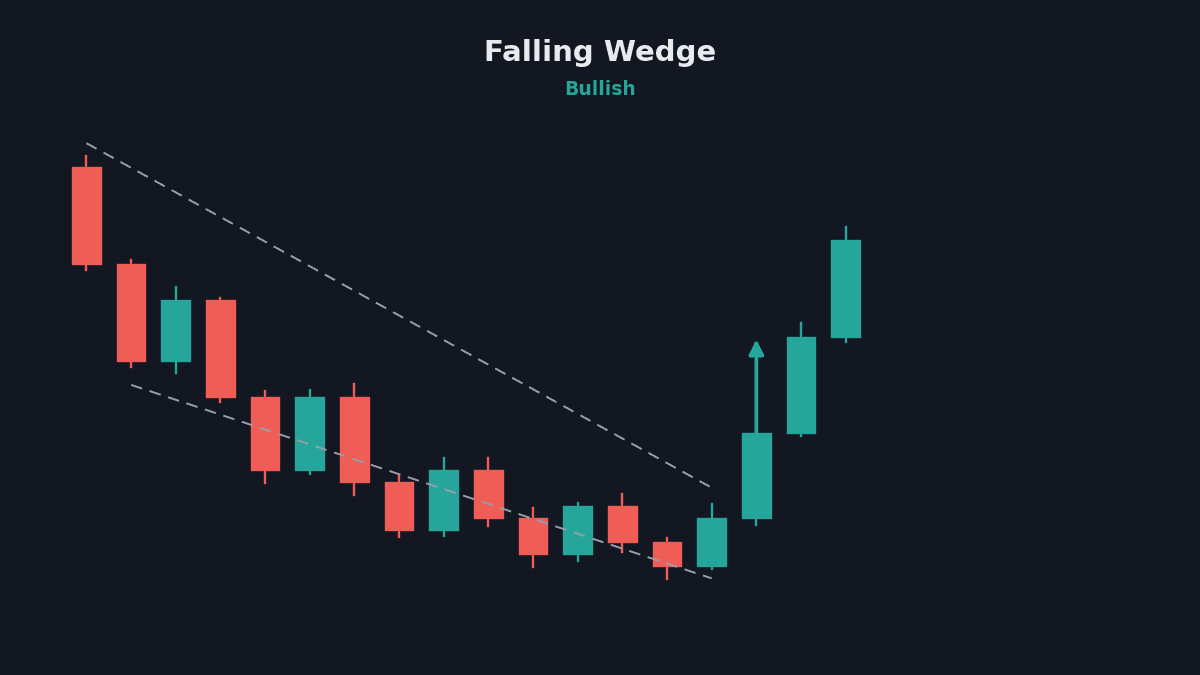
Two downward-sloping, converging lines. Despite drifting lower, sellers are losing momentum on each push, and the pattern usually breaks upward. After a downtrend it acts as a bullish reversal; inside an uptrend it acts as a continuation dip.
Chart patterns vs candlestick chart patterns
The patterns above form over days or weeks across many candles. Candlestick chart patterns are different: they form in one to three candles and signal short-term shifts in momentum. Both belong in your toolkit, and they work best together. A hammer candlestick printing at the second low of a double bottom is a stronger signal than either one alone.
The key single-candle and multi-candle names to know are the doji (indecision), hammer and hanging man (reversals), engulfing patterns, and the morning and evening star. We break these down in understanding candlestick patterns.
How to trade chart patterns
Spotting the shape is the easy half. Trading chart patterns profitably comes down to four rules.
Wait for confirmation
A pattern is only a pattern after it completes. A head and shoulders without a neckline break is just three bumps, and the right shoulder can morph into something else entirely. Enter on the breakout or breakdown, not in anticipation of it. Not sure whether a move is genuine? We wrote a full piece on telling a real breakout from noise.
Check the volume
Volume is the lie detector. A breakout on weak volume gets faded; a breakout on two or three times average volume has real participation behind it. In reversal patterns, you also want volume fading as the pattern forms and expanding on the trigger.
Define the stop before entry
Every pattern gives you a natural invalidation level: below the handle in a cup and handle, above the right shoulder in a head and shoulders, and below the second low in a double bottom. If the price comes back through that level, the pattern failed. Take the small loss. Pattern failure is not rare; it is part of the statistics.
Use measured targets, then trail
Most patterns project a target equal to their own height. Treat it as a first objective, not a ceiling. Booking partial profits at the measured move and trailing the rest keeps you in the trades that run.
Intraday traders apply these same rules on smaller timeframes. Two related reads: the opening range breakout and scalping breakouts versus reversals.
All chart patterns at a glance: cheat sheet
Bookmark this table or save the page as a PDF for quick reference during market hours.
| Pattern | Type | Signal | Trigger |
|---|---|---|---|
| Double bottom | Reversal | Bullish | Break above middle high |
| Inverse head & shoulders | Reversal | Bullish | Neckline break (up) |
| Cup & handle | Continuation | Bullish | Break above handle |
| Bull flag | Continuation | Bullish | Break above flag channel |
| Ascending triangle | Continuation | Bullish | Break above flat resistance |
| Rounding bottom | Reversal | Bullish | Close above the rim |
| Triple bottom | Reversal | Bullish | Break above pullback highs |
| Head & shoulders | Reversal | Bearish | Neckline break (down) |
| Double top | Reversal | Bearish | Break below middle low |
| Bear flag | Continuation | Bearish | Break below flag channel |
| Descending triangle | Continuation | Bearish | Break below flat support |
| Rising wedge | Reversal | Bearish | Break below lower line |
| Triple top | Reversal | Bearish | Break below pullback lows |
| Symmetrical triangle | Bilateral | Either | Breakout direction |
| Pennant | Continuation | Either | Break in pole direction |
| Rectangle | Bilateral | Either | Range break |
| Falling wedge | Reversal | Bullish | Break above upper line |