
Hammer Candlestick Pattern: How to Read It, Trust It, and Trade It on Nifty
One small candle with a long lower shadow can signal the end of a downtrend — here is exactly how to spot it, validate it, and trade it on Nifty.
There is a moment every trader knows well.
The market has been falling for days. Your stocks are bleeding. The news is grim. And then, quietly, almost sneakily, a single candle appears on the chart that looks like a tiny hammer with a long handle pointing downward.
It is not dramatic. It does not announce itself. But if you know what you are looking at, that little candle might just be the market whispering: "The selling is exhausted. Something is shifting."
That candle is called the Hammer. And learning to read it well, not just recognize it but genuinely understand it, can meaningfully change how you approach entries on Nifty charts.
Let us get into it.
What Exactly Is a Hammer?
A hammer is a single candlestick pattern. It belongs to a family called paper umbrellas, which are candles characterised by a small real body sitting near the top of the trading range, with a long lower shadow stretching below.
For a candle to qualify as a hammer, it needs to satisfy one key rule. The lower shadow must be at least twice the length of the real body. This is called the shadow to real body ratio, and it is non-negotiable. Ideally, the lower shadow is 3 or more times the real body. At 4x or 5x, that qualifies, very comfortably, as a hammer.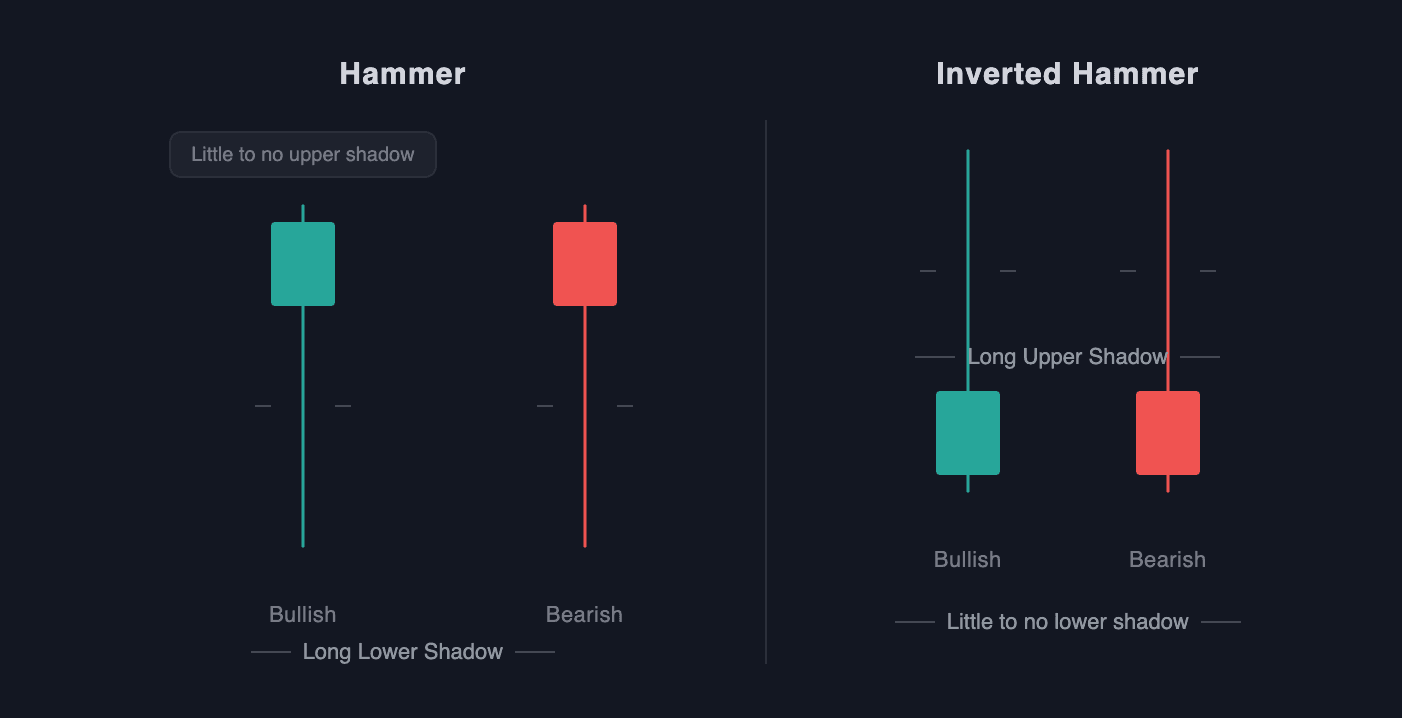
Two more things are worth noting.
Colour does not disqualify it. A hammer can be red or green. Either works. That said, a green hammer where the close is above the open is slightly more reassuring, because it tells you buyers not only showed up but also dominated by the end of the day.
A tiny upper shadow is fine. Textbook definitions say no upper shadow, but markets are messy. A small upper wick is acceptable and does not invalidate the pattern. The key is that long lower shadow.
Important: The Same Shape Can Mean the Opposite
Before going further, there is one thing every trader must know. The paper umbrella shape — that small body with a long lower shadow — means completely different things depending on where it appears on the chart.
When it appears after a downtrend, it is called a Hammer. It signals a potential bullish reversal.
When the exact same shape appears after an uptrend, it is called a Hanging Man. It signals a potential bearish reversal.
The shape is identical. The context is everything. This article is about the Hammer specifically, so everywhere you read about hammers below, the assumption is the candle appears after a decline.
The Story Behind the Candle
Patterns are only useful when you understand what price action is telling you. Here is the narrative behind every hammer.
The market is in a downtrend. Bears are in control. Each session, prices open lower and close lower, making fresh lows. Sentiment is negative.
Then comes the hammer day.
The market opens, and as expected, sells off sharply, pushing prices to a new low. The bears are doing what they have been doing for days. So far, nothing unusual.
But then something changes.
At or near that low, buyers step in aggressively and push prices all the way back up. By the time the session ends, the price has climbed back, closing near the top of the day's range. That long lower shadow is the visual record of that battle. Bears pushed hard. Bulls pushed back harder. The bears made a new low, but could not hold it.
The result is a candle that looks like a hammer with the handle pointing down. And the message it sends is clear: the bears tried to push prices lower, but failed to hold them there.
This does not guarantee a reversal. But it raises the probability of one. That is all technical analysis ever does — tilt the odds in your favour.
The One Condition That Matters Most: Prior Trend
This is where many beginners go wrong.
A hammer is only a hammer if it appears after a downtrend. The same candle shape appearing mid-rally or in a sideways range is just a candle. It has no special meaning.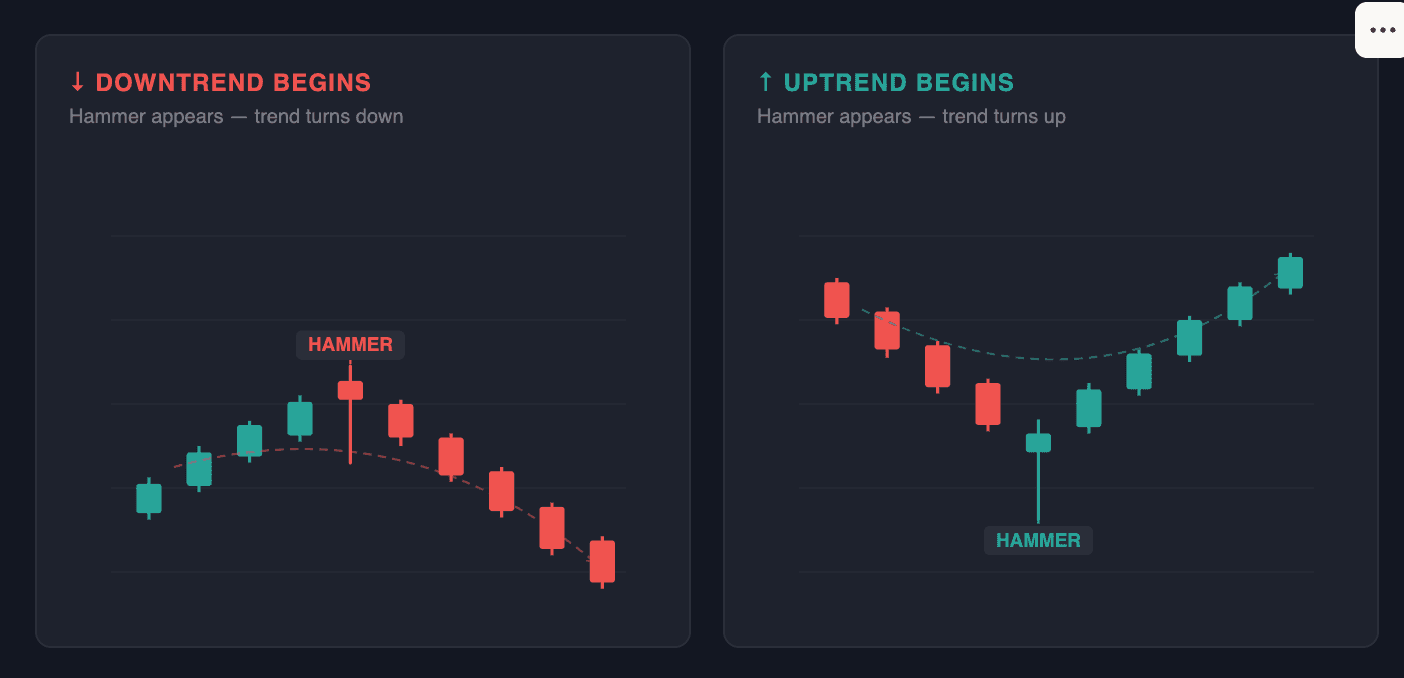
Why? Because the whole signal relies on context. The hammer's story — bears failing to hold a new low and bulls wresting back control — only makes sense if there was a decline happening in the first place. Without a prior downtrend, there is no sentiment shift to observe.
You do not need a months-long decline for the pattern to work. Even 3 to 5 consecutive down sessions is sufficient. The point is that sellers were in control before the hammer appeared.
So before you get excited about a long lower shadow on a Nifty chart, ask yourself one question. Has Nifty been falling before this candle appeared? If yes, proceed. If not, move on.
How to Trade It on Nifty: The Setup
Once you have spotted a valid hammer — the right shape in the right location after a downtrend — here is how to structure the trade.
Entry: Two approaches depending on your risk appetite
The risk taker approach is to enter on the same day the hammer forms, around the closing price. You are acting on the signal before it is confirmed. At 3:20 PM, check two things. First, the open and close are within 1 to 2 percent of each other. Second, the lower shadow is at least twice the real body. If both conditions are met, you take the trade at close.
The risk averse approach is to wait for the next trading session. If the following day opens and closes higher, forming a green candle, that is your confirmation. Enter at that close. Yes, you will pay a slightly higher price. But you now have evidence the reversal is real and not just a one-day blip.
On Nifty specifically, the risk averse approach tends to work better because index moves are driven by broad market sentiment, and a single day's price action can reverse overnight due to global cues. Waiting for confirmation filters out false signals.
Stop loss: The low of the hammer
This is the level where the trade is invalidated. If Nifty falls below the hammer's low after you have entered, the pattern has failed. The buyers who stepped in that day have been overwhelmed by sellers. Exit without hesitation.
Place your stop loss just below the hammer's low and not exactly at it, because markets can wick slightly beyond key levels before reversing. A small buffer of a few points on Nifty is reasonable.
Target: Use resistance levels, not hope
Set your profit target at the nearest meaningful resistance, whether that is a prior swing high, a key moving average, or a Fibonacci retracement level. Do not just hold and hope. Pre-define where you will exit and let the trade run to that point.
The minimum risk-to-reward ratio you should accept on any hammer trade is 1:2. This means if you are risking 50 points on Nifty, your target should be at least 100 points away. If the chart does not offer that much room before hitting resistance, skip the trade.
Making the Signal More Reliable
The hammer alone is a decent signal. Combined with other tools, it becomes a genuinely strong one.
Support levels. A hammer forming exactly at a known support zone — a level where Nifty has bounced before — is significantly more powerful than one forming in empty space. The confluence of pattern plus support means multiple traders are watching the same level and buying interest is more concentrated.
Volume. If the hammer day sees higher than average volume on Nifty Futures or in the broader market, that tells you institutional participation backed the reversal. High volume hammers are the ones to pay closest attention to.
RSI divergence. If Nifty is making lower lows in price but the RSI is making higher lows, that is called bullish divergence. It is a sign the downtrend is losing momentum. A hammer appearing during such divergence is a high-conviction setup.
Fibonacci levels. Nifty hammers forming near the 61.8 percent or 50 percent retracement of a prior rally are textbook entries for swing traders. The retracement level acts as a magnet for buyers, and the hammer confirms they have shown up.
Where It Gets Tricky: The Honest Part
No pattern is perfect. The hammer has failure modes, and you should know them.
Sometimes you will see a clean hammer — a perfect shape and a proper prior trend — followed by a red candle the next day. That is exactly why the risk-averse approach exists. It is your built-in filter. A hammer that is not confirmed by a subsequent bullish session has roughly the same predictive power as a coin flip.
There are also hammers that confirm, rally briefly, and then reverse. This happens frequently in choppy, low-conviction markets where there is no real trend. In such environments, candlestick patterns in isolation are far less reliable. Always check whether Nifty is in a clear trend before applying single candle signals.
The honest summary is this: a hammer is a probability-raising signal, not a certainty. Combined with the right context, confirmation, and risk management, it shifts the odds meaningfully in your favour. Traded blindly, it can lead to a string of small and avoidable losses.
A Practical Checklist Before You Trade the Hammer on Nifty
Before entering any hammer-based trade, run through this list:
- Has Nifty been in a clear downtrend (at least 3 to 5 down sessions) before this candle appeared?
- Is the lower shadow at least twice the length of the real body?
- Is the candle forming near a known support level, Fibonacci zone, or key moving average?
- For risk-averse traders: did the next day open and close higher?
- Is the stop loss below the hammer's low clearly defined?
- Is there at least a 1:2 risk-to-reward ratio available before the next resistance?
- Is volume elevated, or is RSI showing bullish divergence?
If you can check most of these, you have a well structured trade. If you can only check two or three, consider passing and waiting for a cleaner setup.
The Bigger Picture
The hammer is one of the most intuitive candlestick patterns precisely because it mirrors something real: a battle between buyers and sellers, with a visible outcome.
That long lower shadow is not a random artifact. It is the market's record of sellers who tried to push prices lower and buyers who refused to let them hold. Understanding that story — and not just the shape — is what separates a trader who uses candlesticks as a mechanical checklist from one who actually reads the market.
On Nifty, where institutional flows, global cues, and sentiment shifts can move the index sharply, single candle patterns work best as one input among many. Use the hammer to identify potential turning points. Use volume, support levels, and momentum indicators to validate. Use your stop loss to protect yourself when the market surprises you, because it will.
Trade the pattern. Respect the stop. Let the market do the rest.
Candlestick patterns are tools for reading price action, not crystal balls. Always trade with defined risk and never risk more than you can afford to lose.