
Support and Resistance in Trading: Understanding Key Levels, Breakouts, and Smarter Chart Analysis
Why treating support and resistance as zones instead of exact lines changes the way you read charts and how to confirm breakouts before entering trades
Almost every trader has faced this situation at least once.
You mark a resistance level on the chart, price finally breaks above it, you enter the trade thinking a breakout has happened… and within minutes, the stock reverses and hits your stop loss.
Then you sit there wondering:
"Wasn't that supposed to be a breakout?"
This is where most traders realise that support and resistance are far more complicated than just drawing straight lines on a chart.
The problem is not that traders do not know these concepts. In fact, support and resistance are probably the first things people learn after entering the stock market. The real issue is that most people understand them too superficially.
Markets do not move with perfect precision. Prices rarely reverse from one exact number. Institutional traders, liquidity, market psychology, volume, and momentum all influence how charts behave in real time.
That is why experienced traders usually treat support and resistance as zones instead of exact lines.
And once you understand this small shift, the way you read charts changes completely.
In this blog, we will break down how support and resistance actually work, why false breakouts happen, how traders use indicators like VWAP, RSI, EMA, and volume for confirmation, and how SAHI is making chart analysis easier and more structured for retail traders.
What Are Support and Resistance Levels?
Support and resistance are among the most widely used concepts in technical analysis.
A support level refers to a price area where buying interest tends to emerge. It is often called a demand zone because traders and investors believe the stock offers value at that level, leading to increased buying activity.
Resistance, on the other hand, is a price area where selling pressure increases. It is commonly referred to as a supply zone because traders either book profits or initiate fresh selling positions around those levels.
Whenever price repeatedly reacts around a certain area, traders start identifying it as a key market level.
For example:
- If a stock repeatedly bounces near ₹1,000, traders may identify that area as support.
- If a stock repeatedly struggles to move above ₹1,200, traders may treat that area as resistance.
However, one major mistake traders make is assuming these are exact price lines.
Markets are driven by buyers, sellers, liquidity, volatility, and institutional participation. Because of this, support and resistance are better understood as zones rather than precise numbers.
That small shift in understanding changes the entire way traders interpret charts.
Support and Resistance Are Zones, Not Exact Lines
This is one of the biggest misconceptions in trading.
Many traders mark a single line and assume that if price moves slightly above or below it, the level has been broken. That often leads to false breakout entries and unnecessary stop losses.
In reality, price can temporarily move above resistance or below support before reversing.
This happens because:
- Markets are volatile.
- Institutional traders often hunt liquidity around obvious levels.
- Stop losses are commonly placed around these areas.
- Short-term traders react emotionally to quick moves.
That is why experienced traders focus on zones instead of exact levels.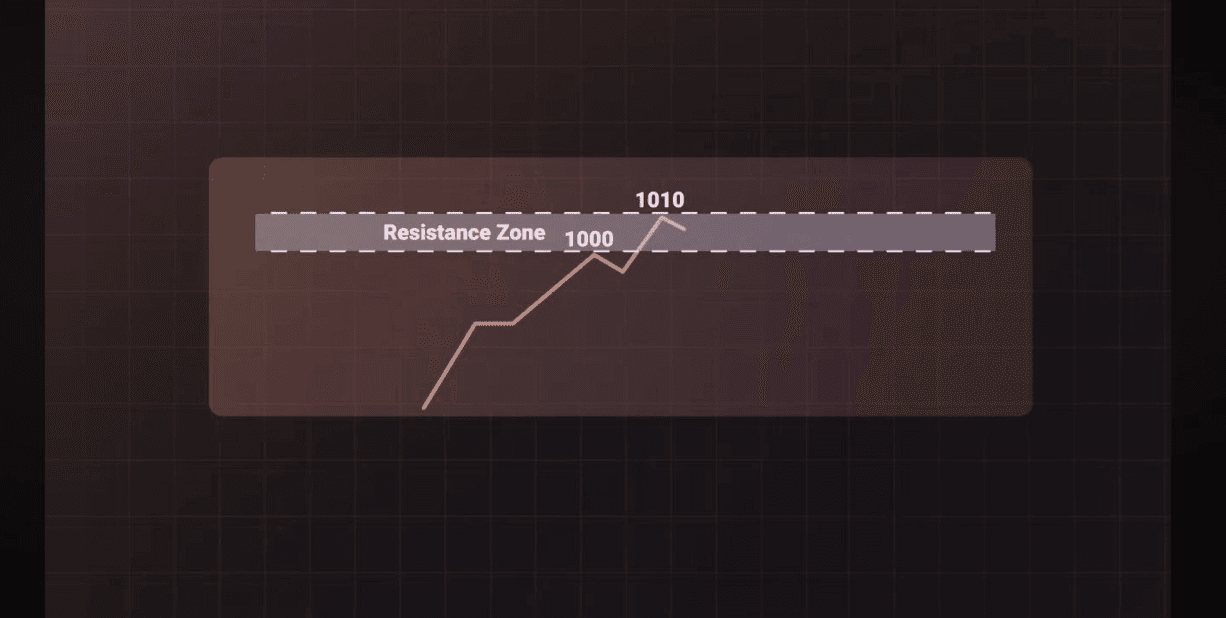
For example, imagine a stock repeatedly struggling to move above the ₹1,000 area. Even if the price briefly touches ₹1,010 before reversing, it does not necessarily mean the resistance has been completely broken.
That entire ₹1000–₹1,010 range can behave like a resistance zone rather than one exact line on the chart.
This is exactly why experienced traders focus more on zones than precise numbers. It helps them avoid reacting too quickly to small price movements and reduces the chances of getting trapped in false breakouts or liquidity traps.
Pro tip: Round numbers like ₹500, ₹1,000, ₹2,500 tend to act as especially strong psychological support and resistance zones. Retail and institutional traders alike cluster orders near these levels, which is why price often stalls, reverses, or accelerates around them.
Why Price Reacts Around Key Levels
Support and resistance work because markets are driven by psychology.
At support zones, buyers often wait for prices to fall so they can enter at what they believe is a better valuation. As demand increases, price tends to bounce.
At resistance zones, two things generally happen:
- Traders who bought earlier start booking profits.
- Bearish traders initiate short positions.
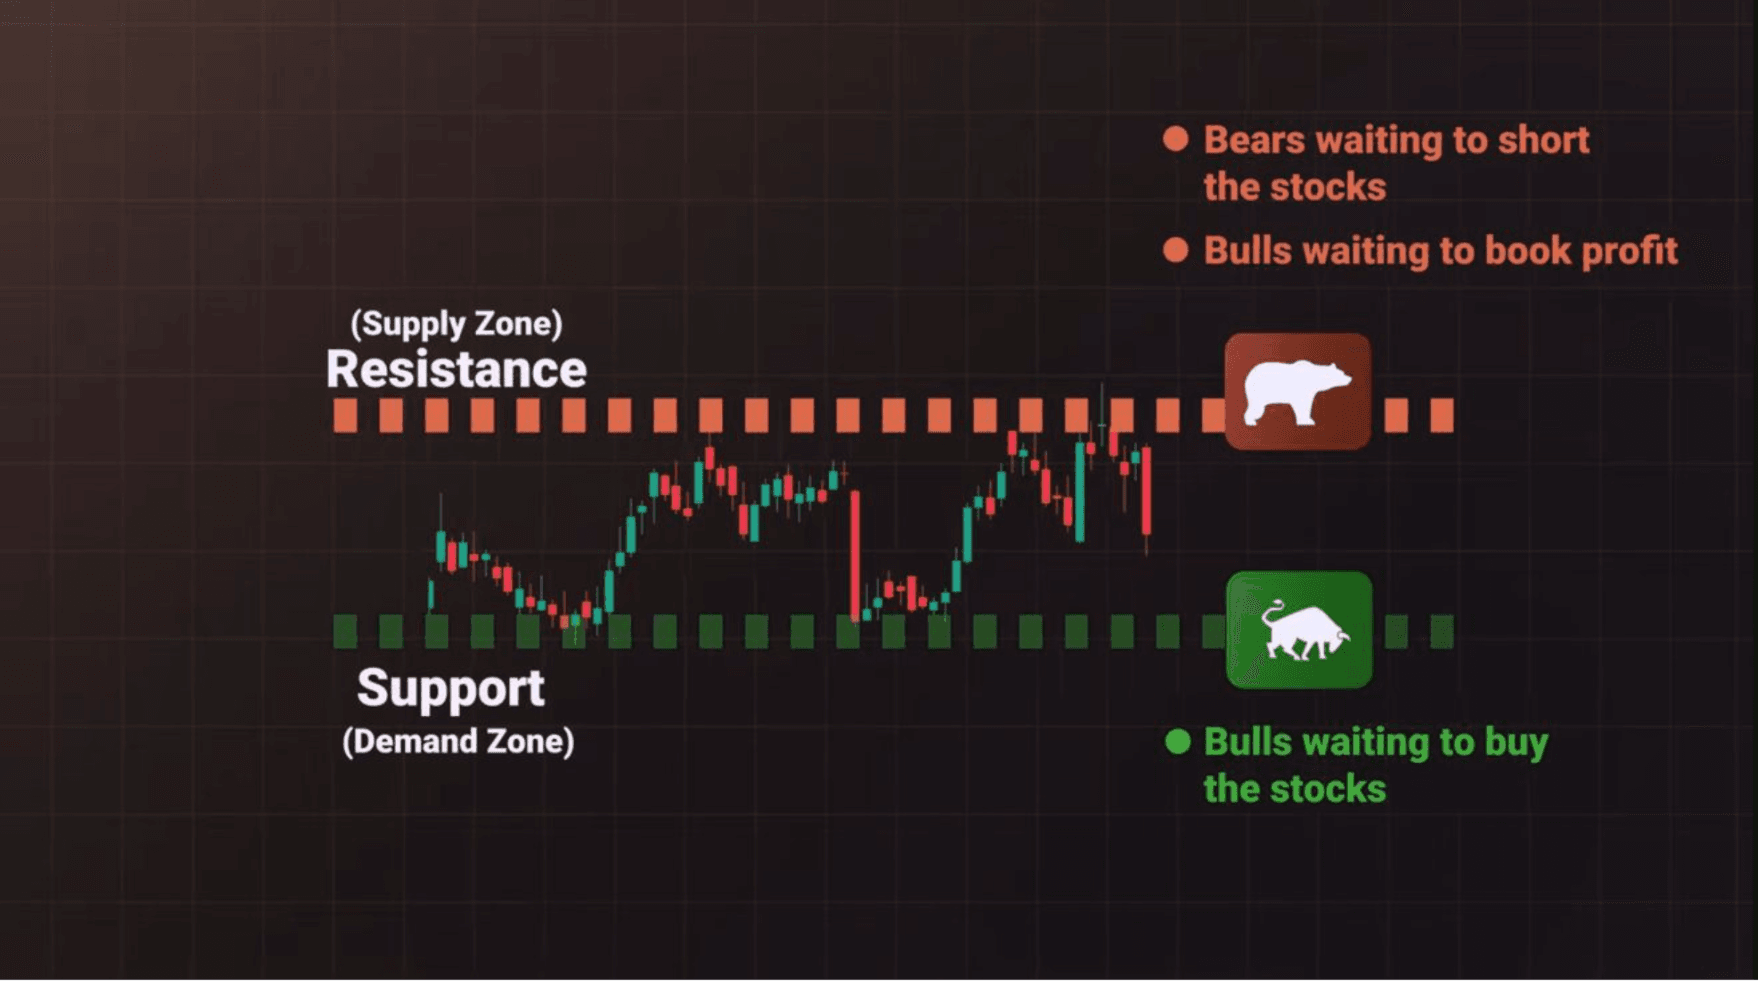
This increase in supply creates selling pressure, causing price to struggle near those levels. Over time, repeated reactions around the same area create what traders call key levels.
These levels become even more important when they align with:
- High trading volumes
- Historical reversal areas
- Moving averages
- Trendlines
- Previous breakout zones
The more confirmations a level has, the stronger traders generally consider it.
Timeframe hierarchy matters: A weekly or monthly support/resistance level carries significantly more weight than an intraday level. Professional traders always check higher timeframe S/R before acting on shorter timeframe signals. A resistance zone that appears on a weekly chart will typically override a breakout signal on a 15-minute chart.
What Happens When a Resistance Breaks?
One interesting market behaviour is that resistance often turns into support after a breakout.
This happens because once the market accepts a higher price range, traders who earlier missed the breakout often wait for a pullback to enter.
As fresh buyers step in near the old resistance area, the previous resistance starts behaving like support.
Similarly, when support breaks, it can later act as resistance.
This concept is widely used in breakout trading strategies. In fact, many professional traders specifically wait for the retest of a broken level before entering. Entering on the retest — rather than chasing the initial breakout — typically offers a lower-risk entry with a tighter stop loss.
But breakout trading comes with one major challenge.
Not every breakout is real.
Understanding False Breakouts and Liquidity Traps
Many traders enter trades immediately after seeing one candle close above resistance.
That is where false breakouts become dangerous.
A false breakout happens when price temporarily crosses a key level but fails to sustain the move. Price then reverses sharply, trapping traders who entered too early.
These are often called liquidity traps because markets move toward areas where large clusters of stop losses and pending orders exist.
To avoid this, experienced traders usually wait for confirmation.
Some common breakout confirmation techniques include:
1. Waiting for the Next Candle
Instead of entering immediately after one breakout candle, traders often wait for the next candle to confirm continuation.
If price continues moving in the breakout direction, confidence in the setup increases.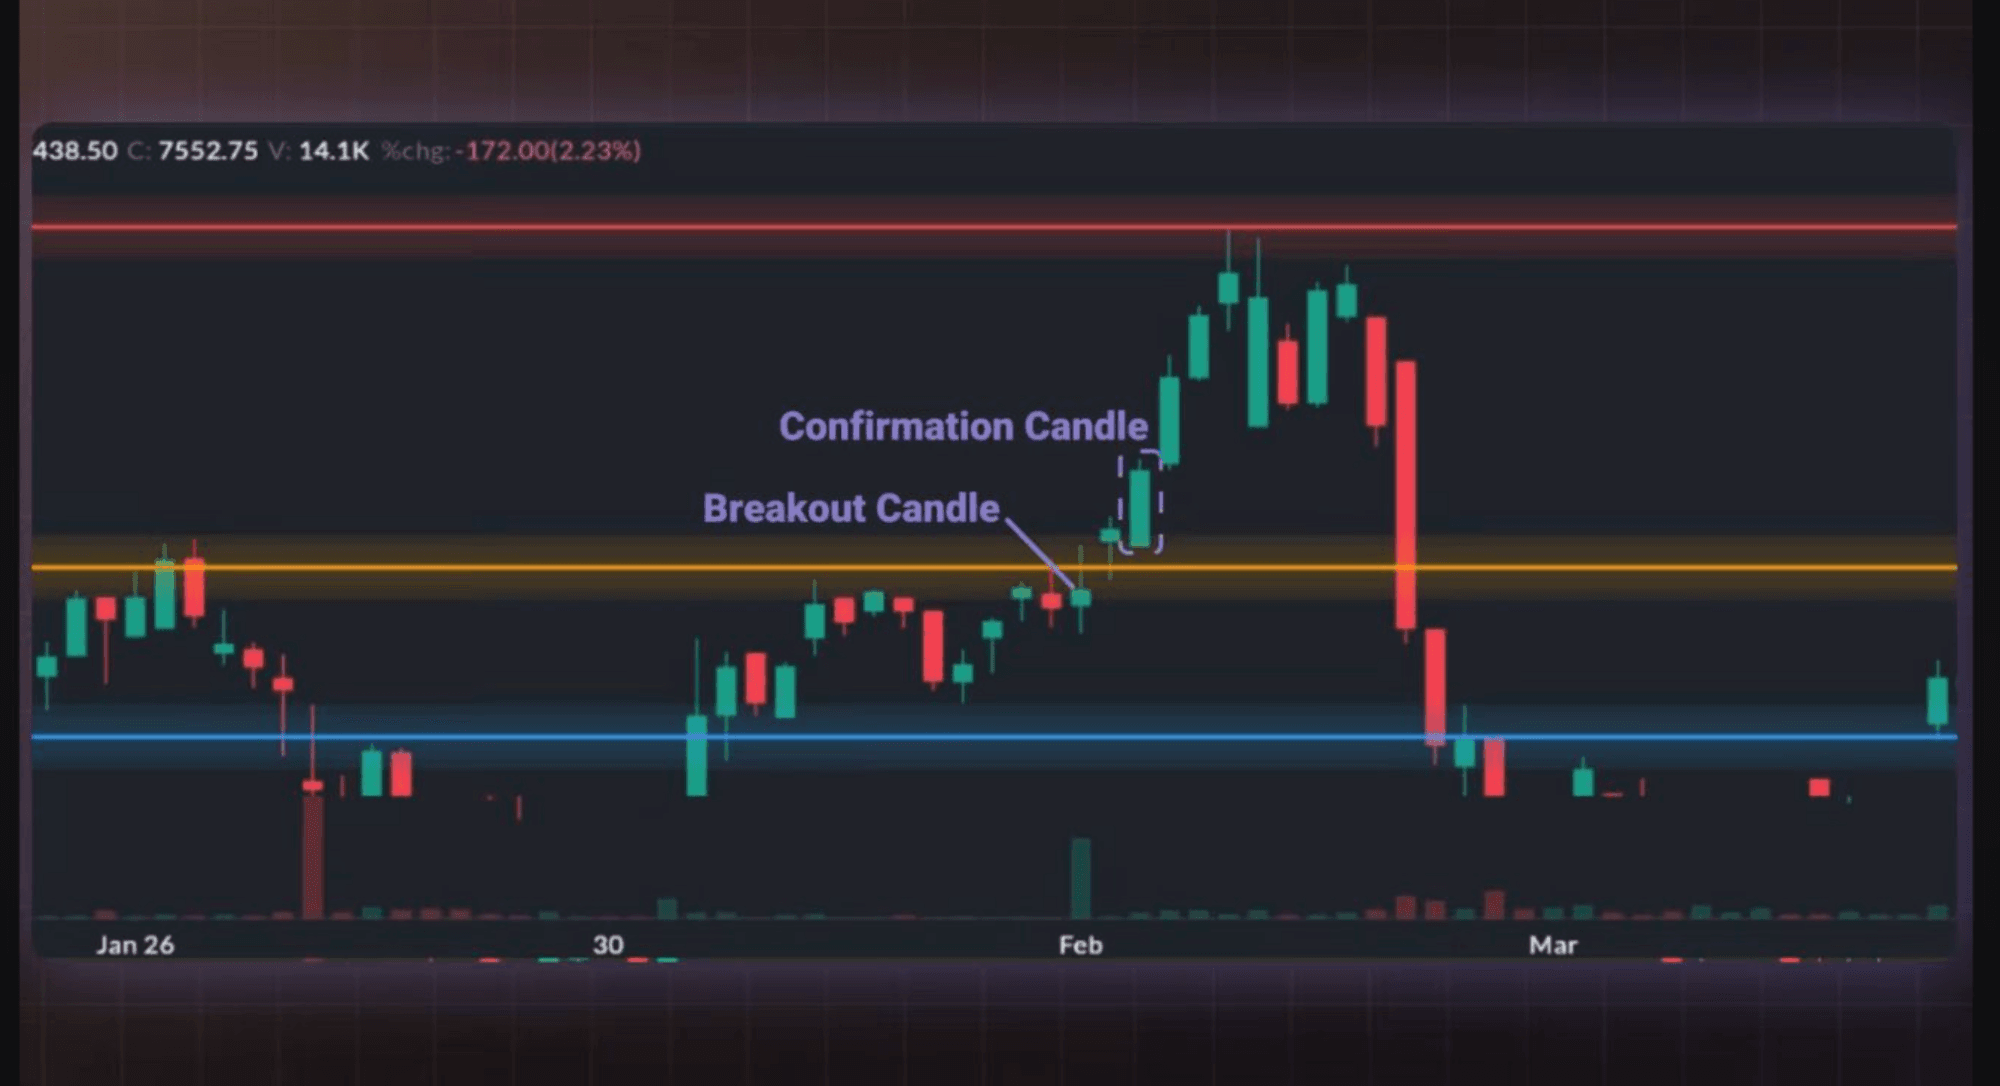
2. Volume Confirmation
Volume plays a crucial role in breakout analysis.
A breakout supported by strong trading volume is generally considered more reliable because it indicates broader market participation.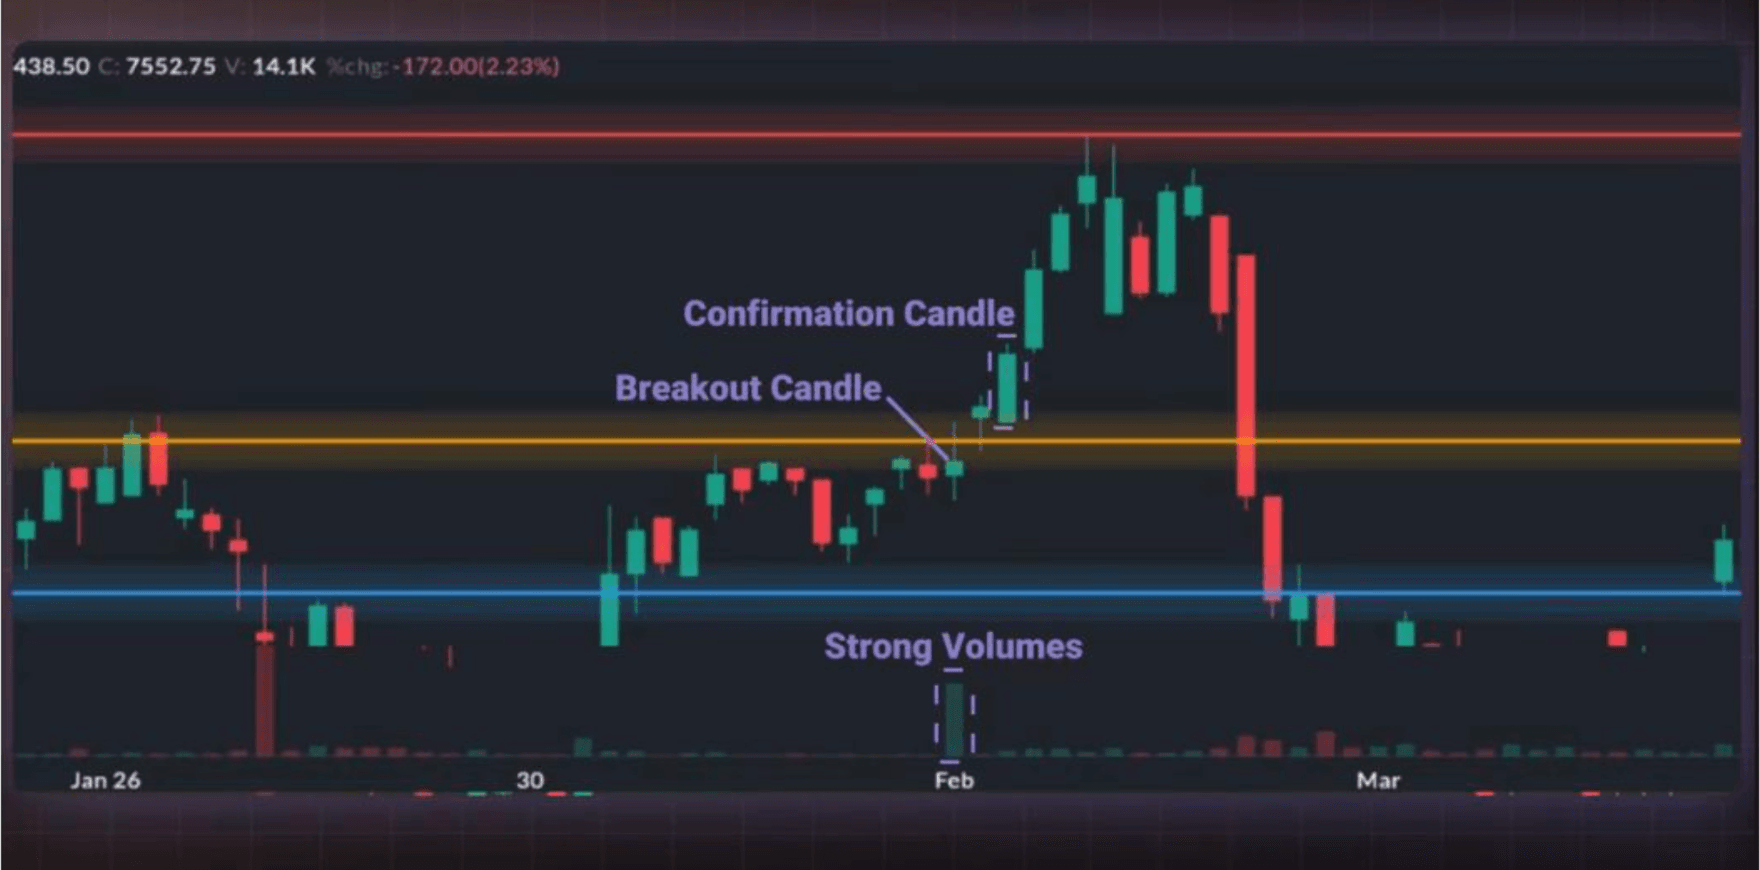
Low-volume breakouts, on the other hand, may fail quickly.
3. Trend Confirmation
Traders often combine breakouts with trend indicators like VWAP or moving averages to check whether momentum supports the move.
Using multiple confirmations helps traders avoid emotionally reacting to every price spike.
How Traders Use Key Levels in Different Market Conditions
Key levels can be used in multiple ways depending on market structure.
Range-Bound Markets
When markets move sideways, traders often buy near support zones and sell near resistance zones.
The idea is simple:
- Buy near demand.
- Sell near supply.
- Exit before the opposite zone.
However, these trades usually offer smaller profit potential because the market remains within a limited range.
Breakout Trading
When price breaks a strong resistance with momentum and volume, traders may look for bullish breakout opportunities.
Similarly, when support breaks with bearish momentum, traders may look for breakdown setups.
Breakout trading can potentially capture larger moves because price enters a new range.
But risk management becomes critical.
Many traders use:
- Stop losses below breakout candles
- Risk-reward ratios of at least 1:2 or higher
- Trailing stop losses during strong trends
This helps manage downside risk while allowing profits to run if momentum continues.
Using VWAP with Key Levels for Intraday Trading
Let's understand how traders use VWAP with SAHI charts to identify stronger intraday breakout setups. Here, we have added two indicators, Key Levels and VWAP.
As you can see, SAHI's terminal automatically highlights the important key levels where the price has been consolidating or reacting multiple times.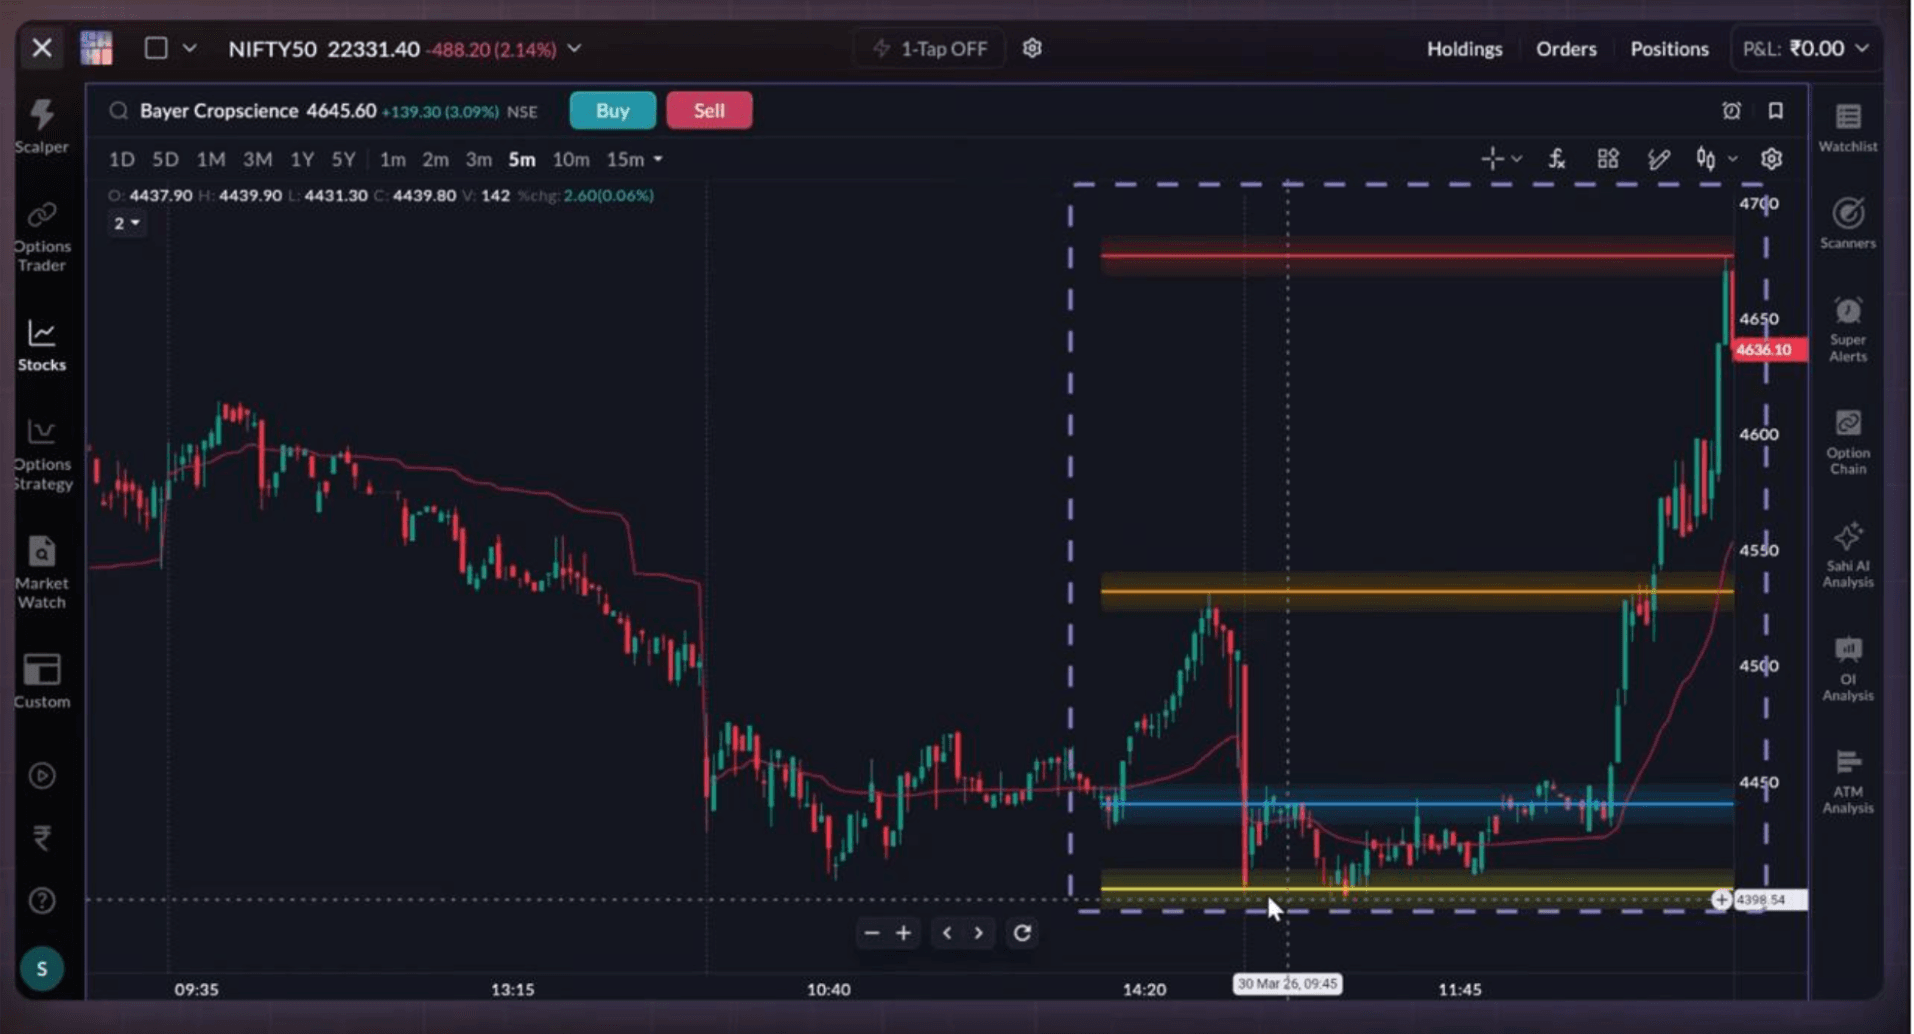
Step 1: Identify the resistance zone.
Notice how the stock keeps reacting around the same upper zone. This becomes an important resistance area where sellers are active.
Step 2: Wait for a strong breakout candle.
Now you can see a strong bullish candlestick breaking above the resistance zone. This signals that buyers are gaining strength and momentum may be shifting upward.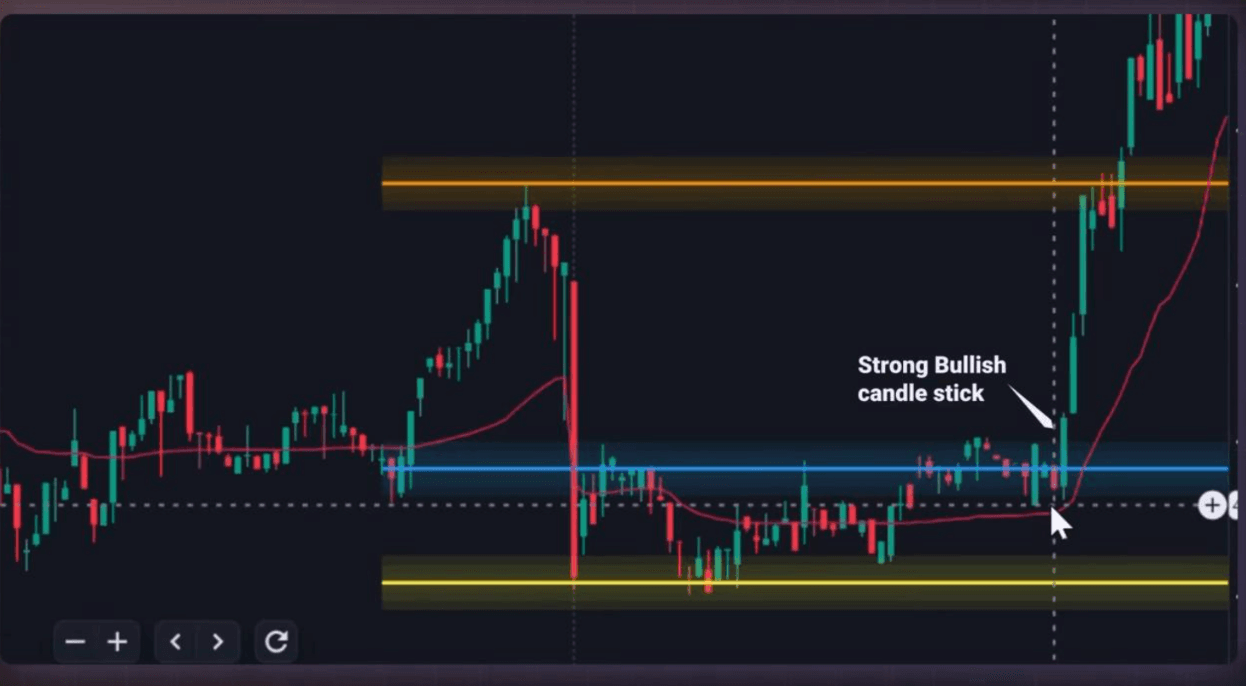
Step 3: Use VWAP for confirmation.
A breakout alone is not enough. Here, the price is trading significantly above VWAP, which confirms strong bullish momentum and suggests that buyers are still in control.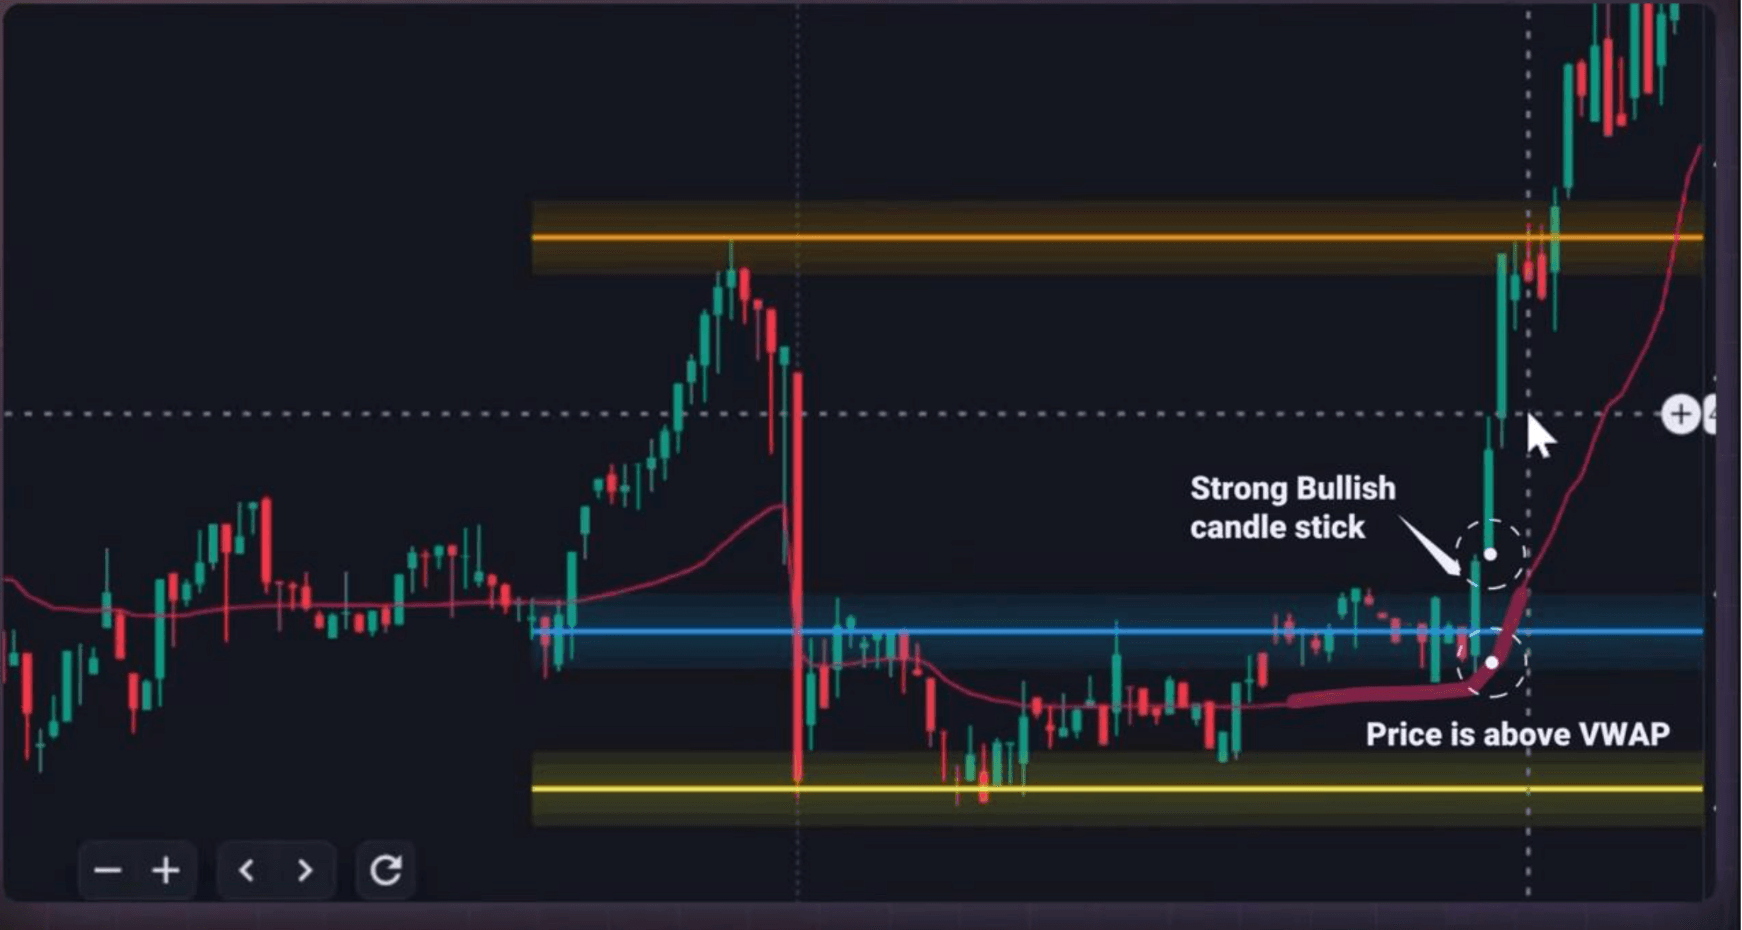
Step 4: Wait for the second candle confirmation.
Instead of entering immediately after the first breakout candle, many traders wait for the second candle formation. If the second candle also sustains above the breakout zone, it increases the probability of trend continuation.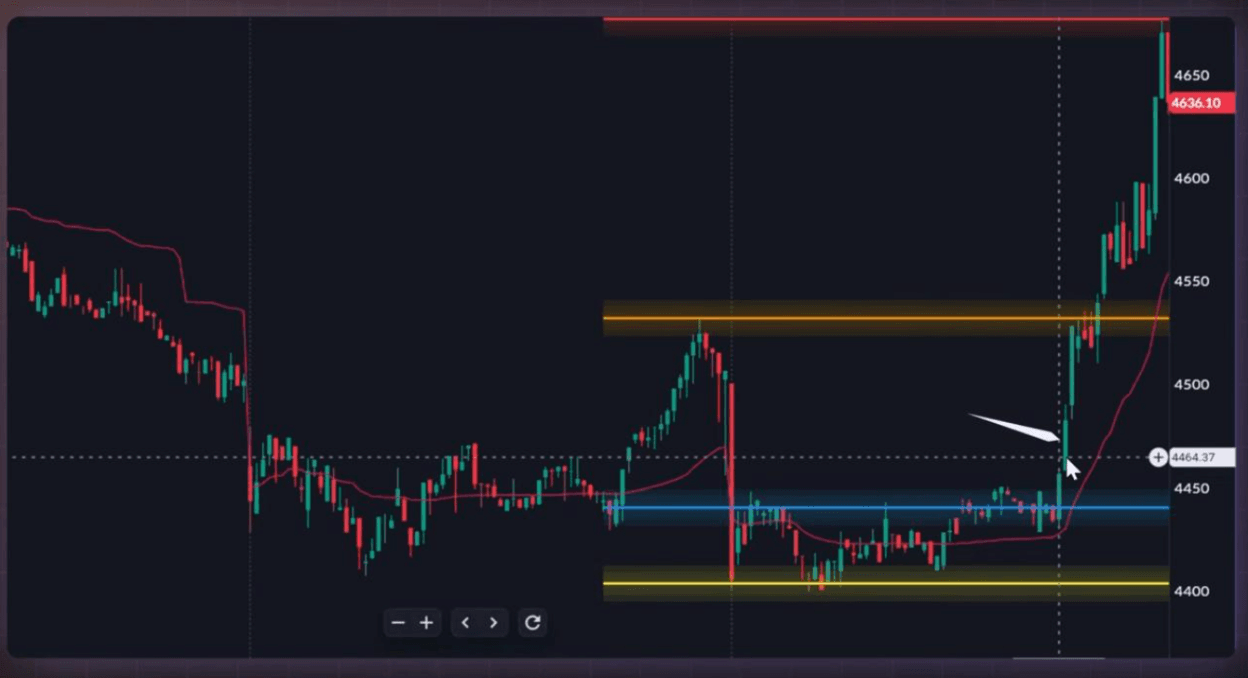
At this stage, traders may consider planning a long position with proper risk management.
This is exactly why VWAP is widely used in intraday trading.
In simple terms: Price above VWAP often indicates bullish intraday momentum. Price below VWAP may indicate bearish momentum.
When breakout zones, VWAP confirmation, strong bullish candles, and momentum all align together, traders get a much clearer idea of whether the breakout is genuine or simply a temporary false move.
You might also be interested in:
For swing trading and higher timeframe analysis, traders often combine key levels with indicators like:
- 200 EMA
- RSI
- Volume analysis
What Is 200 EMA?
The 200 EMA (Exponential Moving Average) is widely used to identify long-term trend direction.
Generally:
- Price above 200 EMA may indicate a bullish trend.
- Price below 200 EMA may indicate a bearish trend.
Traders use it as a trend filter before taking breakout or breakdown trades. Importantly, the 200 EMA itself can act as dynamic support or resistance — price often bounces or stalls when it approaches this level, making it a useful reference point even in trending markets.
What Is RSI?
RSI (Relative Strength Index) is a momentum indicator that measures the speed and strength of price movement.
It helps traders understand whether a stock may be:
- Overbought (RSI above 70)
- Oversold (RSI below 30)
- Losing momentum
- Building momentum
One important and often overlooked use: the RSI 50 level acts as a trend confirmation line. When RSI is consistently above 50, it suggests buyers are in control. When RSI is below 50, sellers tend to dominate. A breakout from resistance that is accompanied by RSI crossing above 50 is generally considered a stronger signal.
When RSI, volume, and trend direction align with key level breakouts, traders may view the setup as stronger. Again, no indicator guarantees success. Technical analysis only helps traders improve probabilities, not certainty.
Why Volume Matters in Technical Analysis
Volume is one of the most important but often ignored aspects of chart reading.
Price movement without volume support may not sustain. That is because volume reflects participation.
When breakouts happen with rising volume, it suggests that more traders and institutions are participating in the move. On the other hand, weak volume during a breakout may indicate lack of conviction.
Many professional traders avoid taking breakout trades without volume confirmation for this reason.
The Growing Role of Smart Charting Tools in Trading
As retail participation in the Indian stock market has increased, charting platforms and trading terminals have become significantly more advanced.
Today, traders no longer rely only on manually drawing support and resistance levels.
Modern trading platforms now offer:
- Automatic key level detection
- Volume analysis
- Momentum indicators
- Breakout identification
- Multi-indicator overlays
- Custom chart layouts
These tools help traders save time and improve consistency in chart analysis.
That is exactly why SAHI is simplifying key level identification by automatically highlighting important support and resistance zones on charts.
Instead of manually marking every level, traders can visually identify areas where price has historically reacted multiple times.
Some tools also display the relative strength of these zones based on previous market reactions. This becomes especially useful for traders who want a more structured approach to technical analysis.
The goal is not to replace decision-making but to reduce clutter and improve clarity while reading charts.
Risk Management Matters More Than Indicators
Many beginner traders spend most of their time searching for the perfect indicator.
But even the best setups fail sometimes.
That is why risk management is far more important than trying to predict every move correctly.
Professional traders focus heavily on:
- Position sizing
- Stop losses
- Risk-reward ratios (minimum 1:2)
- Capital preservation
- Emotional discipline
Even a strategy with moderate accuracy can perform well over time if risk is controlled properly. Technical indicators are tools. The real edge often comes from discipline, consistency, and risk management.