
October F&O Rollover Analysis: Stocks to Watch for November
NIFTY ended flat, but BANKNIFTY rollover hit a 7-month high. See sector trends, long and short build-ups, and our top F&O picks for the November series.


Five stocks to brighten your portfolio this festive season, each backed by a technical setup and a fundamental thesis: Zen Technologies, DLF, Adani Green Energy, BSE and HDFC Bank.
Receive market breakouts, AI insights, and trading strategies directly in your inbox.
SAHI Research | Festive Edition | 4 November 2026

SAHI Research's Diwali Picks 2026 are five stocks to brighten your portfolio this festive season, each backed by a technical setup and a fundamental thesis. The list covers Zen Technologies, DLF, Adani Green Energy, BSE and HDFC Bank, with a buy range, stop loss and two targets for every stock. The horizon for all picks is a 1-to-6-month tactical swing.
| Stock | Theme | Buy Range (₹) | Stop Loss (₹) | Targets (₹) |
|---|---|---|---|---|
| Zen Technologies Ltd NSE: ZENTEC |
Indigenous Defence Technology & Execution Acceleration | 1,700–1,740 | 1,580 | 1,925 / 2,030 |
| DLF Ltd NSE: DLF |
Luxury Housing Demand & Revenue Recognition Inflection | 710–720 | 620 | 790 / 880 |
| Adani Green Energy Ltd NSE: ADANIGREEN |
Renewable Capacity Expansion & Battery Storage Scale-up | 1,350–1,385 | 1,165 | 1,590 / 1,800 |
| BSE Ltd NSE: BSE |
Derivatives Market Share Gains & Operating Leverage | 3,590–3,640 | 2,990 | 4,000 / 4,440 |
| HDFC Bank Ltd NSE: HDFCBANK |
Post-Merger Normalisation & NIM Recovery | 720–740 | 620 | 815 / 870 |
Horizon for all picks: 1-to-6-month tactical swing.
Theme: Indigenous Defence Technology & Execution Acceleration | Horizon: 1-to-6-month tactical swing
| Buy at | Stop Loss | Target 1 | Target 2 |
|---|---|---|---|
| ₹1,700–1,740 | ₹1,580 | ₹1,925 | ₹2,030 |
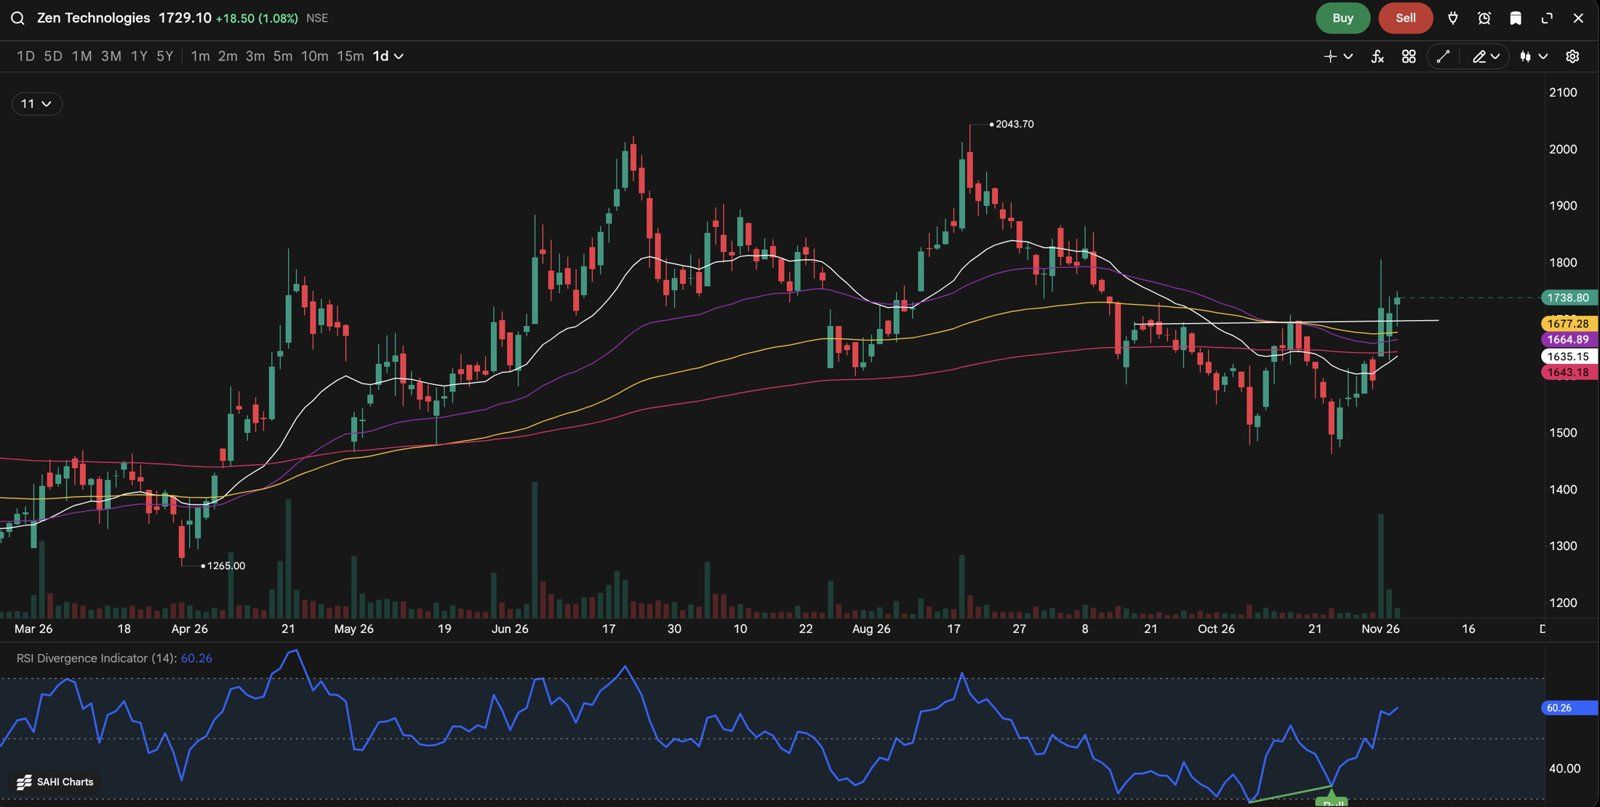
Zen Technologies daily chart: double bottom breakout with a volume spurt and bullish RSI divergence.
| Fundamental Filter | Current Status | Fundamental Implication |
|---|---|---|
| Operating Profitability | Q2 FY27 operational EBITDA increased 103.9% YoY to ₹131.99 Cr, with margins improving to 38.2% from 37.3% YoY and 27.3% in Q1. | Higher execution volumes are improving operating leverage, with profitability recovering towards management's mid-30s full-year margin guidance. |
| Order Book Visibility | Consolidated order book stood at ₹1,375.70 Cr, with Q2 inflows of ₹481.81 Cr exceeding execution of ₹345.13 Cr. | A growing backlog provides visibility into the next few quarters, supported by strong demand across training systems and anti-drone products. |
| Proprietary Technology | Core products are based on indigenous technology, with more than 235 patent applications and over 1,000 training systems shipped globally. | Ownership of core technology enables faster product customisation, reduces dependence on foreign licensors and strengthens positioning in domestic defence procurement. |
| Execution Capability | Q2 revenue reached a record ₹345.13 Cr, while management indicated that the company can execute significantly higher order volumes with its streamlined operating systems. | Improved execution capacity allows Zen to convert its existing order book into revenue faster and potentially accommodate additional procurement orders. |
Fast-Track Procurement Execution
Zen has commenced delivery of Fast Track Procurement orders received during the previous year, ahead of contractual timelines. Q2 FY27 revenue increased 98.8% YoY to ₹345.13 Cr, reflecting accelerated execution of the existing order book. Management expects fresh counter-drone procurement tenders to progress over the coming months, with the earliest potential order awards around Q4 FY27. Faster execution capabilities and ownership of core technology position the company to respond quickly to evolving Armed Forces requirements.
Counter-Drone Procurement Opportunity
Rising requirements for counter-unmanned aerial systems (C-UAS) across border areas and critical infrastructure provide a significant addressable opportunity. Zen has developed indigenous anti-drone systems and has established product capabilities in this segment. Several defence procurement proposals have received Acceptance of Necessity, while approximately 82% of the recently approved capital acquisition proposals are earmarked for domestic sourcing. Conversion of these requirements into actual tenders and orders could provide substantial incremental order inflows, although the timing remains uncertain.
Scaling the Defence Technology Ecosystem
Beyond its traditional training simulators, Zen is expanding across counter-drone systems, naval solutions, robotics, autonomous vehicles and loitering-munition platforms. The broader portfolio allows it to participate in multiple defence procurement categories and reduces dependence on a single product segment. HyperStrike is currently undergoing internal trials, with management expecting a more meaningful contribution from FY28. Successful product development and subsequent procurement approvals could create additional growth opportunities.
Order Book Conversion and Execution
Q2 order inflows of ₹481.81 Cr exceeded execution of ₹345.13 Cr, taking the consolidated order book to ₹1,375.70 Cr. Management expects healthy revenue over the next couple of quarters, supported by the existing backlog. It also indicated that simulator orders worth approximately ₹400 Cr are reasonably likely, although these are not yet part of the confirmed order book. Continued execution alongside fresh simulator and counter-drone orders can support revenue visibility beyond the current quarter.
Theme: Luxury Housing Demand & Revenue Recognition Inflection | Horizon: 1-to-6-month tactical swing
| Buy at | Stop Loss | Target 1 | Target 2 |
|---|---|---|---|
| ₹710–720 | ₹620 | ₹790 | ₹880 |
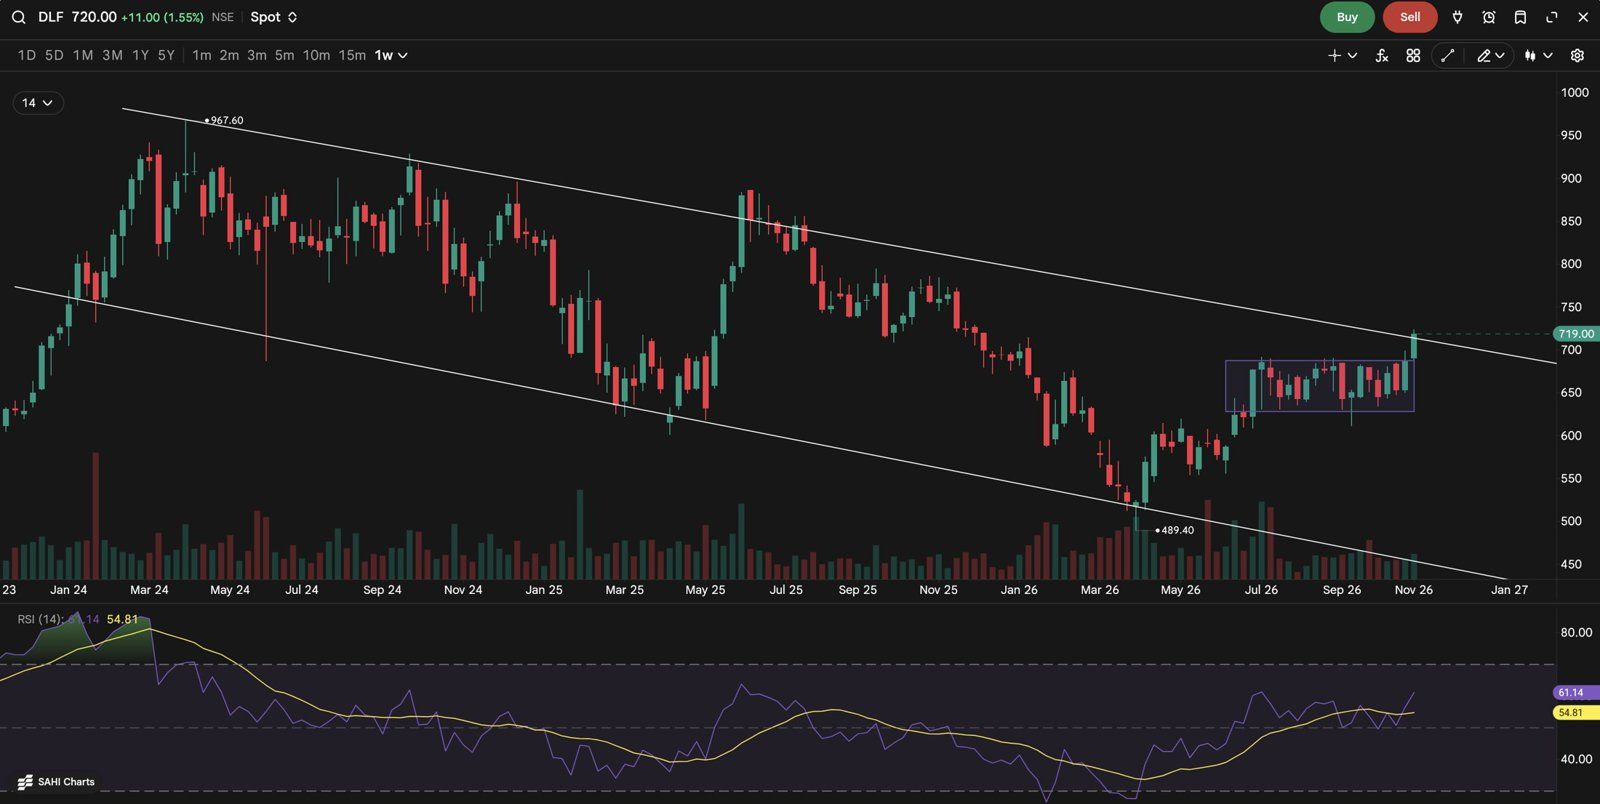
DLF weekly chart: breakout from the multi-year falling channel and the six-month consolidation box.
| Fundamental Filter | Current Status | Fundamental Implication |
|---|---|---|
| Cash Generation | Generated ₹1,858 Cr of operating cash flow against collections of ₹2,780 Cr in Q2 FY27. | Strong collections and cash conversion provide financial flexibility to execute the development pipeline and support construction commitments. |
| Balance Sheet Strength | Reported net cash of ₹15,084 Cr, including ₹12,270 Cr held in RERA 70% accounts. | A substantial net-cash position strengthens the development business's financial flexibility, although RERA-restricted cash should not be considered freely deployable. |
| Annuity Income Cushion | Group rental portfolio of approximately 50 million sq. ft. achieved 96% occupancy by area and 97% by value. DCCDL EBITDA grew 9% YoY to ₹1,537 Cr. | A high-occupancy rental portfolio provides recurring income and cash flows alongside the cyclical development business. |
| Luxury Housing Demand | Q2 sales bookings stood at ₹3,800 Cr, with Aureva completely sold out and continued demand and price increases at Dahlias. | Strong demand for premium residential offerings supports pricing power, project margins and future cash collections. |
Luxury Housing Demand and Pricing Power
Q2 FY27 sales bookings reached ₹3,800 Cr, supported by the complete sell-out of Aureva, which had a potential booking value of approximately ₹1,985 Cr. Dahlias also continued to see strong demand, with management indicating approximately 10% price appreciation during the quarter. Continued traction in super-luxury housing, supported by DLF's established brand and limited availability of comparable developments, can sustain premium realisations and project margins.
Project Completion and Revenue Recognition
DLF is approaching an important revenue-recognition inflection beginning FY27–FY28, led by The Arbour. This will be followed by a series of project completions, including the Privana developments and Dahlias over the subsequent years. As these projects reach completion and handover, the company expects a stronger conversion of earlier bookings into recognised revenue and reported earnings. This provides visibility into the next phase of development-business profitability.
Strong Cash Generation and Balance Sheet
DLF generated ₹1,858 Cr of operating cash flow in Q2 FY27, with collections of ₹2,780 Cr. Its reported net-cash position remained at ₹15,084 Cr despite a dividend payout of approximately ₹1,980 Cr during the quarter. Strong collections and disciplined capital allocation provide the financial flexibility to fund construction and future launches, although a substantial portion of reported cash is held in RERA accounts.
Recurring Rental Income
The group's approximately 50 million sq. ft. rental portfolio achieved its highest-ever occupancy of 96% by area and 97% by value. DCCDL reported 9% YoY EBITDA growth to ₹1,537 Cr in Q2 FY27. Continued rental growth, supported by high occupancy and upcoming commercial completions, provides a recurring earnings stream alongside residential development.
Theme: Renewable Capacity Expansion & Battery Storage Scale-up | Horizon: 1-to-6-month tactical swing
| Buy at | Stop Loss | Target 1 | Target 2 |
|---|---|---|---|
| ₹1,350–1,385 | ₹1,165 | ₹1,590 | ₹1,800 |
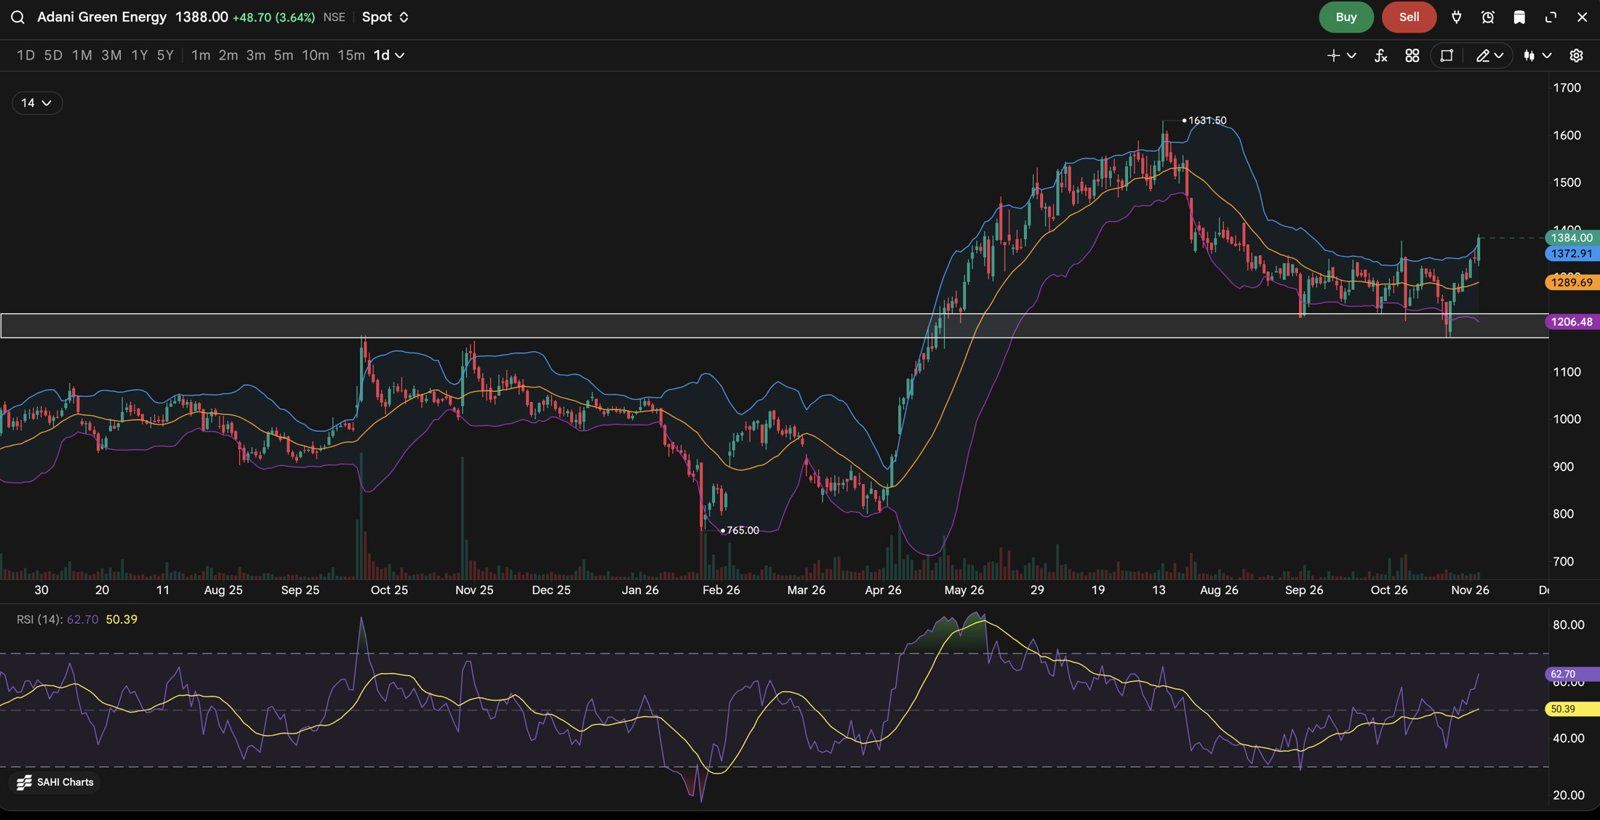
Adani Green Energy daily chart: bounce from the polarity zone and breakout above the upper Bollinger Band.
| Fundamental Filter | Current Status | Fundamental Implication |
|---|---|---|
| Operating Profitability | Q2 FY27 power-supply EBITDA increased 51% YoY to ₹3,835 Cr, with the segment margin expanding to 92% from 90.5%. | High operating margins and incremental generation are supporting strong EBITDA growth as newly commissioned capacity contributes to revenue. |
| Capacity Expansion | Operational renewable capacity reached 20.8 GW, up 24% YoY, with energy sales increasing 33% in Q2 to 12,090 MUs. | Rapid capacity additions and higher energy sales provide visibility into future power-supply revenue growth, subject to commissioning and transmission availability. |
| Battery Storage Leadership | Installed BESS capacity reached 6.63 GWh, accounting for more than 50% of India's operational BESS capacity. | Large-scale storage deployment can improve renewable dispatchability, mitigate curtailment and support better utilisation of the generation portfolio. |
| Execution Pipeline | Khavda's operational portfolio reached 10.75 GW, with management targeting 30 GW by 2029. | Continued execution at Khavda provides a significant multi-year capacity expansion opportunity, although it requires substantial capital deployment. |
The Khavda Mega-Park Execution
AGEL's operational renewable portfolio at Khavda reached 10.75 GW, including 10 GW of its own generation capacity. The company is targeting 30 GW at the site by 2029. During H1 FY27, AGEL added 4,083 MW of renewable capacity on a YoY basis, demonstrating its execution capabilities across solar, wind and hybrid projects. Continued commissioning at Khavda can convert construction capex into incremental generation capacity and power-supply revenue.
Accelerating Power-Supply Growth
Q2 FY27 power-supply revenue increased 45% YoY to ₹4,019 Cr, while energy sales grew 33% to 12,090 MUs. Power-supply EBITDA increased 51% to ₹3,835 Cr, with segment margins expanding to 92%. The combination of higher operational capacity, increased energy generation and strong operating margins is supporting substantial earnings growth. Further capacity commissioning can sustain this momentum over the coming quarters.
Battery Storage Scale-up
AGEL added 3.08 GWh of BESS capacity at Khavda during Q2, taking cumulative installed capacity to 6.63 GWh, representing more than half of India's operational BESS capacity. Large-scale storage deployment can help address transmission-related curtailment, improve generation flexibility and support the integration of intermittent renewable energy. Management also indicated that the company could surpass its 10 GWh BESS capacity guidance for FY27.
Renewable Energy Infrastructure Expansion
With operational capacity at 20.8 GW and a longer-term target of 50 GW by 2030, AGEL is positioned to benefit from India's expanding renewable energy requirements. Its integrated solar, wind, hybrid and battery storage capabilities provide an opportunity to improve the reliability and dispatchability of renewable power. Continued execution and capacity commissioning remain the primary drivers of future revenue and EBITDA growth.
Theme: Derivatives Market Share Gains & Operating Leverage | Horizon: 1-to-6-month tactical swing
| Buy at | Stop Loss | Target 1 | Target 2 |
|---|---|---|---|
| ₹3,590–3,640 | ₹2,990 | ₹4,000 | ₹4,440 |
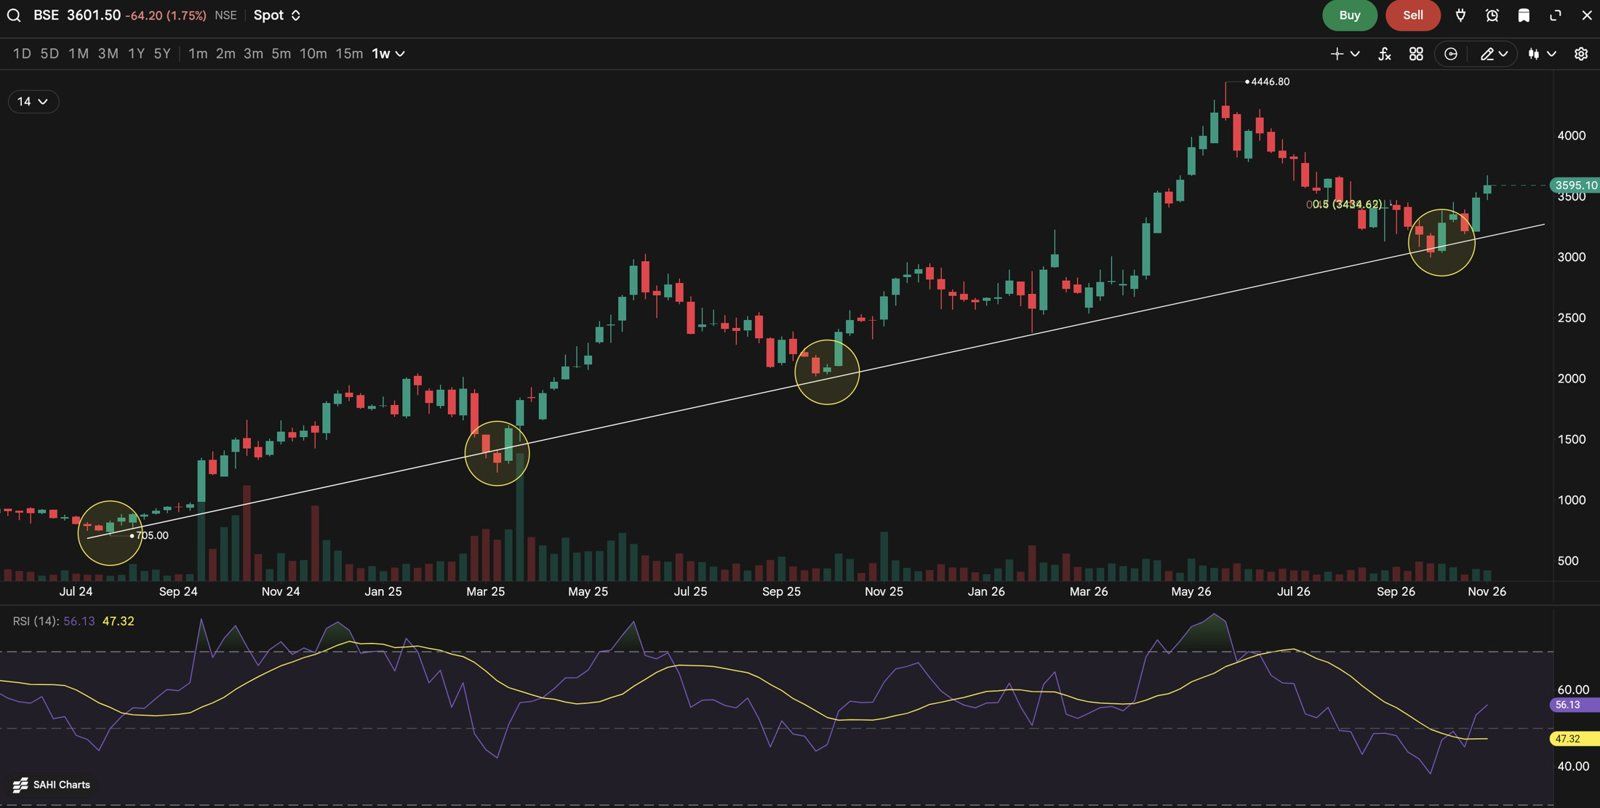
BSE weekly chart: rising trendline support respected on four occasions since 2024.
| Fundamental Filter | Current Status | Fundamental Implication |
|---|---|---|
| Operating Profitability | Q2 FY27 operating EBITDA excluding Core SGF increased 42.4% YoY to ₹984 Cr, with margins at approximately 68.7%. | The asset-light exchange model allows incremental transaction revenue to translate into strong operating profitability, although earnings remain sensitive to market activity. |
| Transaction Revenue Growth | Consolidated transaction charges increased 42% YoY to ₹1,127.8 Cr in Q2 FY27. | Higher trading participation and improving market share in derivatives are supporting strong transaction revenue growth. |
| Derivatives Market Share | Average daily derivatives premium turnover increased 50% YoY to ₹2,25,307 million, despite declining 24% sequentially. | BSE's growing participation in equity derivatives provides an additional growth driver, although trading activity remains sensitive to regulation and market conditions. |
| Diversified Revenue Streams | Beyond transaction charges, BSE generates income from listing services, mutual fund distribution, data services, clearing and investments. | Multiple revenue streams provide some diversification from trading-linked income and create opportunities to monetise India's broader financialisation trend. |
Derivatives Market Share Gains
BSE has been steadily expanding its presence in equity derivatives, particularly through its Sensex options franchise. Q2 FY27 average daily derivatives premium turnover increased 50% YoY to ₹2,25,307 million, despite a 24% sequential decline. Growing participation from brokers, retail investors and institutional participants can support further market-share gains. The key driver is not simply overall market growth, but BSE's ability to capture a larger share of India's equity derivatives activity.
Regulatory Normalisation and Trading Activity
The earlier Closing Auction Session framework created uncertainty around trading behaviour and derivatives settlement, contributing to lower market activity during Q2. SEBI announced a revised framework on October 15, 2026, with implementation scheduled from December 7. Greater clarity around market timings and settlement arrangements could support a gradual normalisation in trading activity. The actual impact on derivatives volumes and BSE's market share will need to be monitored.
Operating Leverage and Earnings Growth
Q2 FY27 operating EBITDA excluding Core SGF increased 42.4% YoY to ₹984 Cr, while the corresponding margin stood at approximately 68.7%. Transaction charges increased 42% YoY to ₹1,127.8 Cr, demonstrating the strong earnings potential of BSE's asset-light exchange model. Sustained transaction revenue growth, combined with operating-cost discipline, can support further earnings expansion.
Financialisation Beyond Trading
BSE's growth opportunity extends beyond equity and derivatives transactions. Its StAR MF platform had 307 million registered investors, 84,711 distributors and coverage across 721 cities and towns as of September 2026. H1 FY27 mutual fund revenue increased 11% YoY to ₹145.7 Cr, while order volumes grew 25%. Growth in mutual fund distribution, index services, data dissemination, listing and corporate services provides additional avenues to monetise India's expanding financial savings pool.
Theme: Post-Merger Normalisation & NIM Recovery | Horizon: 1-to-6-month tactical swing
| Buy around | Stop Loss | Target 1 | Target 2 |
|---|---|---|---|
| ₹720–740 | ₹620 | ₹815 | ₹870 |
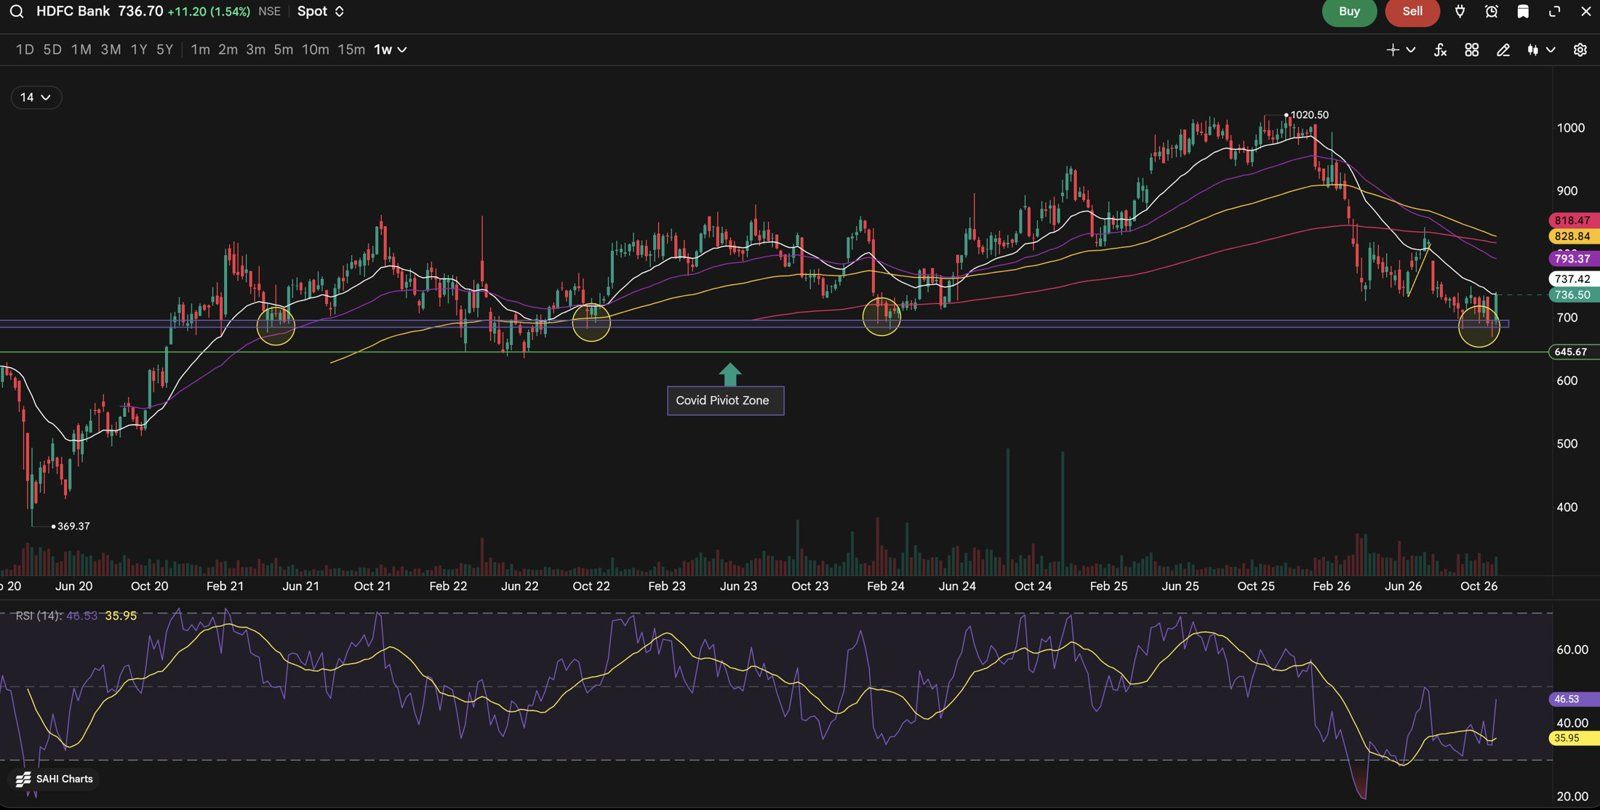
HDFC Bank weekly chart: reactions at the ₹680–700 demand zone and the Covid pivot zone (₹645.67).
| Level | Price (₹) | Significance |
|---|---|---|
| All-Time High | 1,020 | Prior peak and origin of the current correction |
| Target 2 | 870 | Second target |
| Target 1 | 815 | First target |
| Buy Zone | 720–740 | Recommended entry range |
| Historical Demand Zone | 680–700 | Tested three times since 2021, each followed by a resumption of the uptrend |
| Covid Pivot Zone | 630–650 | Launchpad of the post-Covid rally; make-or-break structural support |
| Stop Loss | 620 | Sustained close below invalidates the thesis |
| Fundamental Filter | Current Status | Fundamental Implication |
|---|---|---|
| Asset Quality | GNPA improved to 1.11% from 1.17% QoQ and 1.24% YoY; NNPA stood at 0.37%. | Strong asset quality provides resilience and supports credit growth without a material deterioration in risk. |
| Core Profitability | Q2 FY27 PAT grew 12.6% YoY excluding treasury trading gains, against reported PAT growth of 4.7%. | Underlying earnings growth is stronger than reported profitability, indicating improving core business momentum. |
| Margin Recovery | NII grew 9.7% YoY to ₹34,619 Cr, while NIM stood at 3.16% of total assets versus 3.26% in Q1 FY27. | Management expects margins to improve from Q3 FY27, creating a potential earnings acceleration catalyst. |
| Deposit & Loan Growth | Advances grew 16.3%, while deposits increased 18.8% YoY. CASA grew 10.8%, with a 31.6% CASA ratio. | Healthy loan growth and an improving liability franchise support balance-sheet expansion, although deposit mix remains a key monitorable. |
NIM Recovery
Q2 FY27 NIM stood at 3.16% of total assets, down from 3.26% in Q1 FY27. Management indicated that margins have bottomed and expects an upward trajectory from Q3 FY27, supported by loan repricing and funding-cost adjustments. A sustained recovery in NIM would directly support NII growth and earnings acceleration.
Core Earnings Normalisation
Reported PAT grew 4.7% YoY to ₹19,510 Cr, while PAT excluding treasury trading gains increased 12.6%. The divergence highlights stronger underlying earnings momentum, with further improvement possible as margins recover and core banking income expands.
Retail & MSME Growth Acceleration
Retail disbursements crossed ₹90,000 Cr in Q2 FY27, compared with ₹76,000 Cr in Q1. Retail loans grew 11.7% YoY, while SME loans expanded 23.5%. Sustained momentum in these segments can support loan growth and improve the utilisation of the bank's distribution franchise.
Deposit Franchise Strengthening
Deposits grew 18.8% YoY, while CASA grew 10.8%. The addition of 1.7 million liability relationships during Q2 indicates improving customer acquisition momentum. Further improvement in CASA and deposit mix would help moderate funding costs and support margin recovery.
The setup weakens if NIM recovery is delayed beyond Q3 FY27, deposit growth remains dependent on higher-cost term deposits or loan growth outpaces sustainable liability mobilisation. Any deterioration in asset quality or failure to translate core earnings growth into reported PAT would also weaken the re-rating thesis.
Wishing you light, prosperity and a rewarding year in the markets.
SAHI Research is a SEBI-registered Research Analyst. This report contains research recommendations based on technical and fundamental analysis as of 4 November 2026. Recommended price levels, stop losses and targets reflect our views on the report date and may change without notice. Past performance is not indicative of future returns. Investors should consider their own financial situation, investment objectives and risk appetite before acting on these recommendations.
Registration granted by SEBI and certification from NISM in no way guarantee performance of the intermediary or provide any assurance of returns to investors. Investments in securities market are subject to market risks. Read all the related documents carefully before investing.
For the full disclaimer and disclosures, including those on financial interest and conflicts of interest, visit www.SAHI.com/research-disclaimer.
Disclaimer: This research section may include AI-generated or AI-assisted research, summaries, drafts, or insights. All content is subject to human review before publication. While we aim for accuracy, readers should independently verify information before relying on it.
No related research found.
No related research found.
NIFTY ended flat, but BANKNIFTY rollover hit a 7-month high. See sector trends, long and short build-ups, and our top F&O picks for the November series.
A participant-wise breakdown of the November series: why the rally was covering not buying, who paid whom, and what the market needs to show next.
Nifty’s Breakout! Birlasoft Surges 12%, Asian Paints Profit Rises 7.6%, Key Levels & Stocks to Watch!
Click the link, confirm the box next to sahi.com is checked — ignore any other results.