
Using OI, Support & Resistance and Volatility to Read Market Context
A setup does not behave the same way in every market condition. The same breakout that works cleanly in a trending market can fail completely in a low-volume or range-bound session. This chapter focuses on how OI, support and resistance, volatility, and Vega help explain positioning, reaction zones, and changing premium behaviour during scalping.
 12 minutes read|
Why Market Context Matters
The exact same candlestick pattern or indicator trigger can produce very different results depending on what’s going on in the market. Context directly affects intraday momentum, reversal reliability, and options premium behaviour.
Scalping becomes more consistent when you stop chasing isolated signals and start aligning trades with overall market conditions.
Trend vs. Chop: A breakout pattern during an active, high-volume trend often leads to clean continuation moves. The exact same pattern during low-volume consolidation can lead to fakeouts and premium decay.
The Location Filter: Price action does not react randomly. Strong reactions usually happen near structural levels where large market participants are active. Ignoring context means trading in the middle of low-quality price action.
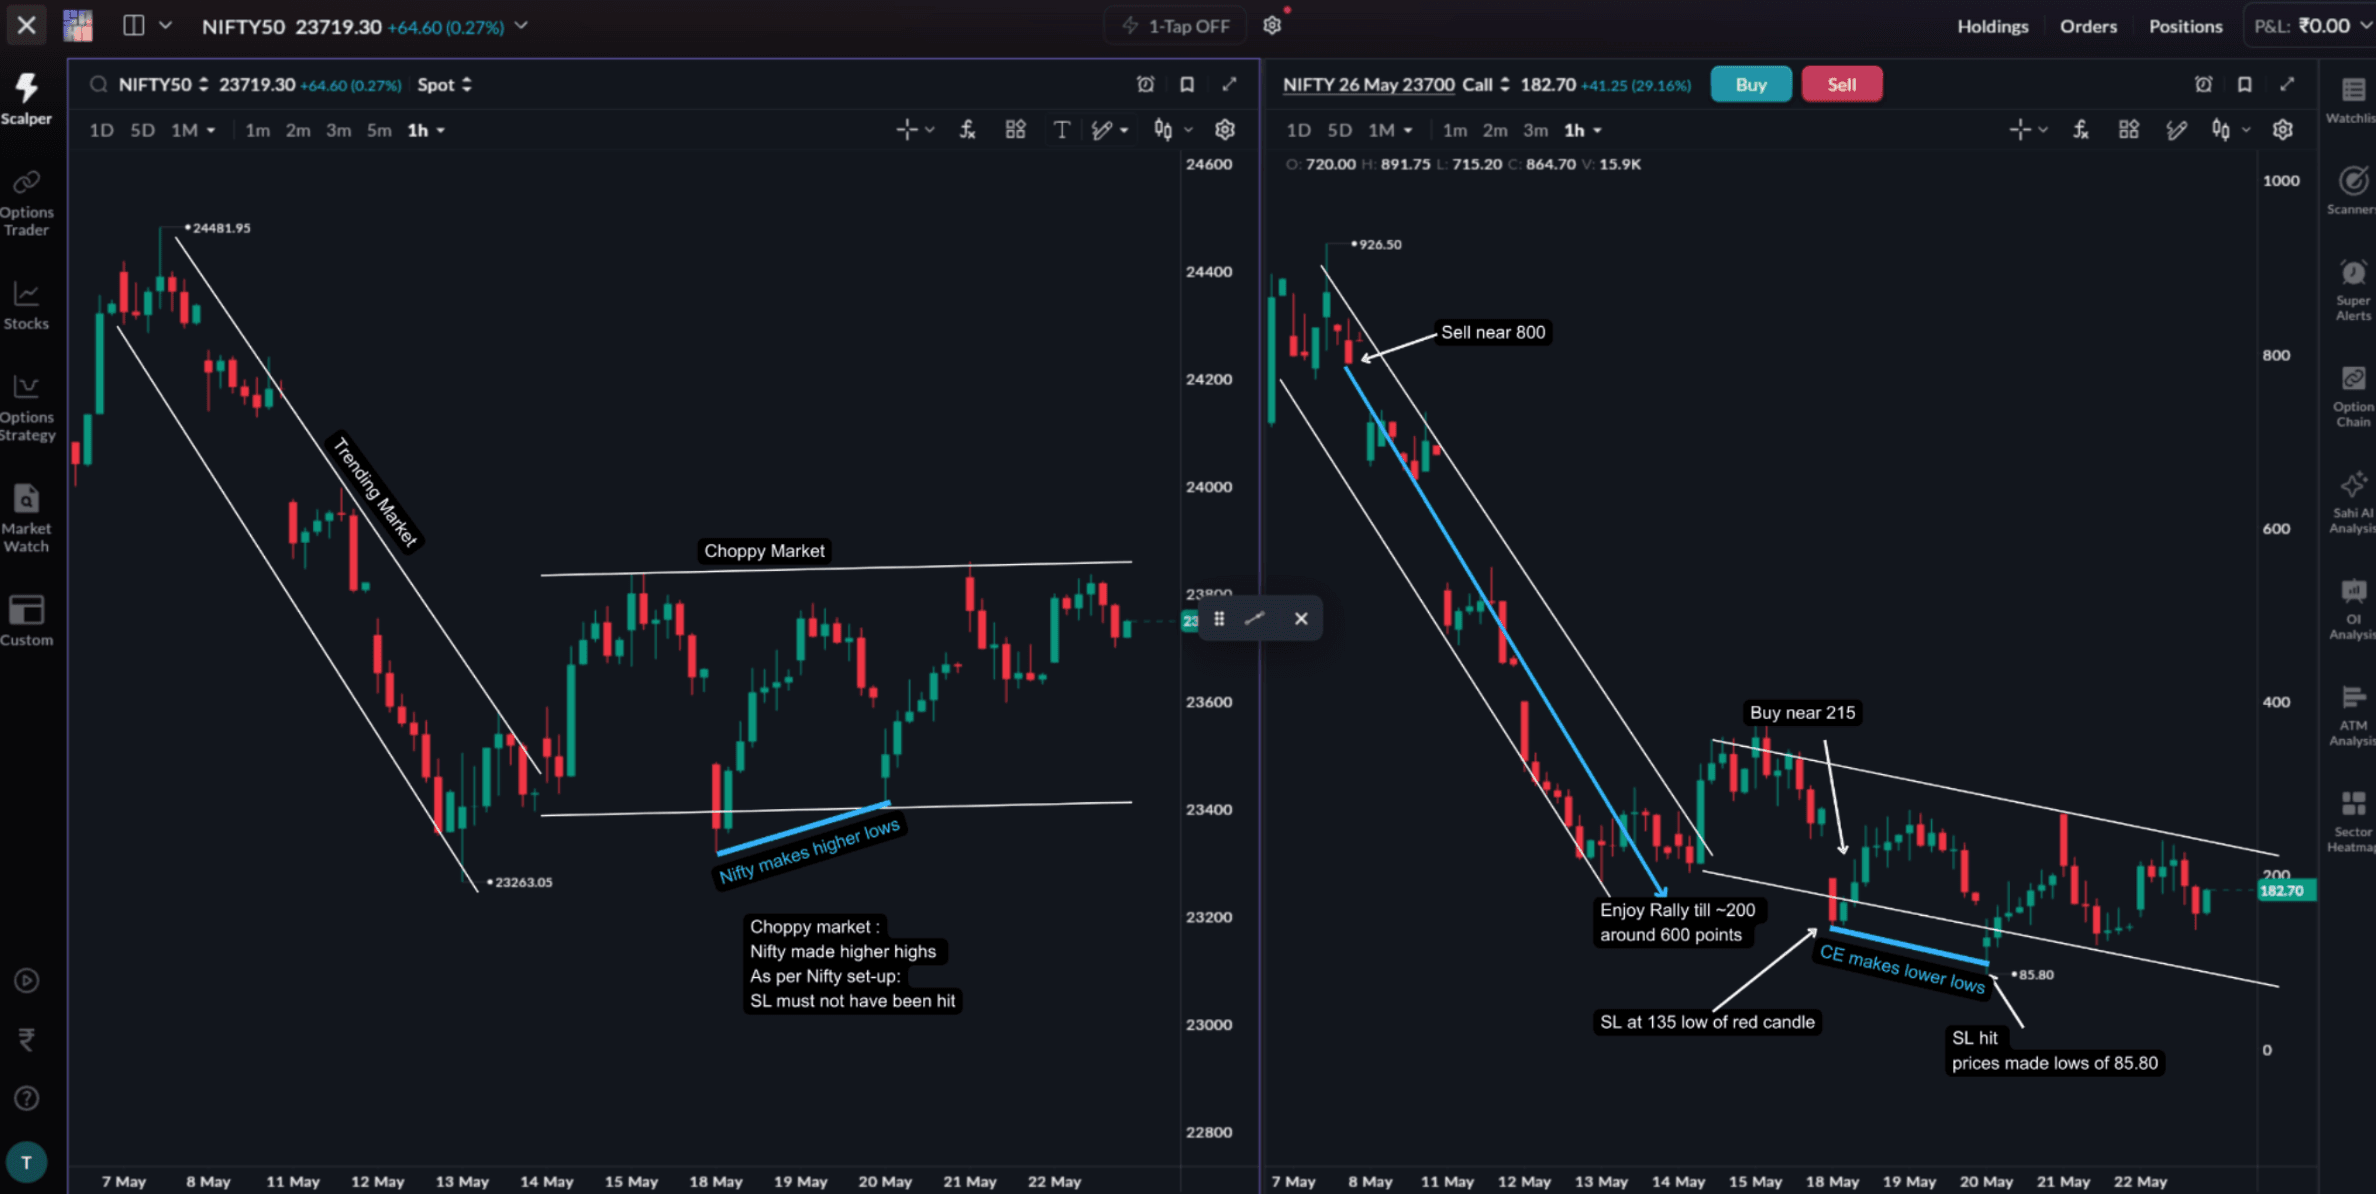
Once the importance of context becomes clear, the next step is understanding how traders identify where participation is building inside the market.
Open Interest helps identify where that participation is building.
Understanding Open Interest (OI)
Open Interest (OI) represents the total number of live derivative contracts that have not yet been settled or closed.
In options scalping, OI shifts help identify where large market participants are building positions and defending strikes.
How positioning builds around strikes
Large institutional traders are typically option writers (sellers) who deploy significant capital around specific strike prices.
When a large cluster of contracts builds at a strike, that level often becomes an important structural zone on the chart.
Using SAHI OI Tools
SAHI’s OI tools help simplify this process by highlighting major positioning zones directly on the chart.
Traders can also use the OI Filter and OI Profile tools to overlay OI-based positioning alongside live price action, making it easier to spot fresh build-up and shifting participation during the session.
Instead of manually tracking multiple strikes, traders can quickly identify:
- Major support and resistance zones
- Fresh build-up areas
- Where positioning is shifting during breakout or reversal
This allows traders to monitor both price movement and OI behaviour together without repeatedly switching between the chart and option chain.
OI becomes more useful when those positions start clustering around specific strike prices.
Over time, these zones begin behaving like active support and resistance areas during the session.
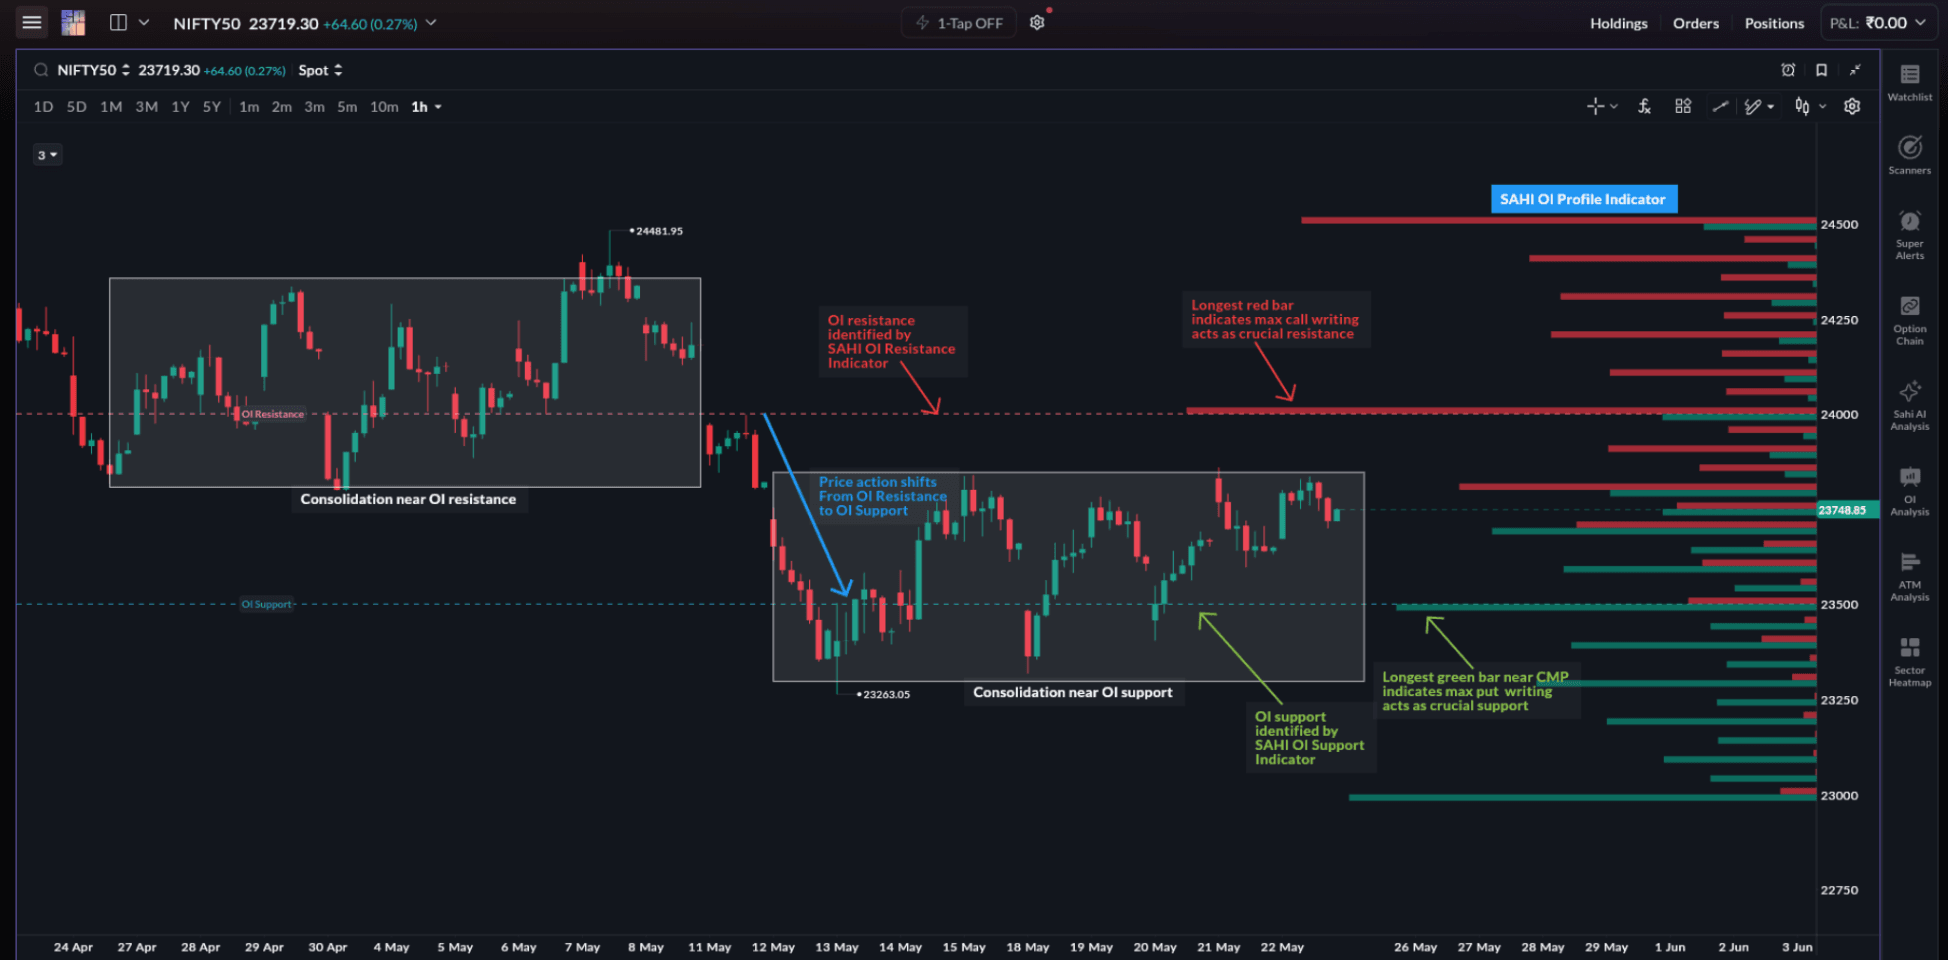
By combining live price movement with real-time OI changes, traders can better understand positioning shifts in the market.
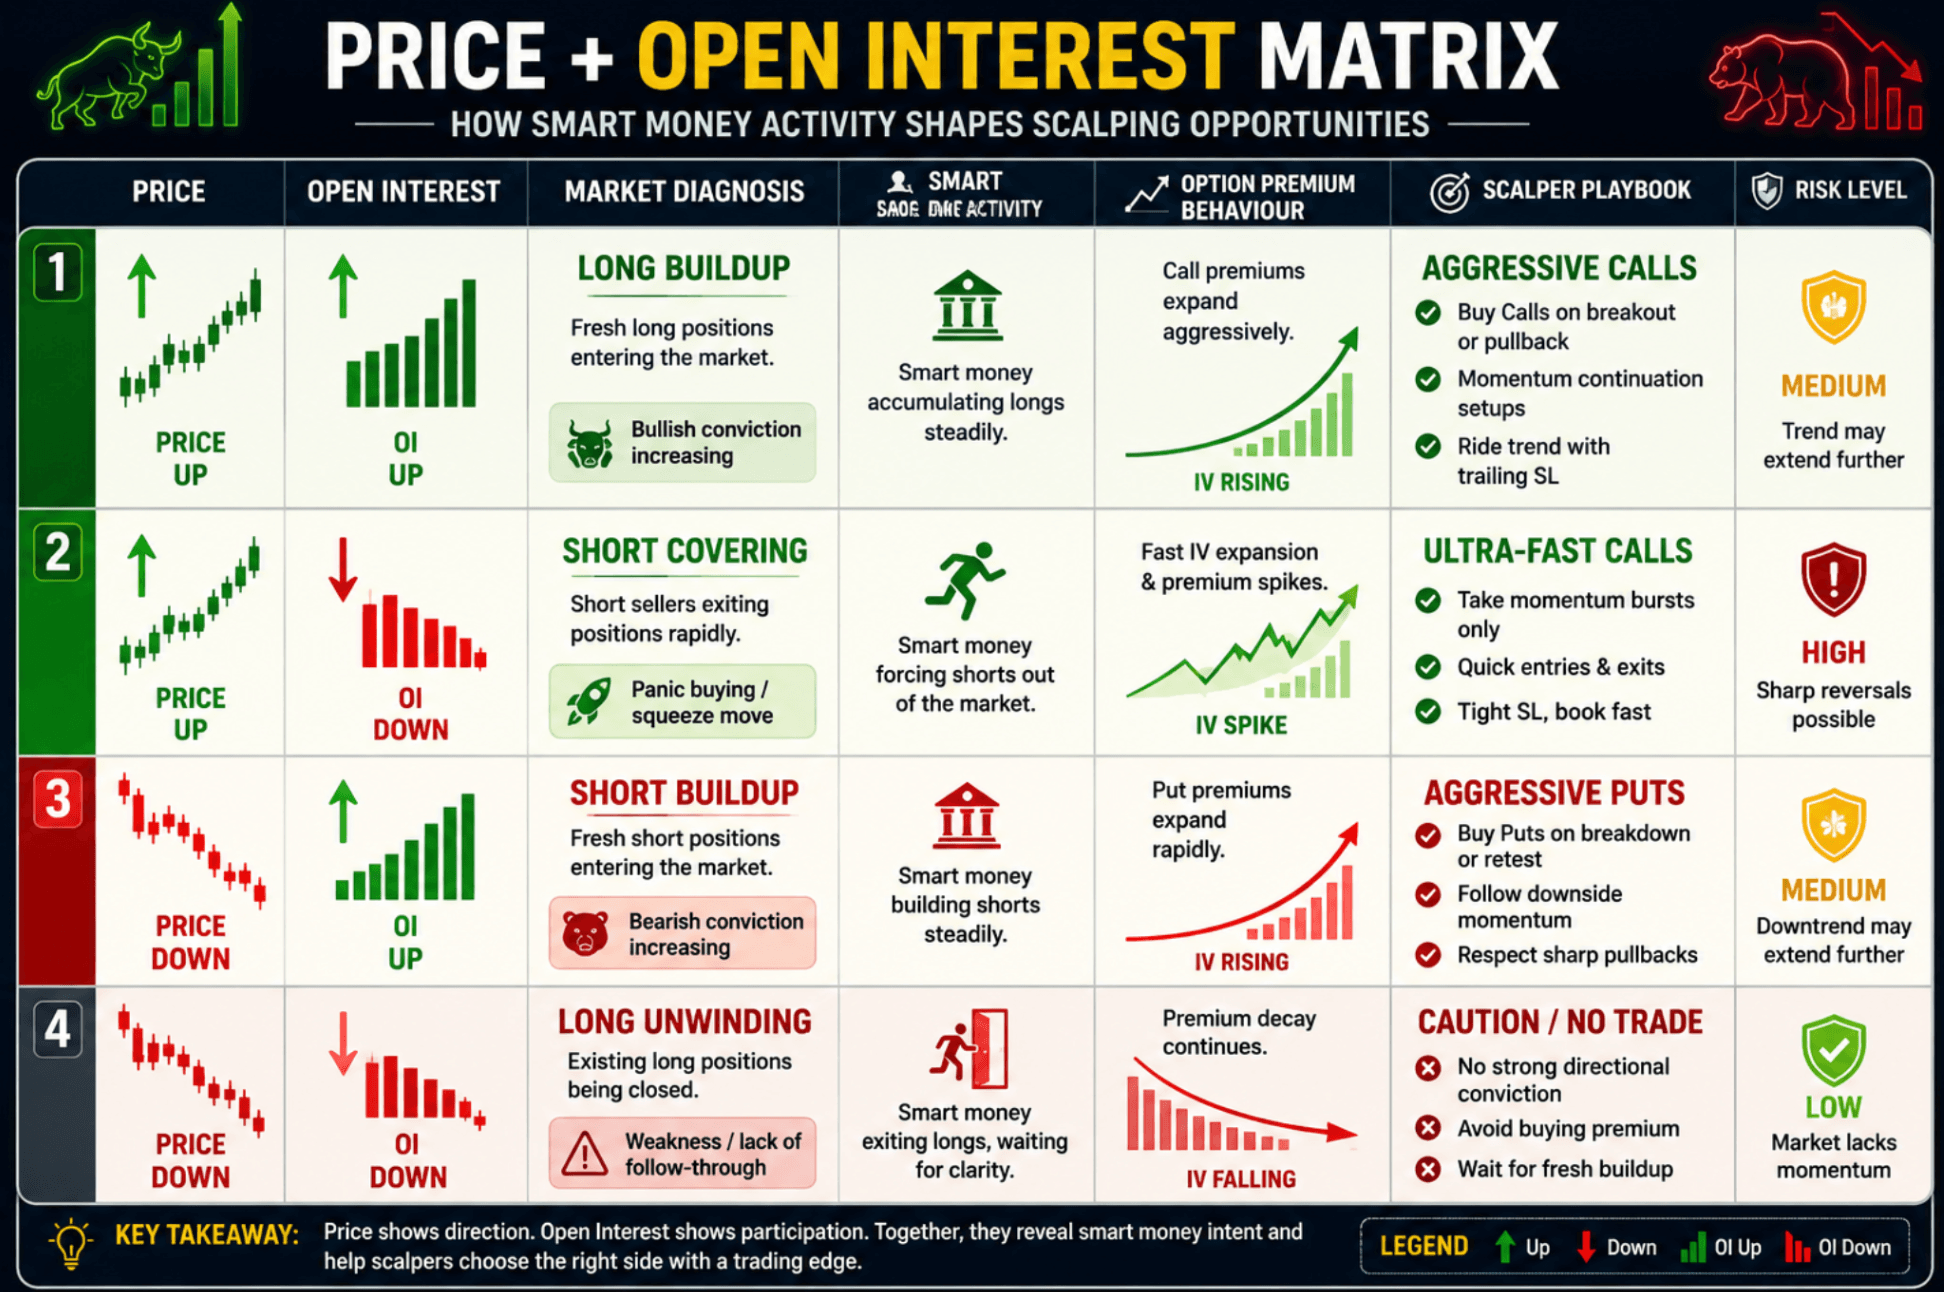
OI-Based Support and Resistance
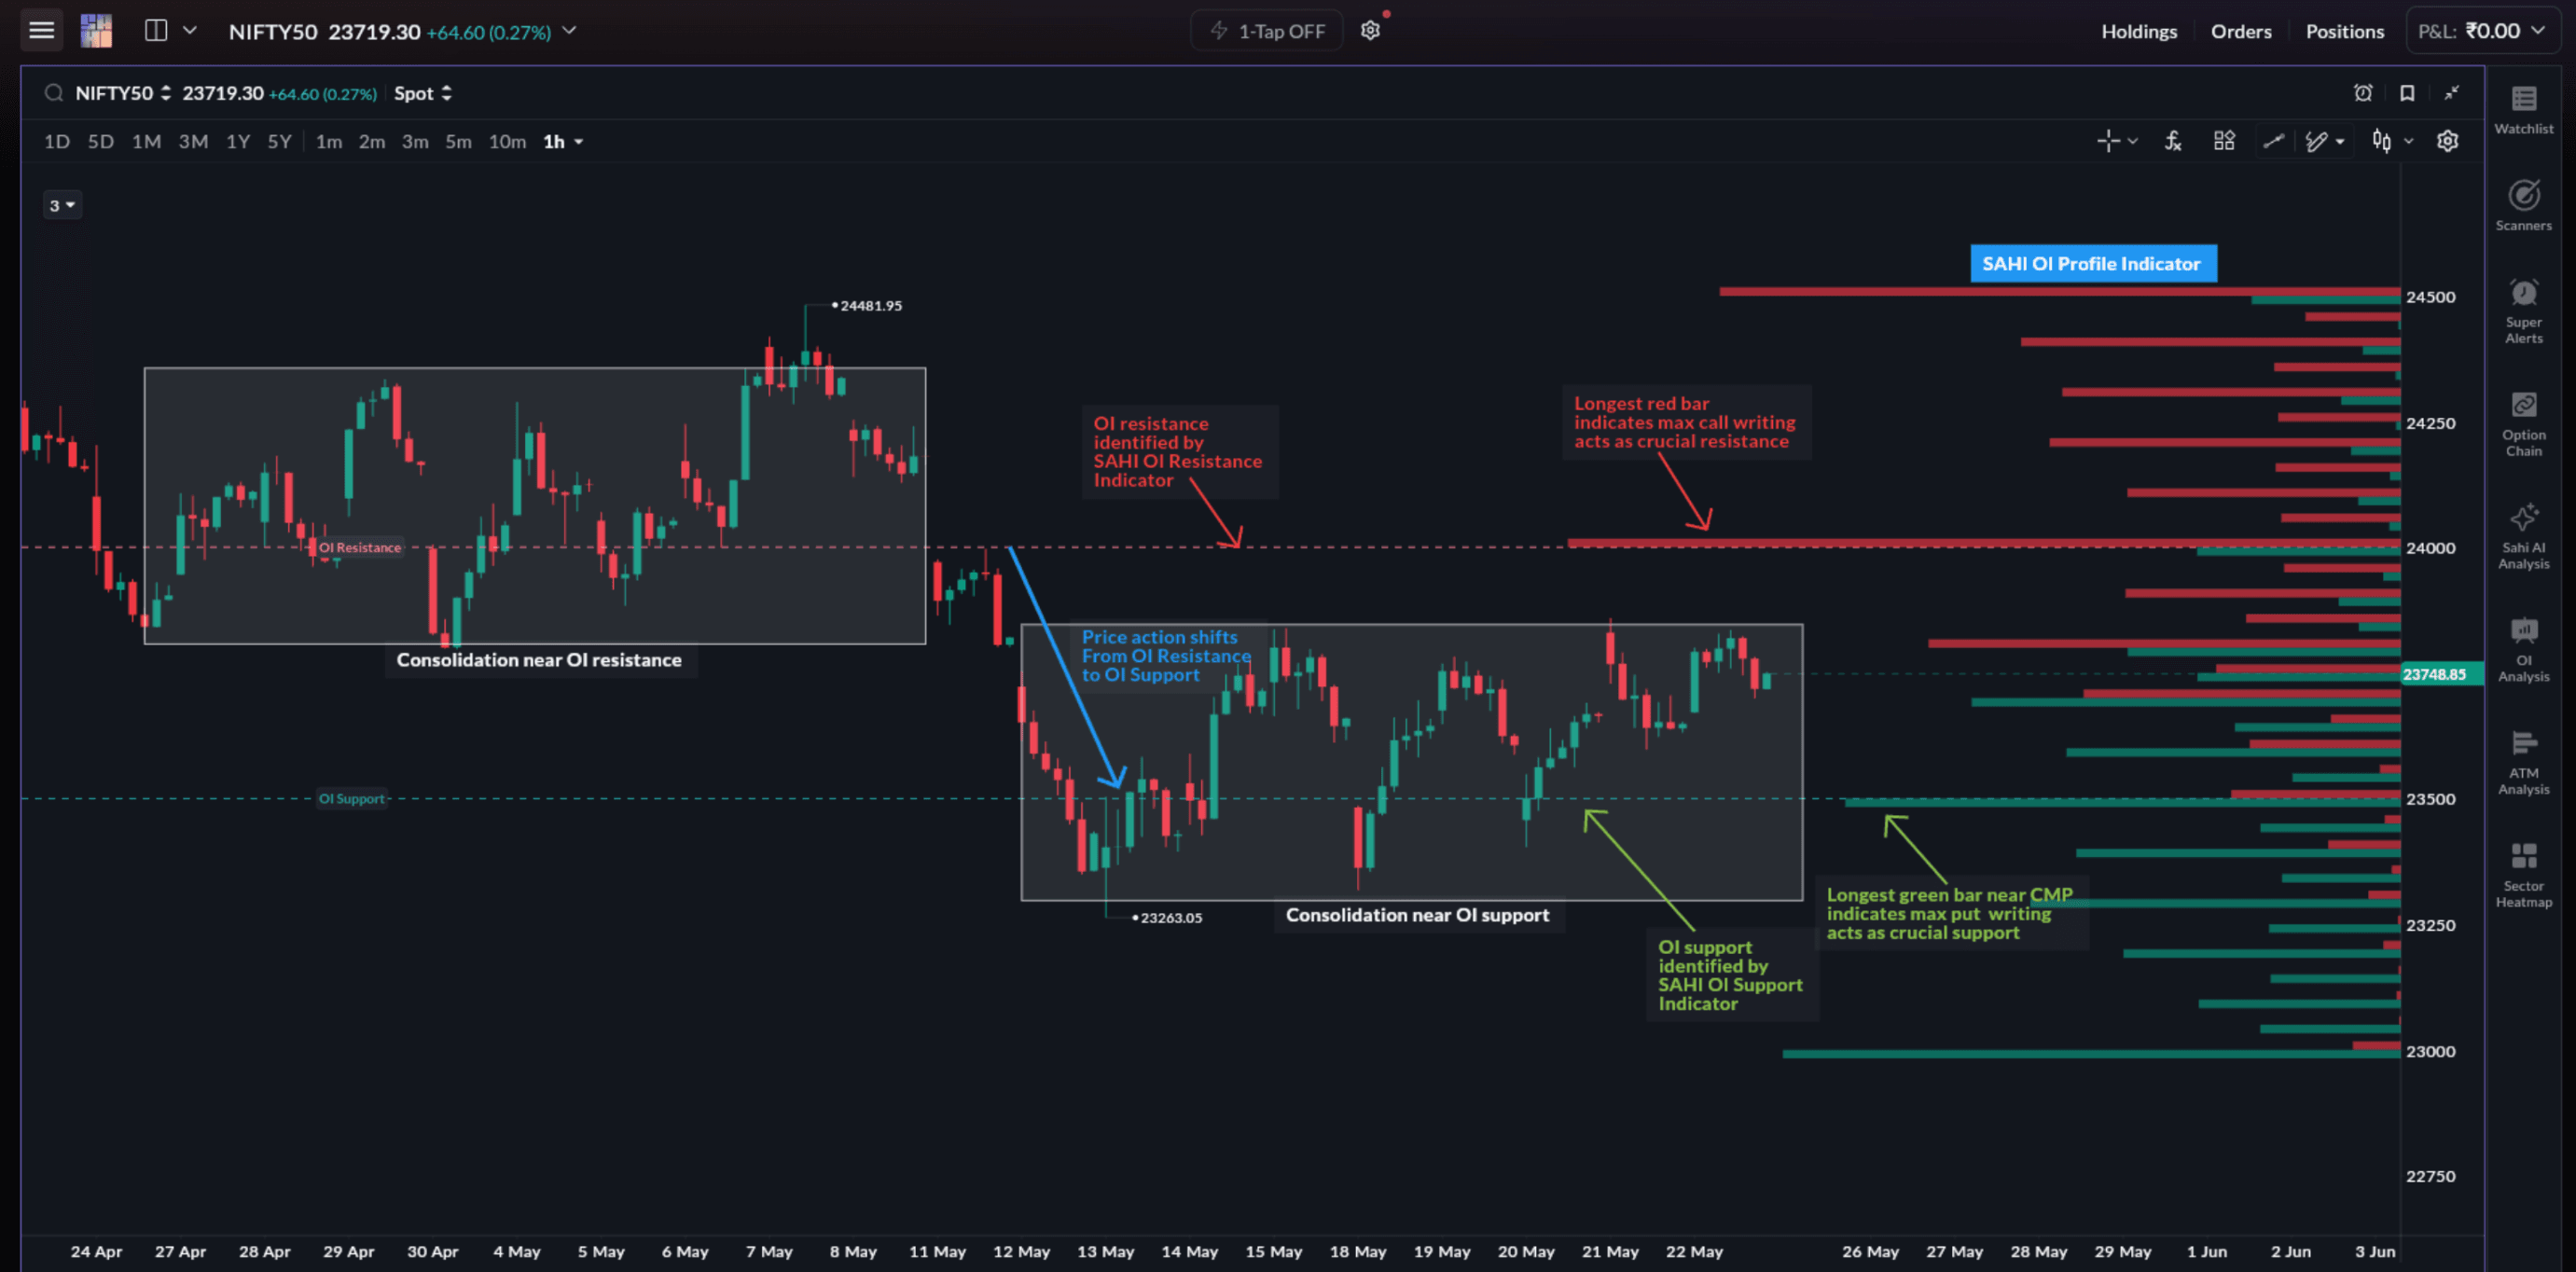
Large institutional positioning often creates strong support and resistance zones around specific strikes.
Heavy CE OI as resistance
A large concentration of Call Option (CE) OI usually acts as resistance.
Since large option writers have sold calls at this strike, upward movement often slows as price approaches the zone.
Heavy PE OI as support
A large cluster of Put Option (PE) OI usually acts as support.
Option writers who sold these puts generally prefer the index to remain above that level.
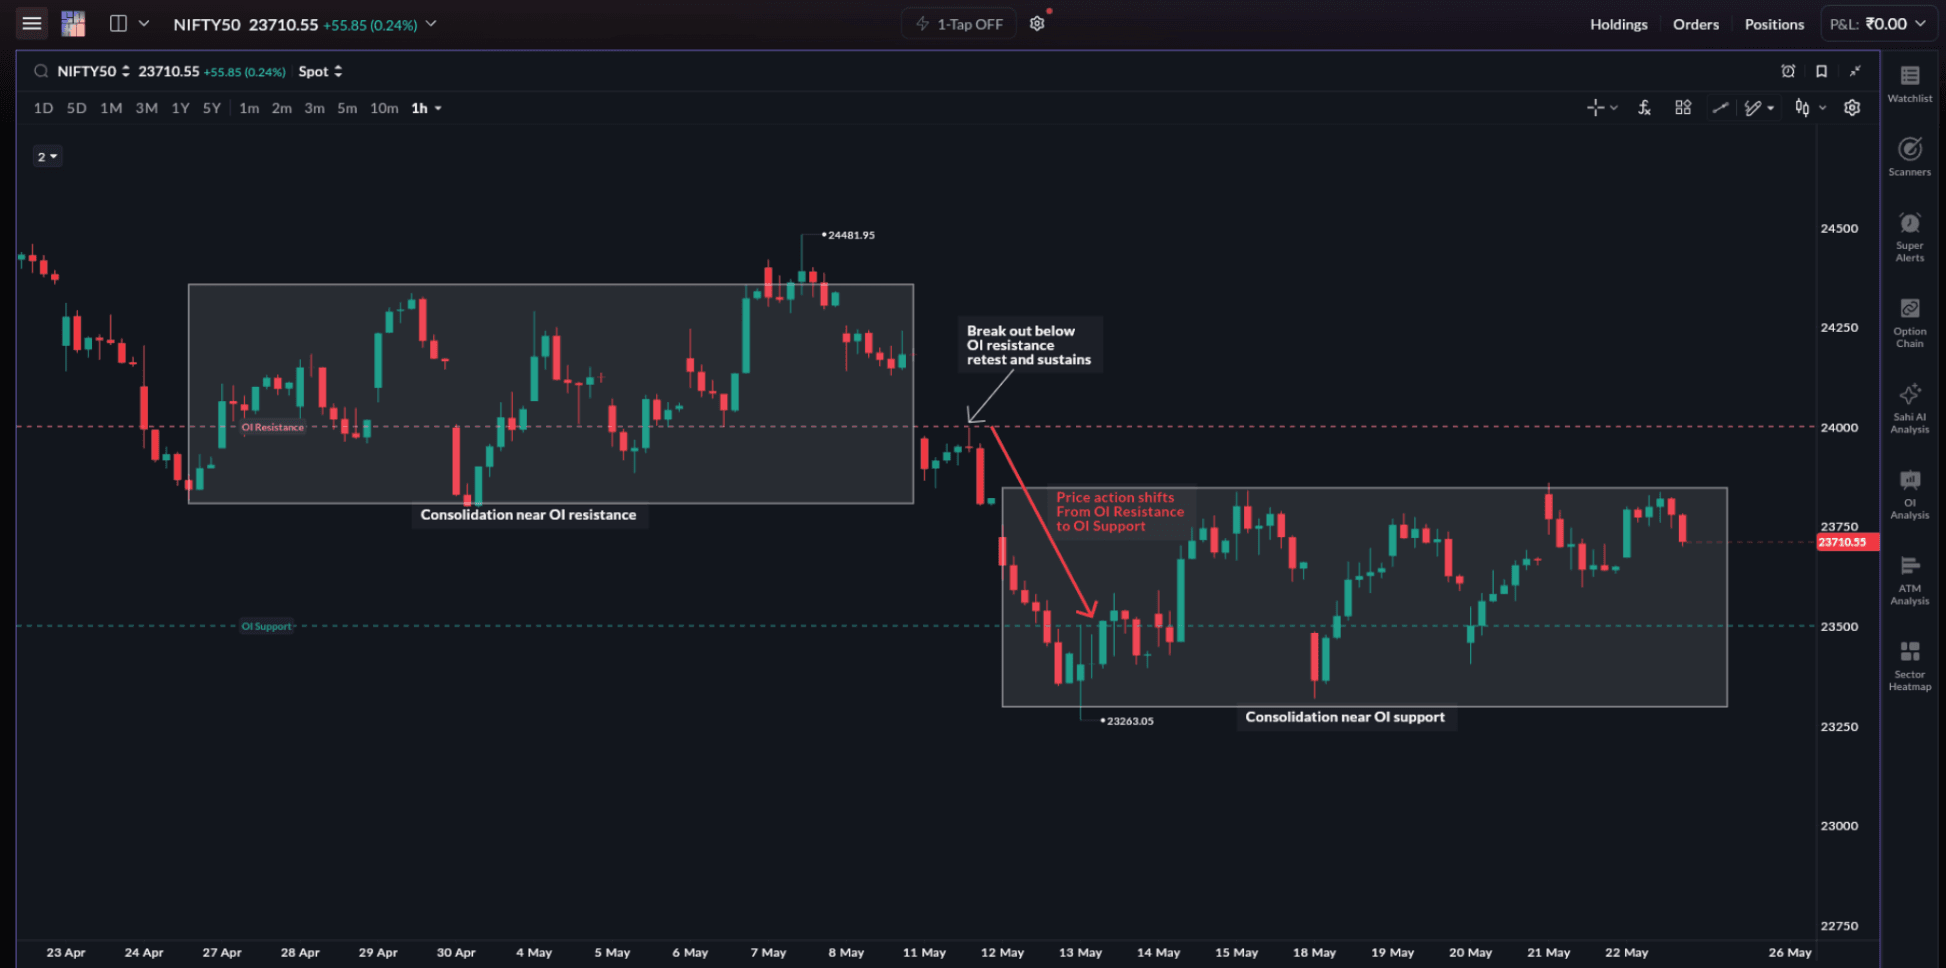
OI shifting during breakout/breakdown
Static levels only tell part of the story.
If price approaches a heavy Call OI resistance level and those Call OI positions begin reducing while fresh Put OI builds underneath, it suggests traders are repositioning around the new price zone.
This often improves breakout strength.
How traders use this
Identifying reaction zones: Traders monitor these areas to identify where price is likely to slow down or react.
Avoiding entries into heavy positioning: Scalpers avoid buying directly into large Call OI resistance or selling into strong Put OI support without confirmation.
Spotting momentum shifts: Watching real-time OI expansion or unwinding near these zones helps distinguish stronger breakouts from weaker moves.
Market Structure and Key Levels
While options data tracks derivatives positioning, market structure tracks how price has historically reacted around important zones.
On SAHI, this process is simplified through the SAHI Key Levels Indicator, which automatically highlights important reaction zones directly on the chart.
Key levels influence
- Reversals: They often mark areas where supply or demand becomes active again.
- Breakout behaviour: They help identify where strong moves may begin after price crosses an important boundary.
- Stop-loss placement: They provide clearer structural zones for placing stop-losses.
- Momentum continuation: A clean breakout and hold above a key level often supports continuation in momentum.
Focus on
- Previous day high/low: Important psychological and structural reference points.
- Intraday swing zones: Areas where price previously reversed during the session.
- Round numbers: Levels like Nifty 24,000 or 24,500 where orders naturally cluster.
- Supply-demand areas: Consolidation zones where strong buying or selling activity previously occurred.
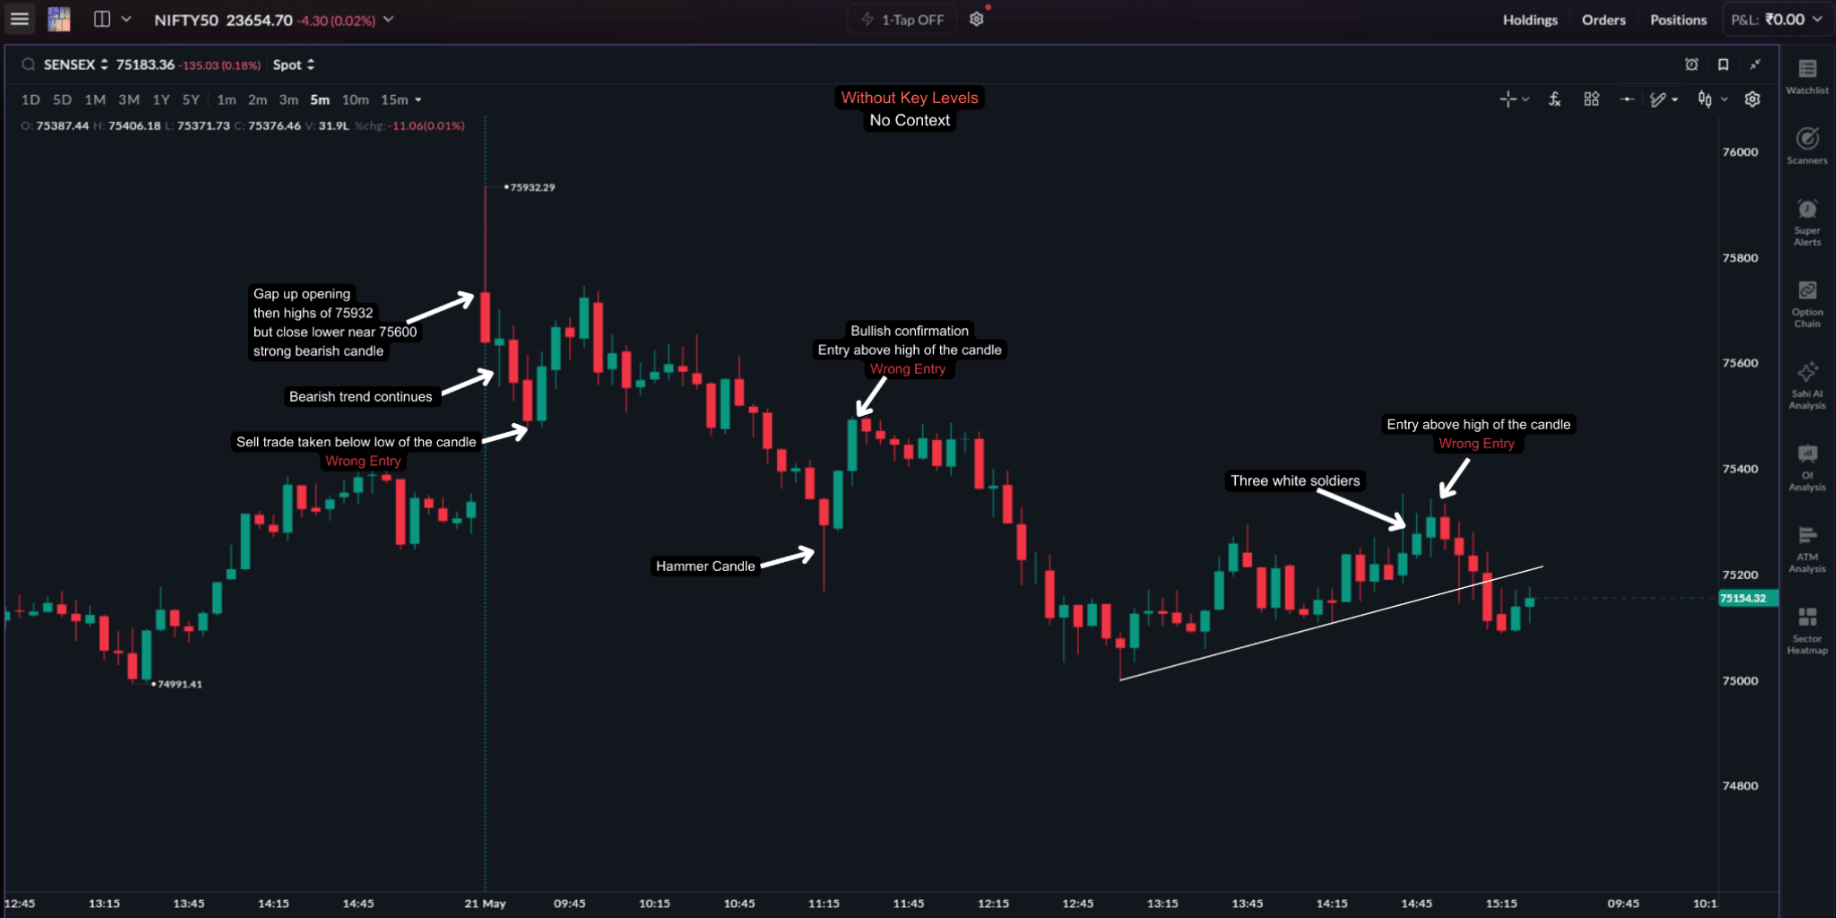
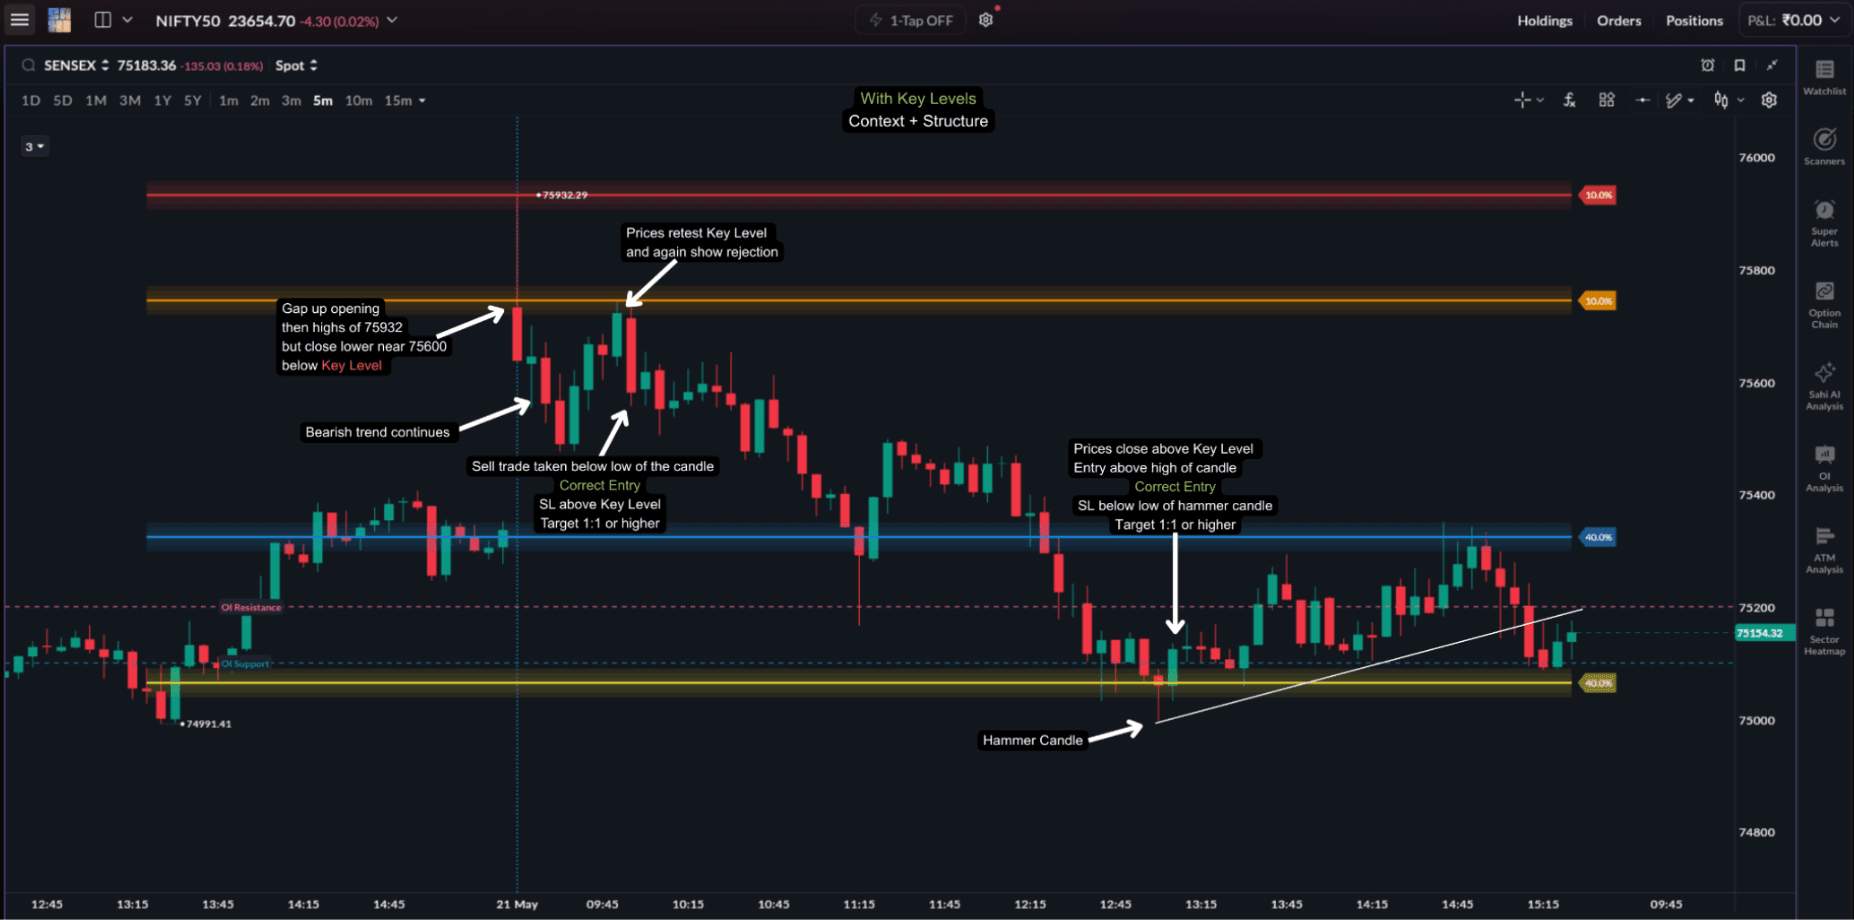
In practice, traders usually use these levels to:
- Plan entries before price arrives
- Avoid random mid-range trades
- Place stop-losses more logically
- Identify where breakout confirmation matters most
Even when levels and positioning are correct, trades can still behave very differently depending on the speed and intensity of market movement.
Execution conditions begin changing once volatility expands or slows down.
Volatility and Premium Behaviour
Volatility plays an important role in how option premiums behave.
In scalping, traders are not only observing price movement — they are also observing how quickly the premium responds to that movement.
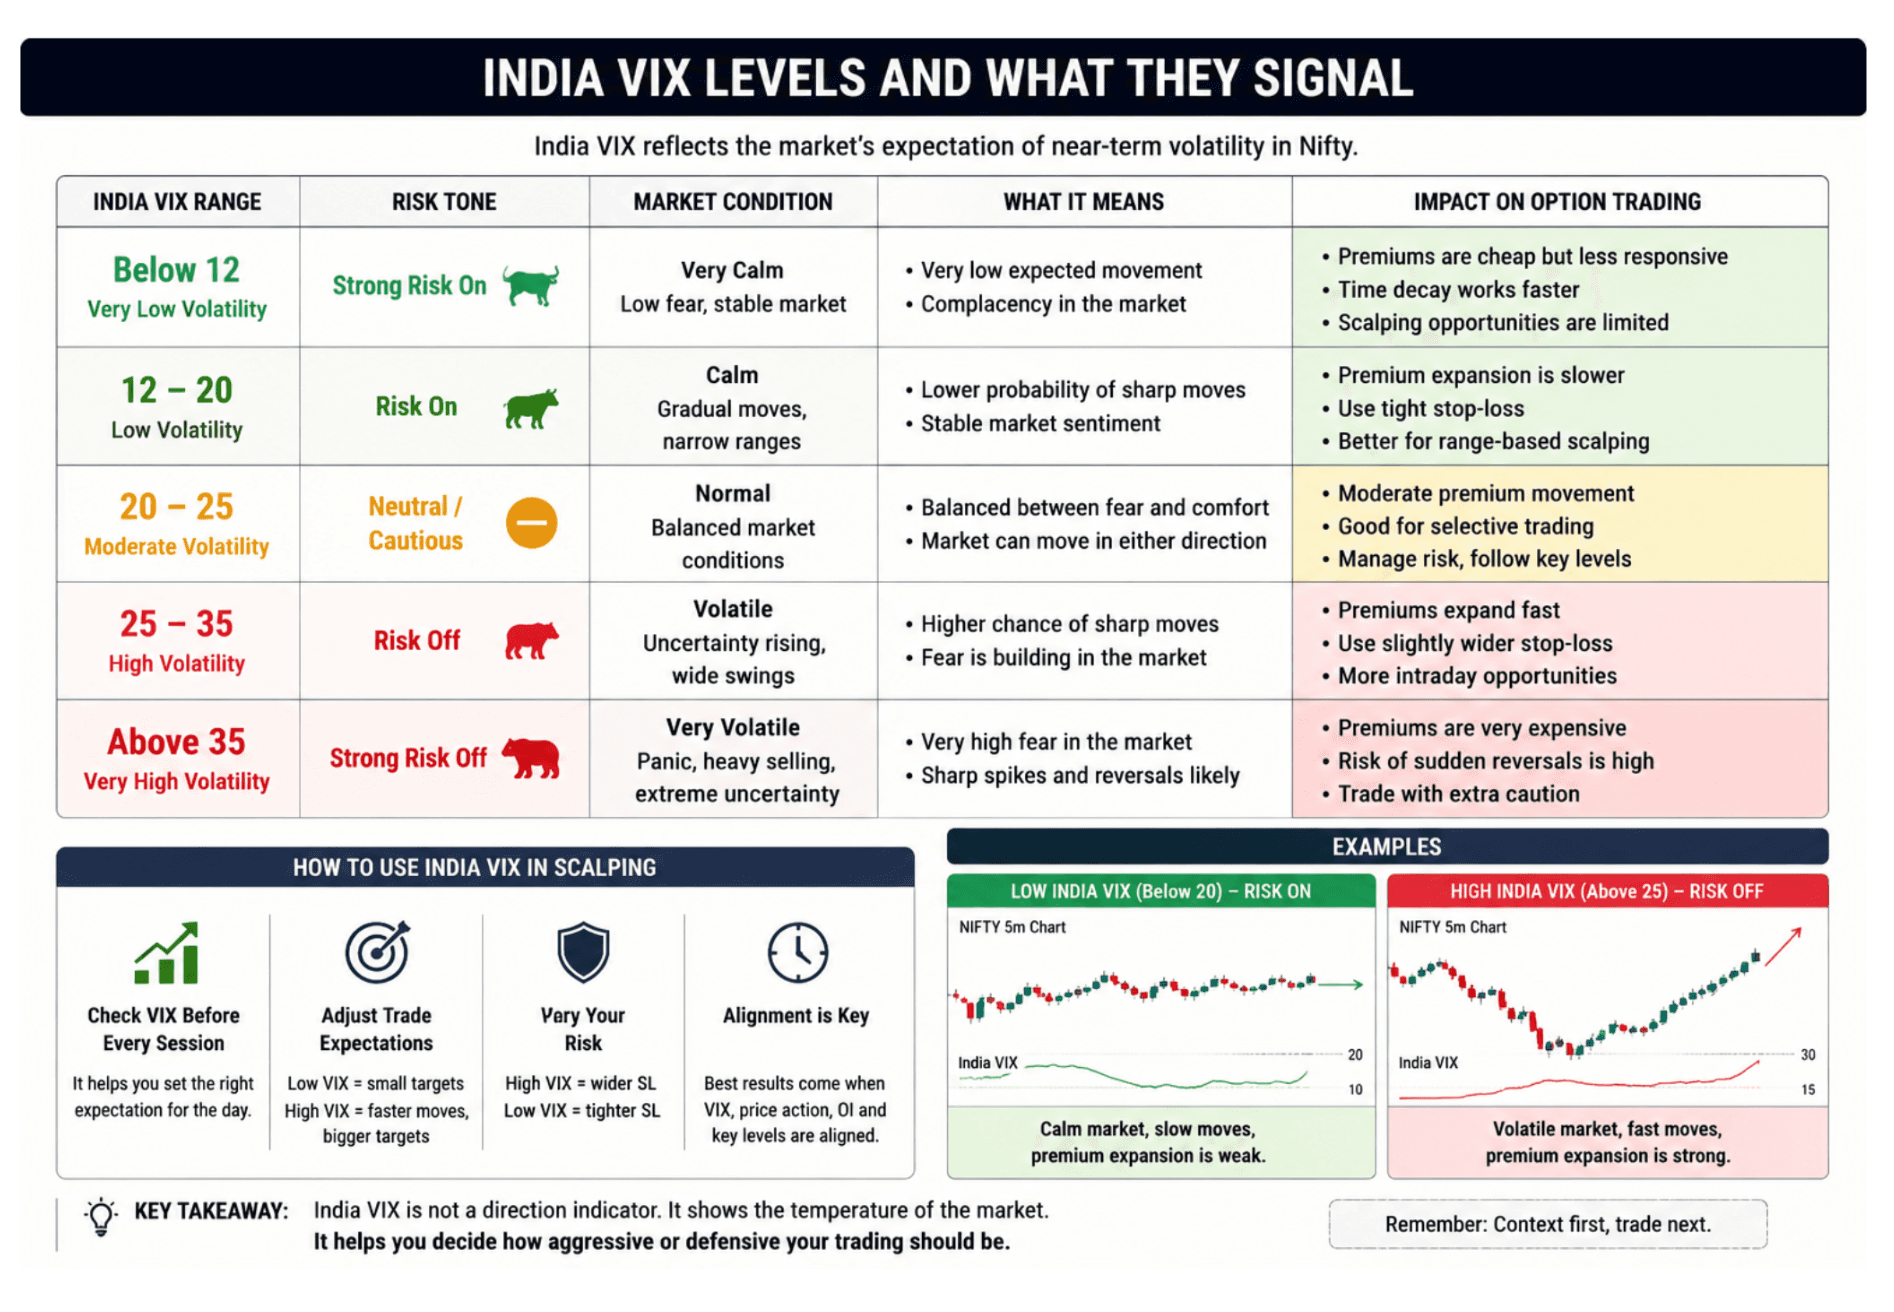
In the Indian market, this is often tracked through India VIX, which reflects the market’s expectation of near-term volatility.
While India VIX does not indicate direction, it helps traders estimate how fast or slow market conditions may be.
Changes in volatility directly affect:
- Premium responsiveness: Higher volatility usually causes option premiums to expand more aggressively, while lower volatility leads to slower premium movement.
- Movement speed: Volatility affects how quickly price covers distance and how fast scalp targets may be reached.
- Stop-loss behaviour: High-volatility conditions often require slightly wider stop-losses, while lower volatility may allow tighter placement.
- Holding conditions: Fast markets usually require quicker exits, while slower markets increase exposure to Theta decay.
Low Volatility
When India VIX is relatively low, markets often show:
- Slower movement
- Narrower intraday ranges
- Weaker premium expansion
Even when price moves correctly, slower momentum may limit premium growth and allow Theta decay to reduce profits.
This usually calls for:
- Realistic targets
- Tighter execution
- Patience
High Volatility
When India VIX rises, markets often show:
- Larger price swings
- Wider candles
- Sharper directional moves
Option premiums usually respond more aggressively, creating faster opportunities — but also faster reversals.
This usually requires:
- Quicker execution
- Tighter trade management
- Greater discipline with exits
For a scalper, India VIX helps answer an important question: how aggressive or cautious should today’s trading approach be?

Volatility affects not only price movement, but also the behaviour of option premiums themselves.
This is where Vega becomes important.
Vega explains how changes in implied volatility affect option premiums.
Even if price stays relatively stable:
- Rising IV can increase premium value: As Implied Volatility (IV) rises, the expected future price range widens, increasing the premium value of both Calls and Puts.
- Falling IV can reduce premium value: When uncertainty reduces, IV falls and option premiums begin losing value, even without major price movement.
Understanding Vega with a Simple Example
Assume Nifty is trading at 24,000.
In a calm market, traders may expect Nifty to stay within a relatively narrow range: 23,900 to 24,100.
Since the expected movement is limited:
- Option premiums remain moderate
- Implied volatility stays lower
Now imagine uncertainty suddenly increases due to an RBI policy announcement or major global event.
The market now expects Nifty to move within a much wider range: 23,600 to 24,400.
Even though Nifty is still trading at 24,000, expectations have changed.
This means:
- Both Calls and Puts become more valuable
- Option premiums begin increasing
- Implied volatility rises
Why?
Because larger expected movement increases the probability of more option strikes moving in-the-money.
For example:
- Put writers at 23,800 may become uncomfortable about a sharp downside move
- Call writers at 24,200 may also become cautious about a stronger upside move
As both sides begin pricing this uncertainty, premiums rise.
This increase in premium caused by rising IV is what Vega captures.
Price has not moved. Expectation has changed. Premium still increases. That is Vega.
Most visible during
- Expiry sessions: Premium fluctuations become faster as expiry approaches and volatility shifts quickly.
- RBI policy days: Major macro announcements often trigger sudden volatility expansion and contraction.
- Event-based volatility: Budgets, earnings, and major global events create temporary uncertainty that impacts option premiums.
Combining Context Together
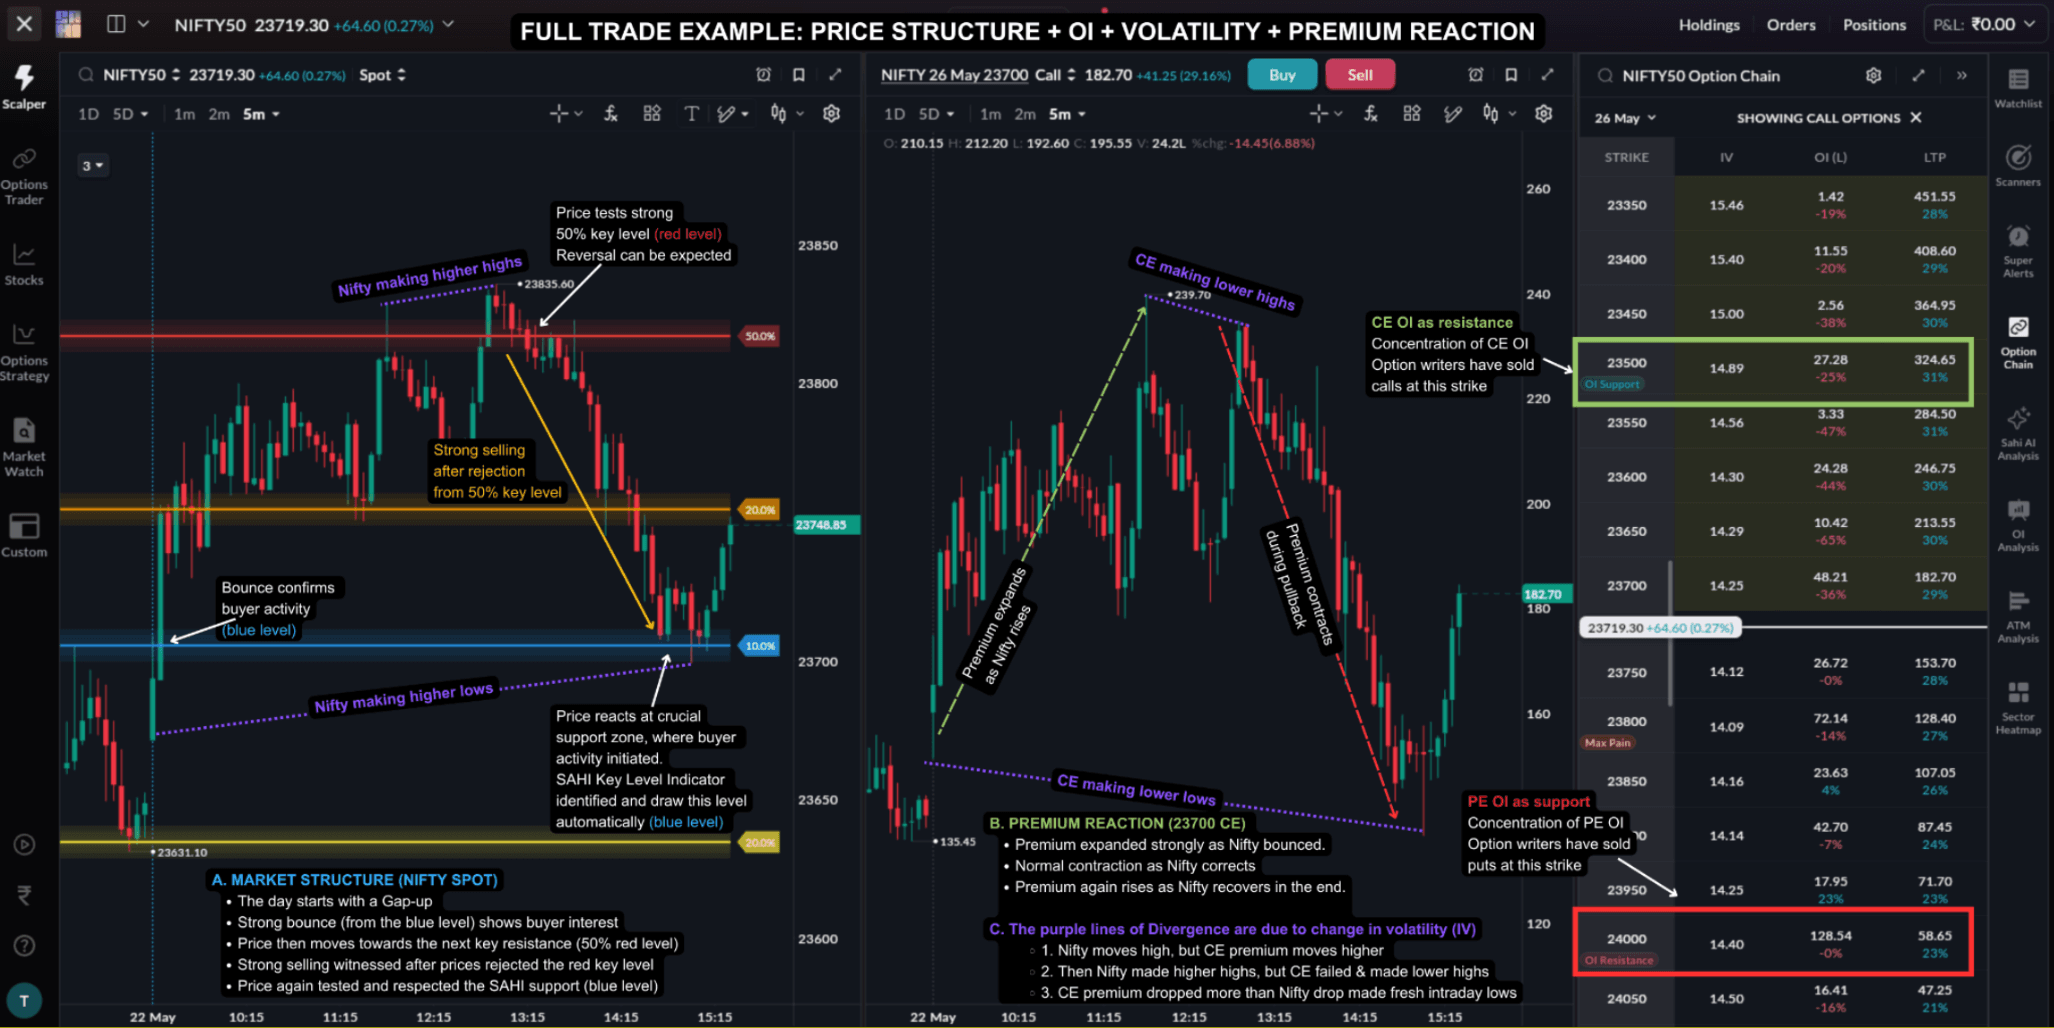
The strongest scalp setups usually happen when multiple conditions align together.
Strong scalping conditions generally involve alignment between:
- Price structure: An important chart level or SAHI Key Level becomes active.
- OI positioning: Heavy Put or Call OI concentration aligns near that price zone.
- Volatility behaviour: Volatility begins expanding as buyers and sellers become active around the level.
- Premium reaction: Option premiums start responding more aggressively after confirmation.
Example
- Breakout above resistance: The index breaks above an important intraday resistance level.
- Fresh OI build-up: Fresh buyers enter while short positions begin reducing.
- Rising volatility: Volatility expands as momentum increases.
- Premium expansion: Call option premiums begin expanding more quickly, creating a cleaner execution window.
Common Mistakes While Reading Market Context
- Trading directly into strong OI zones: Buying directly into heavy Call OI resistance or selling into strong Put OI support without confirmation.
- Ignoring volatility conditions: Using aggressive momentum strategies during flat, low-volatility sessions.
- Treating every level equally: Drawing too many random levels instead of focusing on stronger structural zones.
- Focusing on single data points without confirmation: Entering immediately after price touches a level without waiting for confirmation.
- Forcing trades in low-momentum environments: Taking trades in the middle of flat ranges with poor structure and weak follow-through.
Transition to Next Chapter
Market context helps explain where reactions and momentum are likely to develop.
The next step is execution — using indicators and trading tools like EMA, VWAP, RSI, and Bollinger Bands to time entries and manage scalp trades more effectively.
Test yourself
You have covered OI positioning, key levels, volatility conditions, and Vega. Check how well market context has landed before moving on to execution indicators.
Scalping knowledge check
Can you read the market’s context?
Five quick questions on open interest, OI-based levels, India VIX, and Vega. See where you stand and pick up an insight along the way.
 5 questionsUnder 5 minutes
 Instant score