
Using Indicators (EMA, VWAP, RSI, Bollinger Bands) for Scalping Execution
How scalpers use EMA, VWAP, RSI, Bollinger Bands and ATR to read trend, momentum, volatility and participation during live execution.
 12 minutes read|
Scalping decisions happen quickly. Traders often have only a few seconds to decide whether momentum is building, weakening, or failing completely. Indicators help simplify these decisions by providing structure around trend, momentum, volatility, and participation. This chapter focuses on how commonly used indicators like EMA, VWAP, RSI, Bollinger Bands, and ATR are used during live scalping conditions.
Why Indicators Matter
Indicators are often misunderstood as prediction tools. In reality, indicators do not predict market direction. They help traders organise information around:
- trend
- momentum
- volatility
- execution timing
In scalping, decisions happen quickly. Traders often have only a few seconds to evaluate momentum, identify risk, and execute trades. This is where indicators become useful.
A good indicator setup should quickly help traders understand trend, momentum, volatility, and whether participation is supporting the move.

The objective is not to use more indicators. It is to use a few indicators that improve execution clarity.
The Instrument Cluster Analogy
Think of indicators like the instrument cluster in a car. Each gauge gives you a different type of information. Now let’s think about it from a stock market perspective.
- Speedometer → Momentum (RSI): shows how strong or weak momentum currently is.
- RPM meter → Volatility (Bollinger Bands / ATR): shows how aggressively the market is moving.
- Fuel gauge → Participation (VWAP / OI): shows whether enough volume and positioning support the move.
No single gauge is enough by itself. Traders read them together to understand what the market is doing. Price action, order flow, and buying or selling pressure still remain the real drivers.
Three Rules While Using Indicators
- Keep the setup simple. Too many indicators create conflicting signals and slower decision-making.
- Indicators do not guarantee outcomes. Indicators provide structure and confirmation, not certainty.
- Price remains the final authority. If indicators suggest strength but price structure breaks down, price matters more.
EMA: Understanding Short-Term Trend
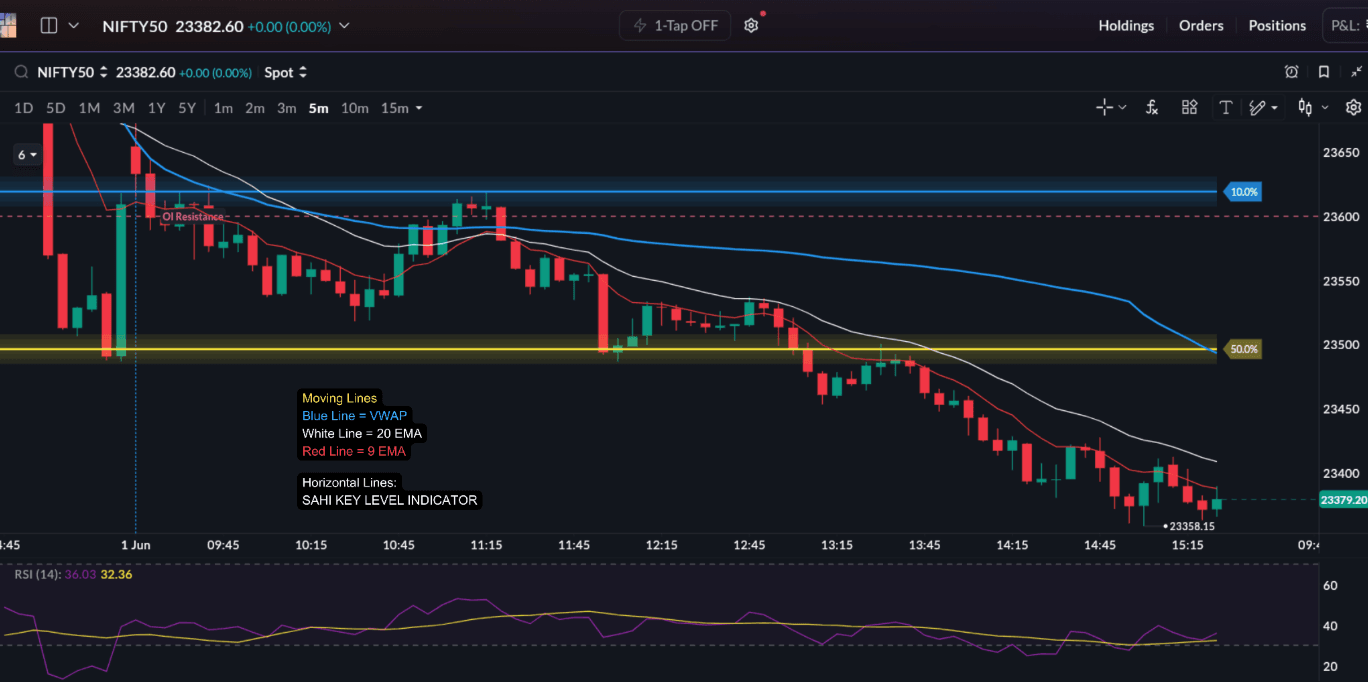
EMA (Exponential Moving Average) is one of the most widely used tools in intraday trading. Unlike a simple moving average, EMA reacts faster to recent price movement, making it more suitable for short-term execution.
For scalpers, EMA mainly helps answer one question: is the market currently trending or not? Scalping works best when trades align with momentum. EMA helps traders avoid trading against the prevailing short-term direction.
Most intraday scalpers commonly use:
- 9 EMA
- 20 EMA
Some traders also use the 50 EMA to understand broader intraday structure. The exact values matter less than consistency. The goal is not prediction. The goal is understanding short-term trend behaviour.
EMA as Dynamic Support and Resistance
In trending markets, price often reacts around EMA zones instead of static horizontal levels. This is called dynamic support and resistance because the level keeps moving with price instead of staying fixed at one horizontal zone. As the EMA changes with recent price movement, traders use it as a shifting reference for pullbacks and continuation.
For example:
- during bullish momentum, pullbacks toward the 9 EMA or 20 EMA may attract buyers
- during bearish momentum, rallies into EMA zones may face selling pressure
Strong continuation setups often appear when:
- price pulls back toward EMA
- momentum stabilises
- continuation candles appear near the EMA zone
This usually creates cleaner risk-to-reward entries compared to chasing extended candles.
EMA Alignment
EMA alignment helps traders filter trades in the direction of momentum rather than reacting to every small move.
| EMA Alignment | Market Condition | Scalper’s Bias | Actionable Execution |
|---|---|---|---|
| 9 EMA above 20 EMA • Both EMAs slope upward | Strong bullish momentum | Long trades preferred | Buy pullbacks toward the 9 EMA or 20 EMA zone. Avoid aggressive shorting against momentum. |
| 9 EMA below 20 EMA • Both EMAs slope downward | Bearish intraday structure | Short trades preferred | Sell rallies into the 9 EMA or 20 EMA zone. Avoid counter-trend buying setups. |
| EMAs crisscrossing repeatedly • Both EMAs flattening out | Choppy / sideways market | Neutral / no clear bias | Avoid trend-following setups. Either reduce trading activity or shift toward mean reversion conditions. |
EMA Crossovers
Some traders also use EMA crossovers for confirmation. For example:
- short EMA crossing above long EMA may support bullish continuation
- short EMA crossing below long EMA may support bearish continuation
However, EMA crossovers work better as confirmation tools rather than standalone scalp signals.
What to Avoid
- taking every EMA touch as a trade
- blindly following crossovers without price structure
- using EMAs aggressively during sideways conditions
EMA works best when aligned with price structure, key levels, volatility conditions, and OI confirmation.
VWAP: Intraday Fair Value
VWAP (Volume Weighted Average Price) is one of the most important intraday reference levels. It represents the average traded price weighted by volume throughout the session.
Large institutional traders often monitor VWAP closely because it reflects where most trading participation has occurred during the day.
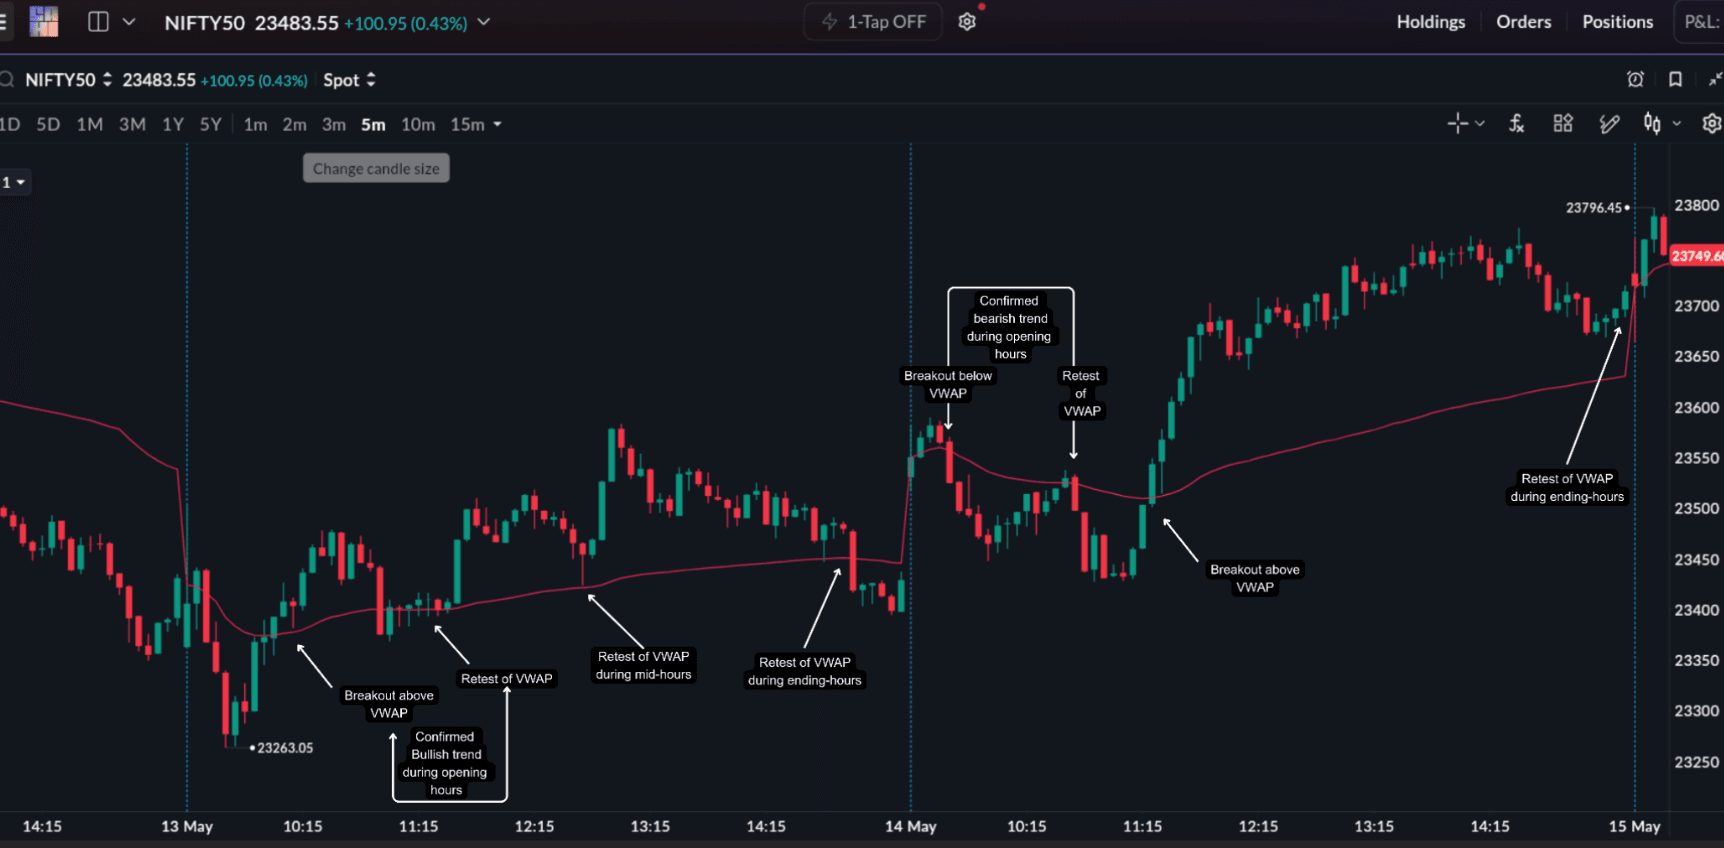
For scalpers, VWAP mainly helps identify:
- intraday directional bias
- strength versus weakness
- participation quality
- mean reversion behaviour
How Traders Read VWAP
Generally:
- price above VWAP reflects stronger intraday structure
- price below VWAP reflects weaker market structure
However, VWAP should not be treated as a standalone buy or sell signal. Its usefulness comes from observing how price behaves around it.
VWAP Reclaim and Rejection
VWAP Reclaim. Price initially trades below VWAP and later reclaims it with momentum. This often suggests improving buyer participation and strengthening intraday momentum.
VWAP Rejection. Price attempts to move above VWAP but repeatedly fails. This may indicate weaker buying pressure and continuation of bearish structure.
Mean Reversion Around VWAP
During low-volatility sessions, price often rotates around VWAP instead of trending aggressively. This creates mean reversion conditions where breakouts frequently fail.
For scalpers, this becomes useful when:
- price stretches too far from VWAP
- momentum begins slowing
- reversal candles appear near extremes
What to Avoid
- blindly buying above VWAP or selling below VWAP
- treating VWAP as a guaranteed reversal point
- ignoring overall market structure
VWAP becomes more reliable when combined with key levels, OI positioning, momentum confirmation, and volatility conditions.
RSI: Measuring Momentum Strength
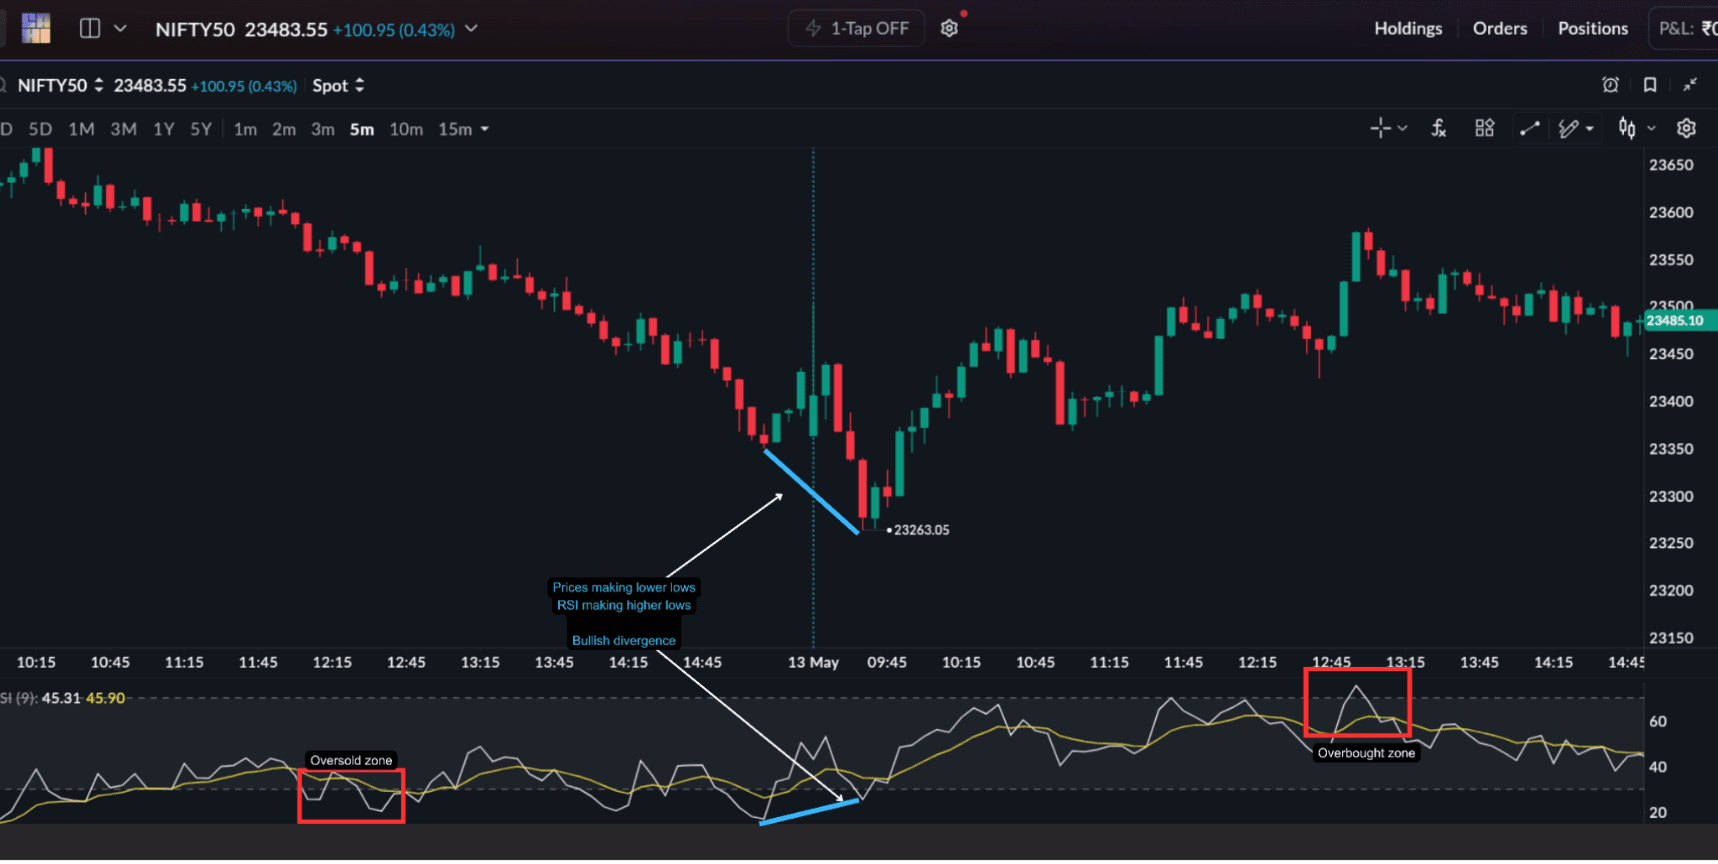
RSI (Relative Strength Index) helps traders evaluate momentum strength and exhaustion conditions. However, RSI is often misunderstood. Many beginners assume:
- overbought = sell
- oversold = buy
In reality, strong trends can remain overbought or oversold for extended periods.
That is why RSI works better as a confirmation tool rather than a standalone reversal signal.
RSI Momentum Behaviour
Generally:
- RSI holding above 60 often reflects bullish continuation
- RSI holding below 40 often reflects bearish continuation
This helps traders understand whether momentum is strengthening or weakening during the move.
RSI Divergence
Divergence occurs when price and RSI move differently.
Bullish divergence. Price makes lower lows while RSI forms higher lows. This may suggest weakening selling momentum and a possible reversal attempt.
Bearish divergence. Price makes higher highs while RSI forms lower highs. This may suggest weakening bullish momentum and possible exhaustion.
Divergence does not guarantee reversal. It simply signals weakening momentum conditions that traders should monitor carefully.
What to Avoid
- treating RSI overbought as an automatic sell signal
- treating RSI oversold as an automatic buy signal
- using RSI without price confirmation
RSI works best alongside price structure, support and resistance, volatility behaviour, and trend confirmation.
Bollinger Bands: Volatility Expansion
Bollinger Bands help traders understand volatility expansion and contraction. The indicator consists of:
- middle moving average
- upper volatility band
- lower volatility band
As volatility increases, the bands expand. As volatility decreases, the bands contract.
For scalpers, Bollinger Bands mainly help identify volatility expansion, squeeze conditions, stretched price movement, and possible breakout environments.
Bollinger Band Squeeze
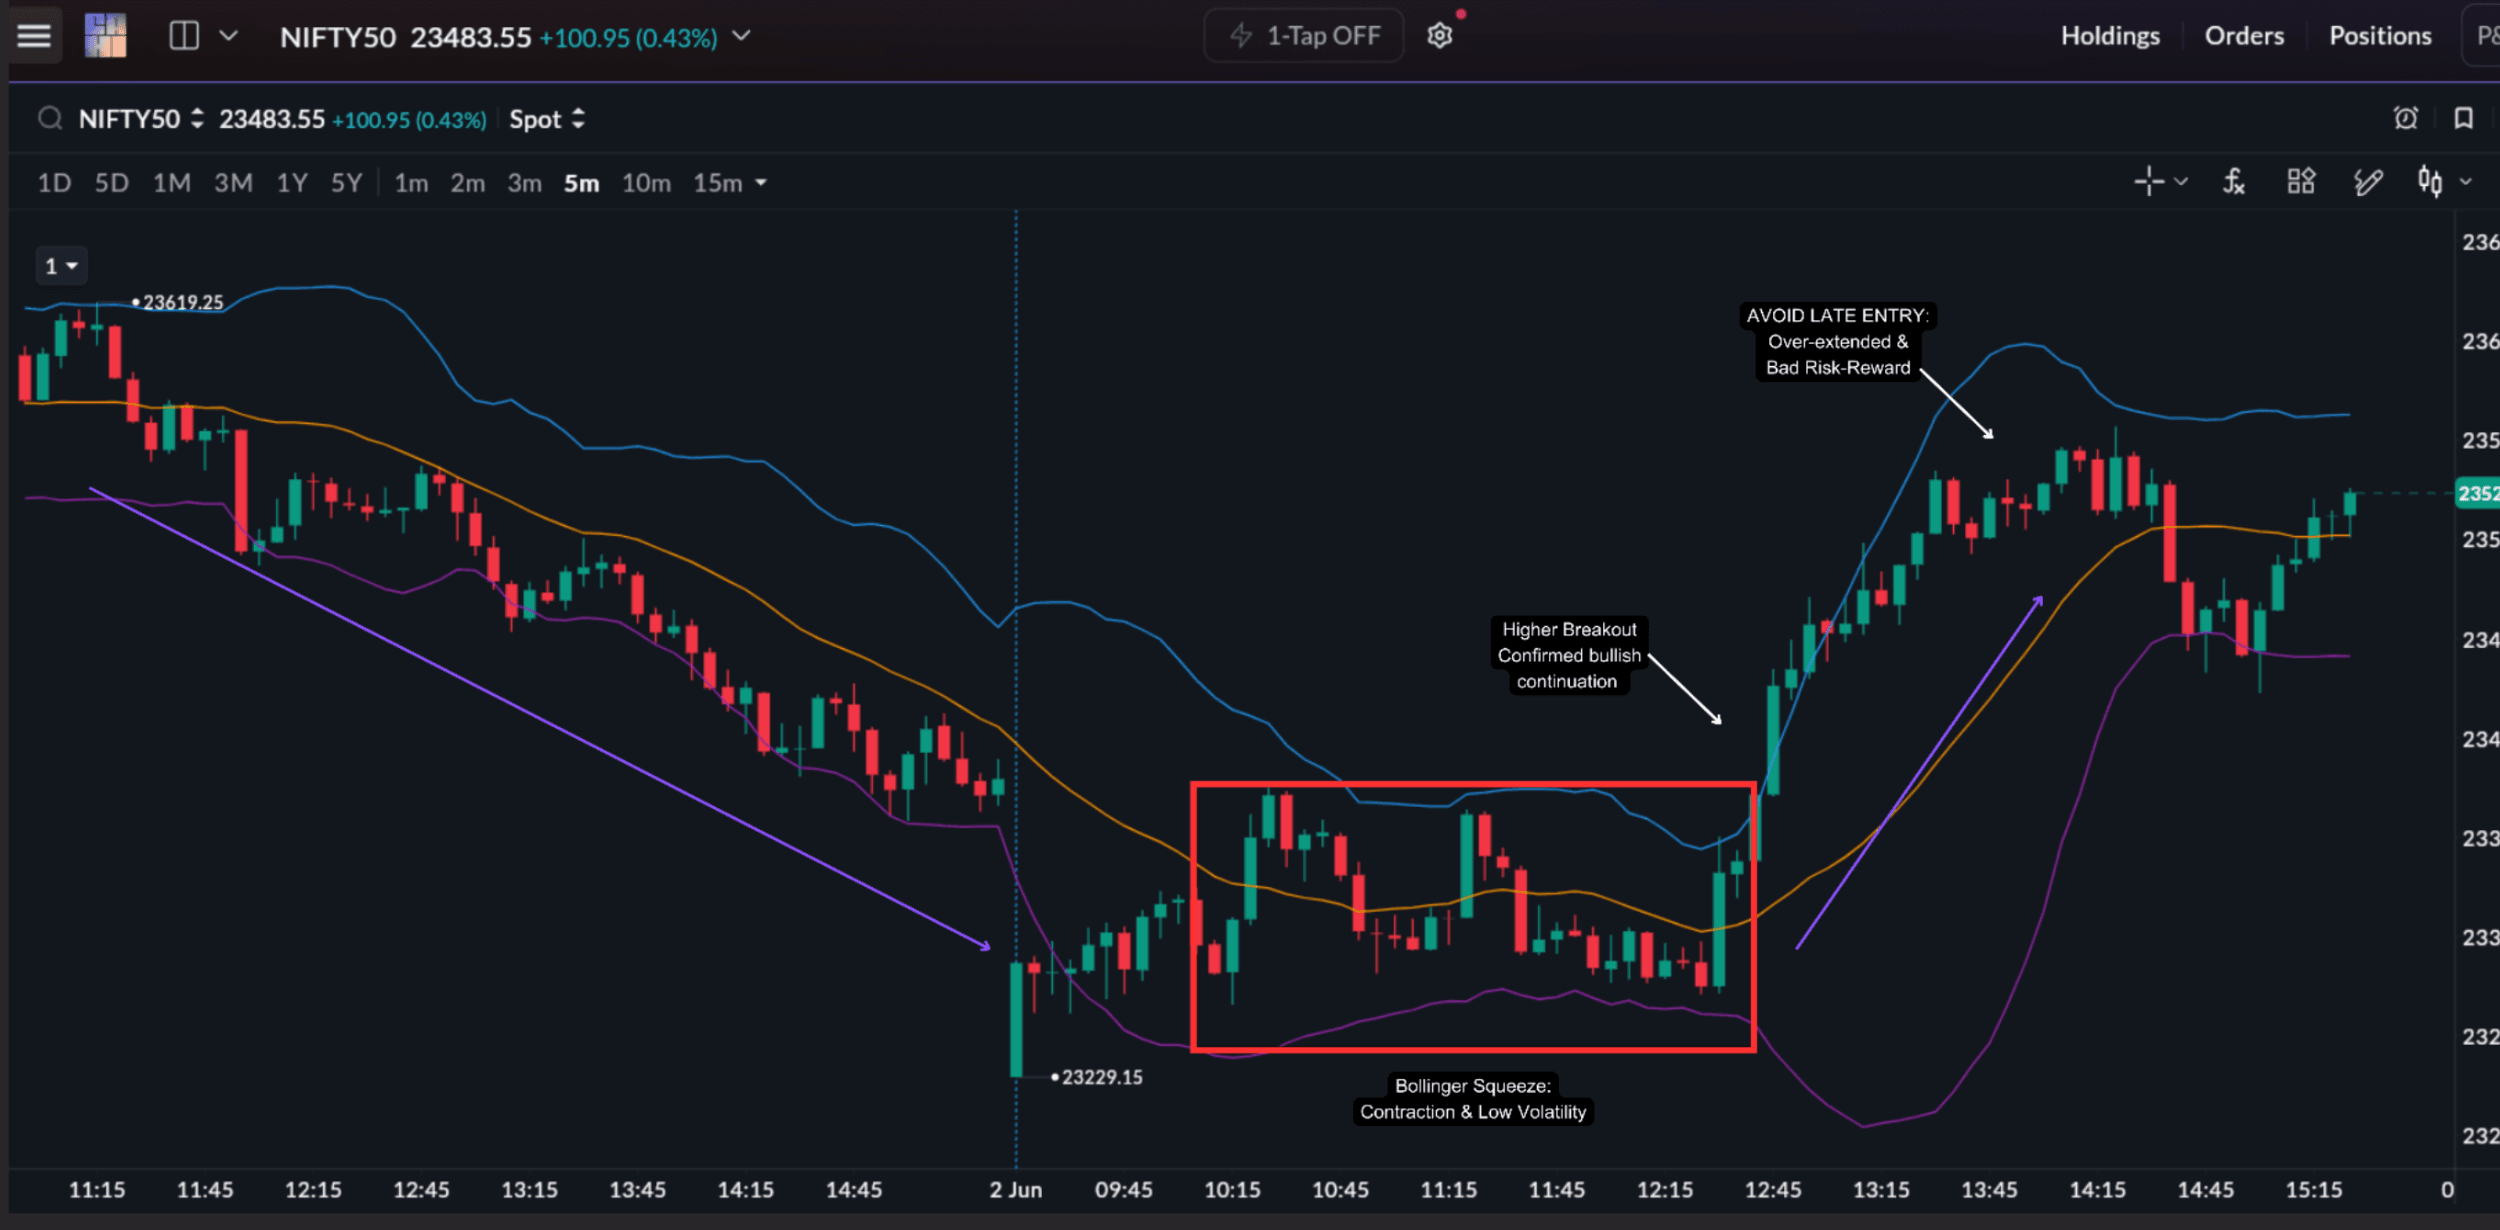
A squeeze occurs when the bands contract tightly and volatility reduces significantly. This usually reflects temporary compression before a larger move develops.
Scalpers monitor squeeze conditions because breakouts after contraction can create strong momentum opportunities. However, direction still requires confirmation.
Volatility Expansion
Once price breaks out of a squeeze:
- candles often become larger
- momentum increases
- premiums may expand more aggressively
Avoiding Late Entries
One common mistake is entering after volatility has already expanded sharply. By that stage:
- premiums may already be inflated
- risk-to-reward deteriorates
- reversals become more dangerous
What to Avoid
- assuming every squeeze leads to breakout
- fading strong trends simply because price touches outer bands
- using Bollinger Bands without market context
Bollinger Bands work best when aligned with support and resistance, OI shifts, volatility behaviour, and momentum confirmation.
ATR: Measuring Movement Range
ATR (Average True Range) measures how much price typically moves during a given period. Unlike RSI or EMA, ATR does not indicate direction. It only measures movement range and volatility.
For scalpers, ATR helps estimate:
- expected movement range
- stop-loss placement
- target sizing
- market aggressiveness
Higher ATR usually suggests larger intraday swings, faster movement, and wider candles.
Lower ATR usually suggests slower movement, tighter ranges, and weaker momentum.
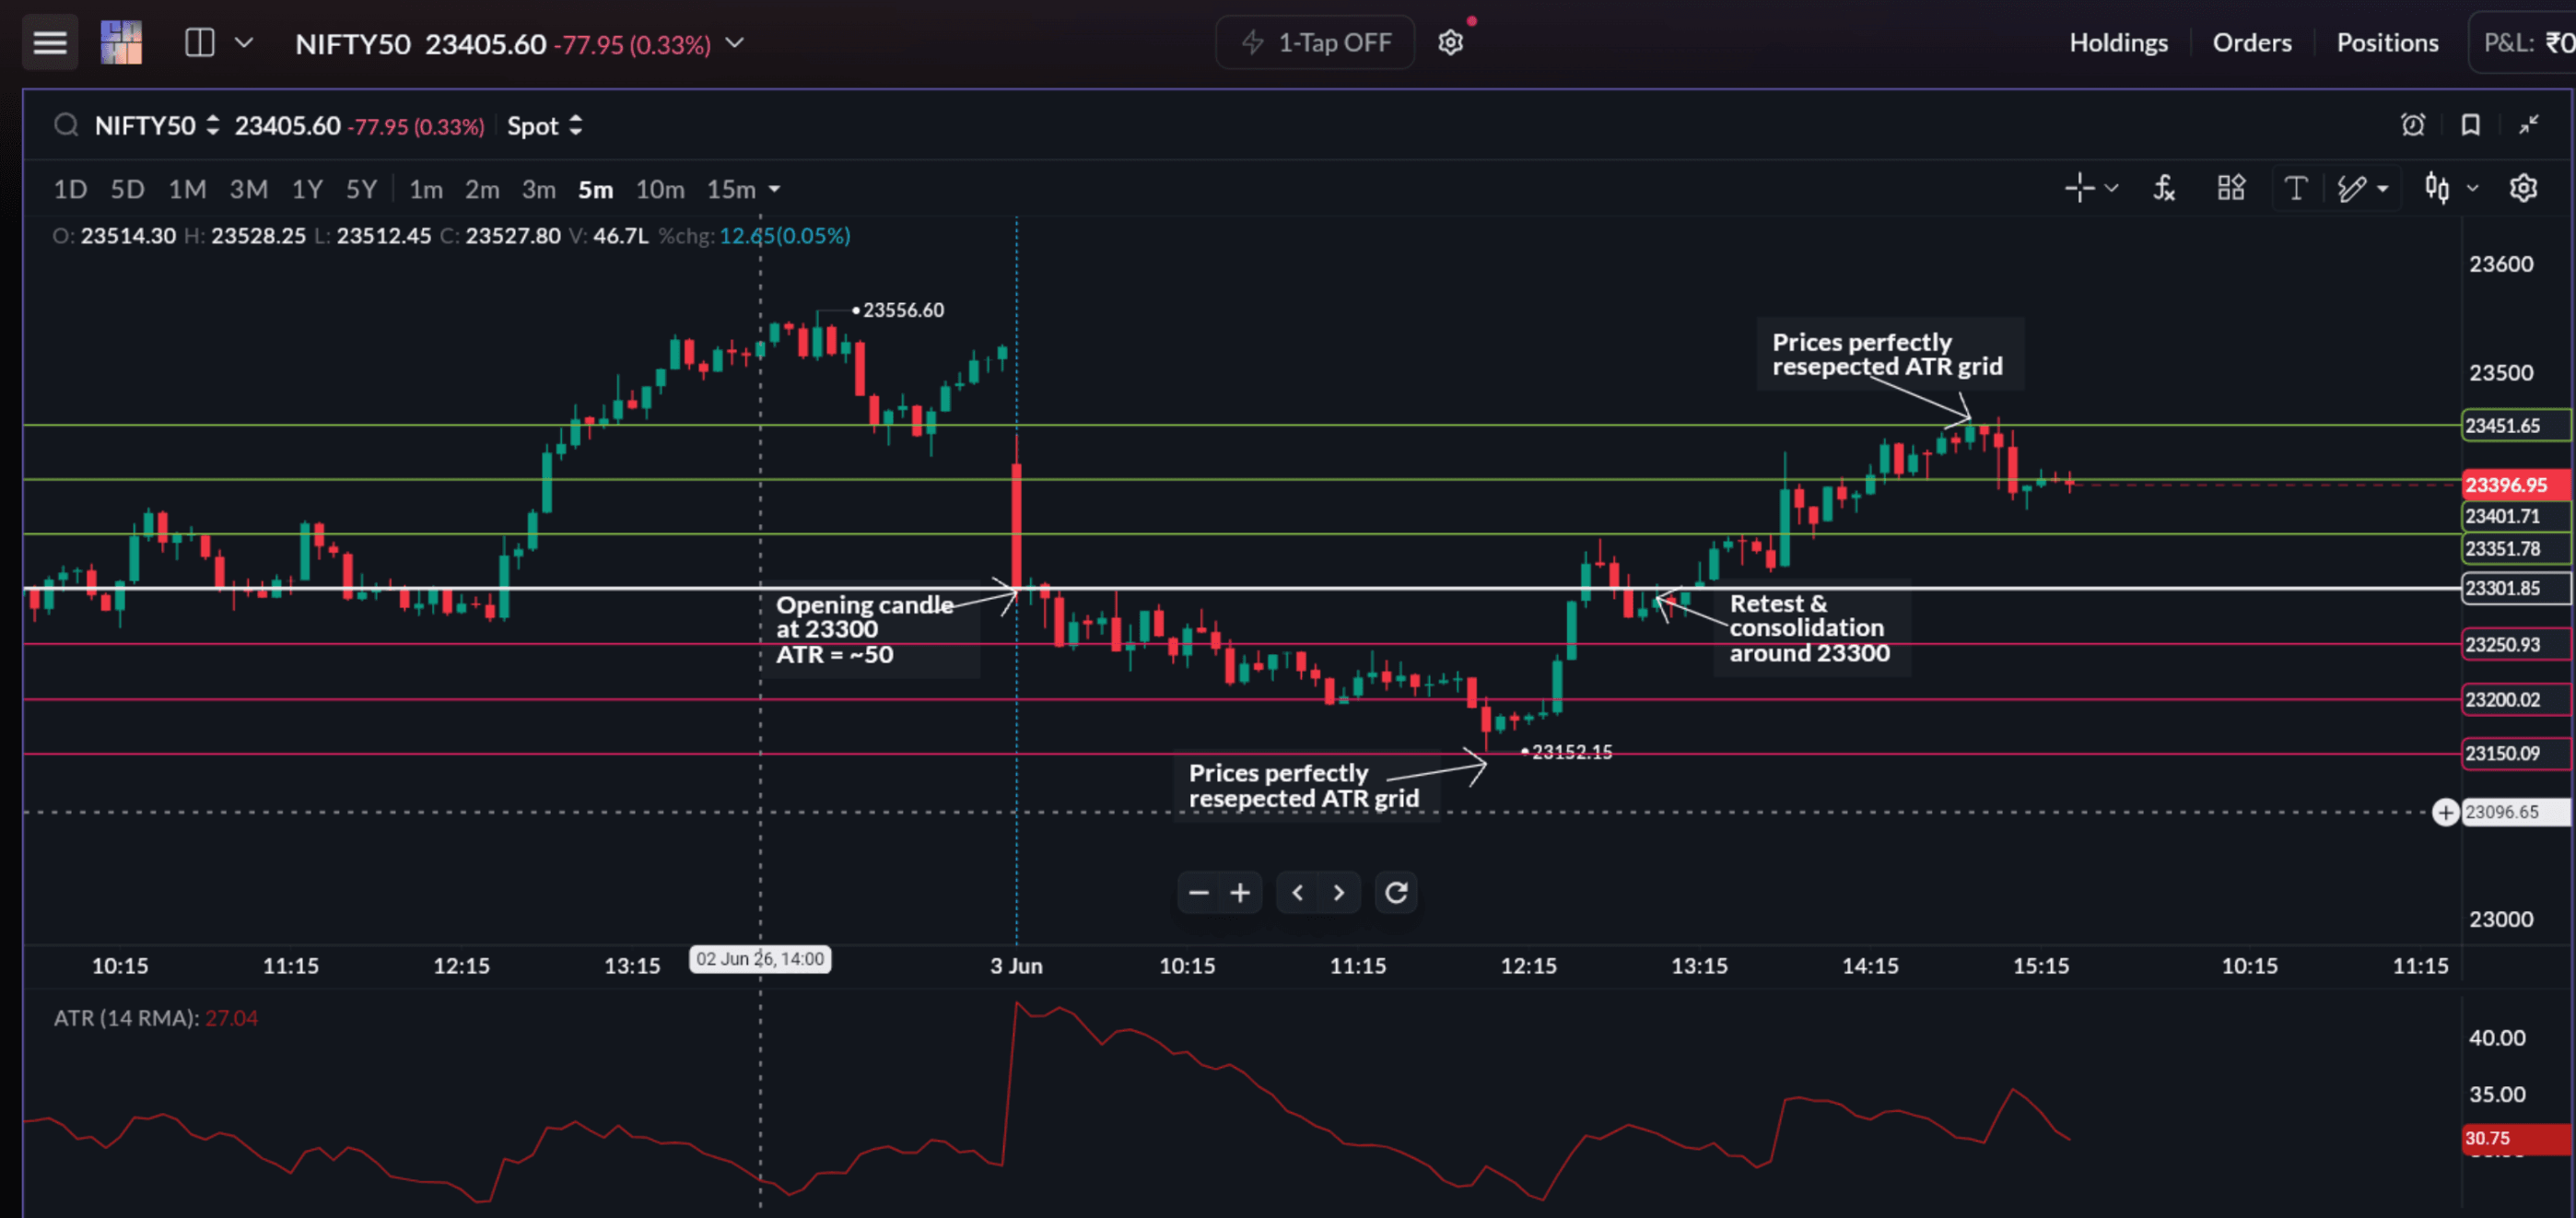
ATR Grids Around Opening Range
Some traders use ATR grids around opening price zones. Common levels include:
- 1.0x ATR
- 1.5x ATR
- 2.0x ATR
These often behave as expansion targets, exhaustion zones, and reaction areas. ATR grids help traders estimate how much movement is statistically reasonable during the session.
What to Avoid
- using identical stop-losses every day
- ignoring changing volatility conditions
- expecting large targets during low ATR sessions
ATR mainly helps traders adapt position management to current market conditions.
Alongside widely used indicators like EMA, VWAP, RSI, Bollinger Bands, and ATR, traders also use platform-specific tools that improve execution by combining structure, positioning, and volatility in one place. On SAHI, these tools are built directly into the charting workflow.
SAHI Proprietary Indicators
SAHI combines price structure, positioning data, and volatility tools into an integrated execution workspace. Instead of switching repeatedly between separate tools, traders can monitor structure, positioning, and momentum directly alongside live price action.
Key Level Indicator
The SAHI Key Level Indicator automatically identifies support zones, resistance zones, breakout areas, and reaction levels. This helps reduce manual chart clutter and drawing bias.
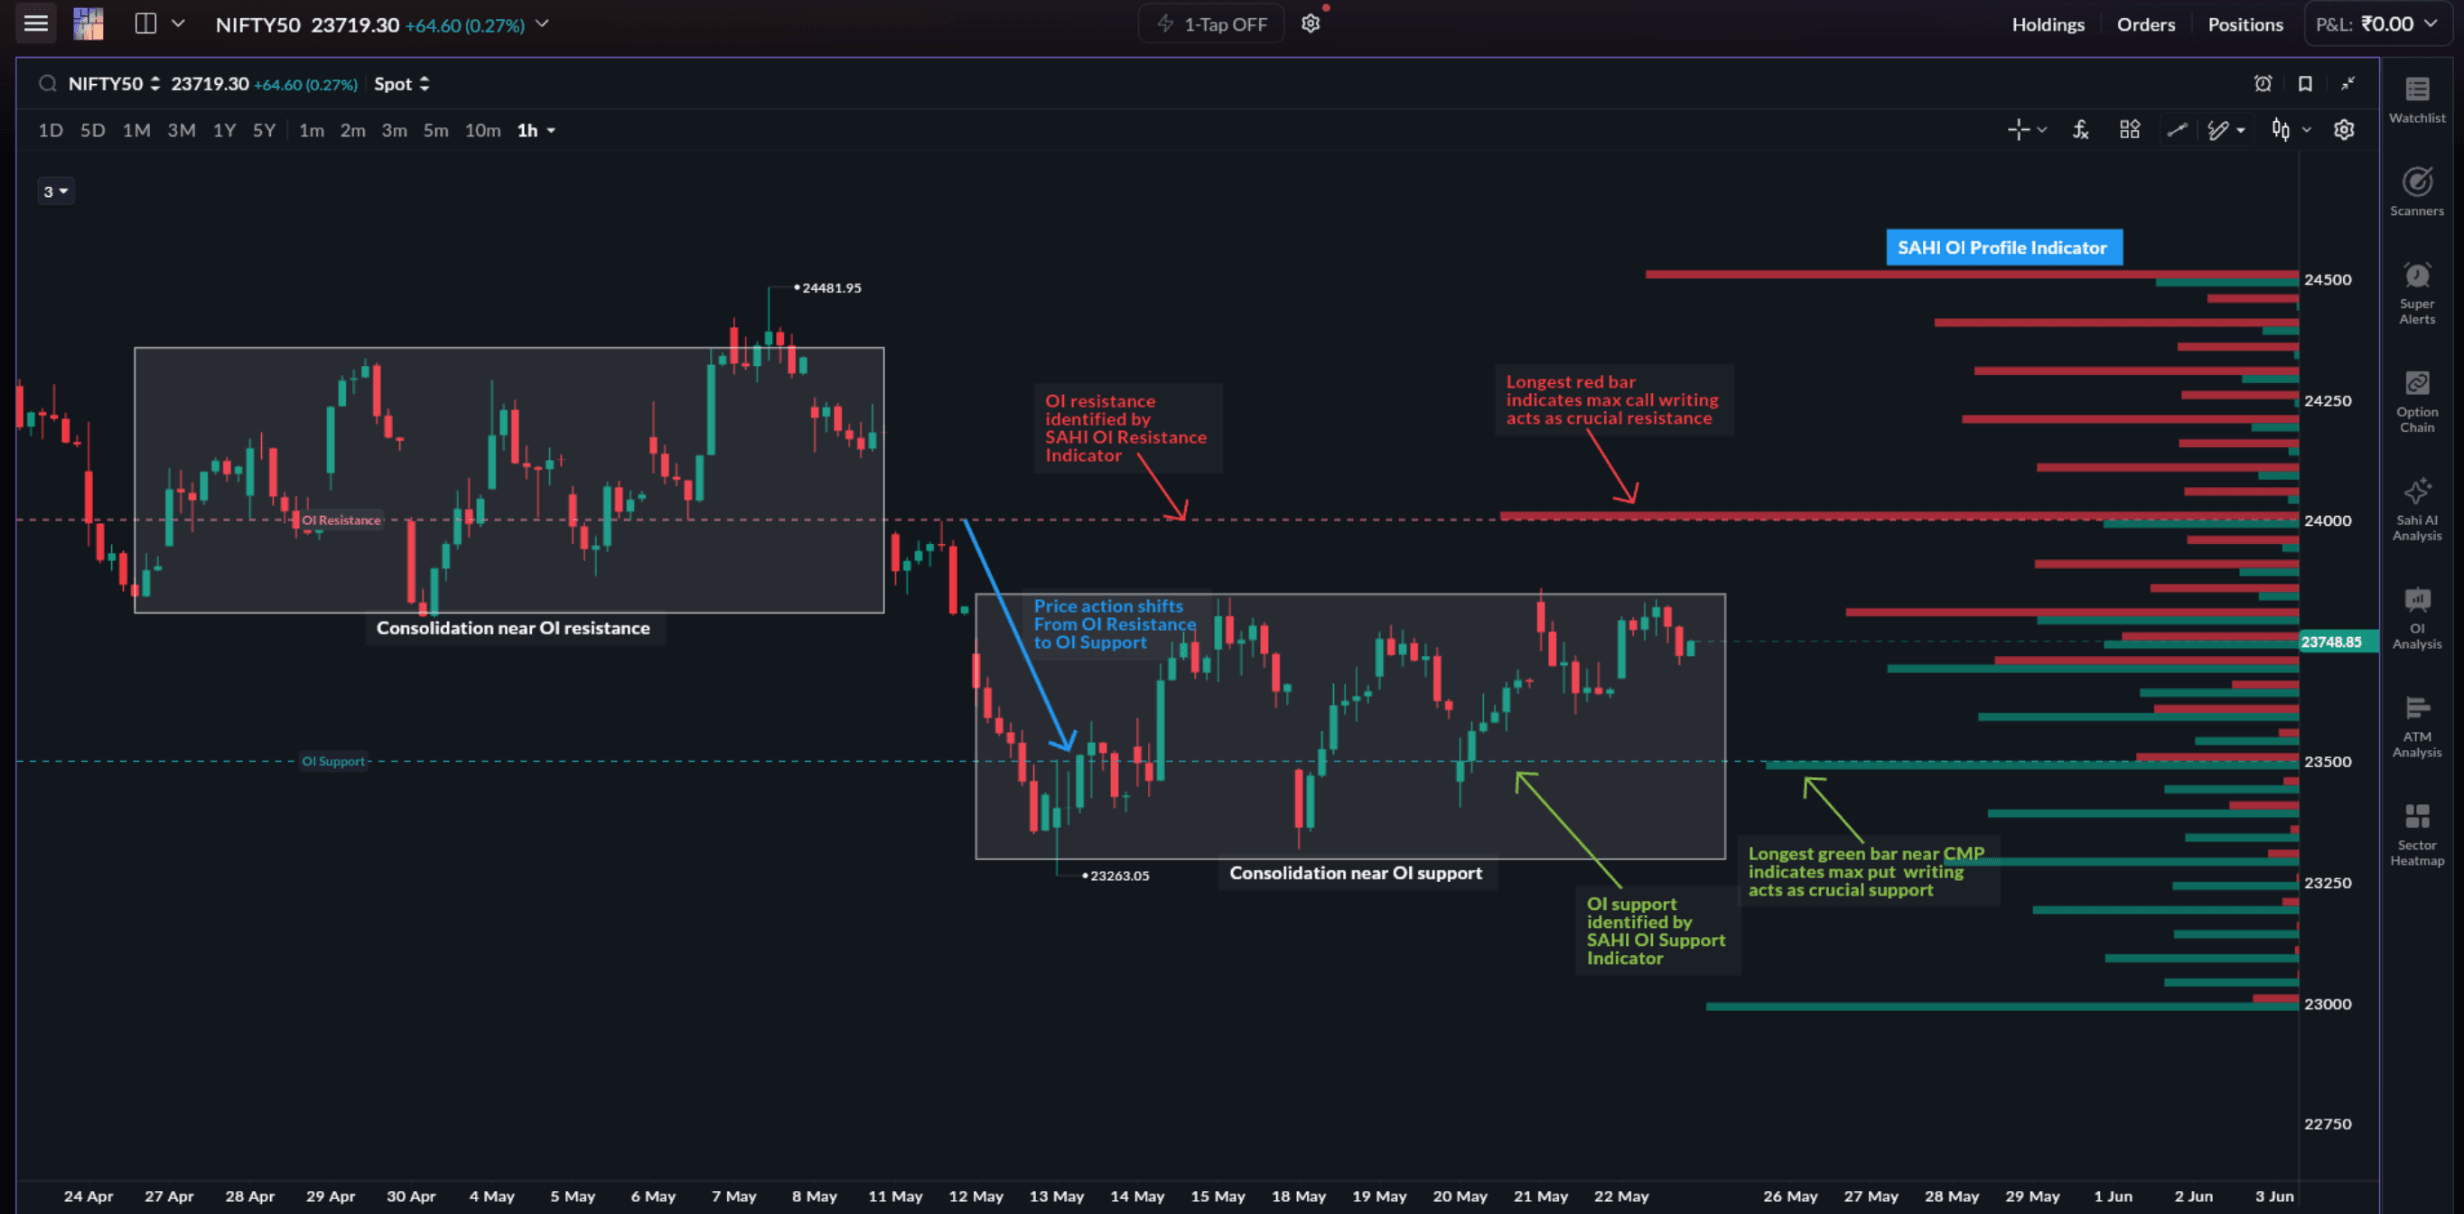
OI Support & Resistance
SAHI combines option positioning with price structure. Heavy:
- Call OI may act as resistance
- Put OI may act as support
This creates additional confirmation around reaction zones.
OI Profile
OI Profile helps visualise strike concentration, positioning clusters, and participation intensity. This improves understanding of active market zones during the session.
Max Pain
Max Pain highlights expiry-related pressure zones where option writers may attempt to pin price movement. It becomes more relevant during expiry sessions, low-volatility conditions, and range-bound markets.
Combining Indicators Together
Indicators become most useful when they support the same market behaviour together. Strong scalp setups usually involve alignment between:
- price structure
- EMA trend direction
- VWAP positioning
- RSI momentum
- volatility behaviour
- OI confirmation
Example:
- price breaks above resistance
- price holds above VWAP
- EMA trend remains bullish
- RSI strengthens above 60
- volatility begins expanding
- OI build-up supports continuation
This type of alignment usually creates cleaner trade setups with better momentum follow-through.
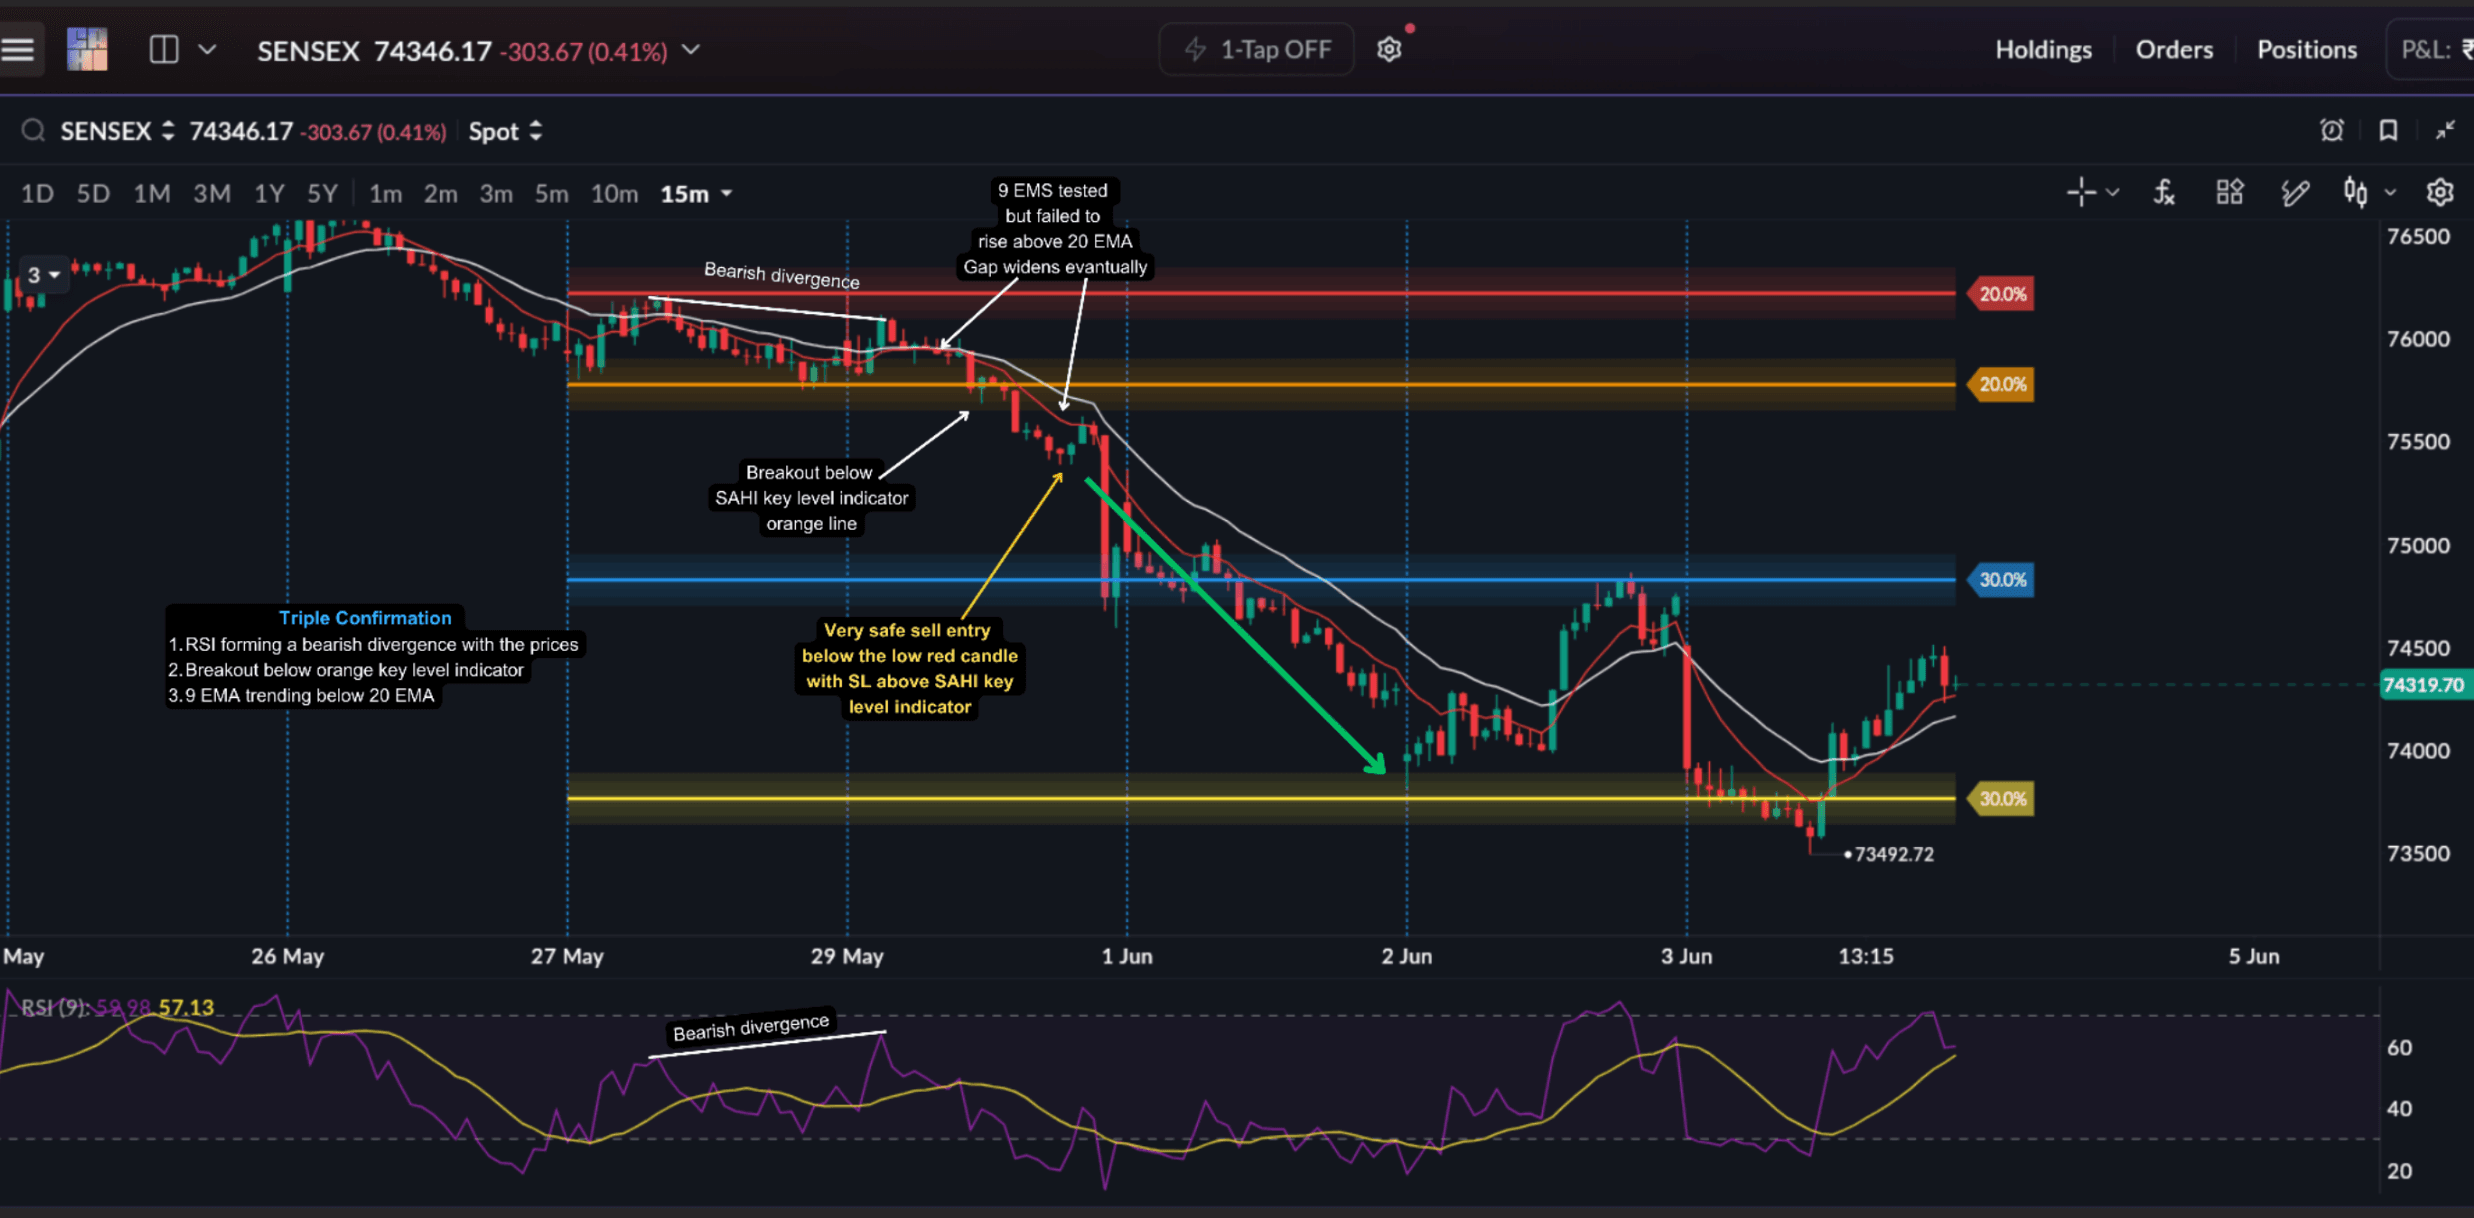
Multiple aligned confirmations help filter weaker trades and improve execution quality. However, traders should avoid overloading charts with indicators. Too many signals create noise, conflicting interpretations, and analysis paralysis, taking focus away from price action.
Indicators should simplify execution, not complicate it.
Common Mistakes While Using Indicators
- relying on indicators without price structure
- using too many indicators simultaneously
- taking delayed entries after multiple confirmations
- ignoring volatility conditions
- blindly following crossovers or overbought/oversold signals
- treating indicators as prediction tools instead of confirmation tools
The objective is not to find more signals. It is to filter weaker setups and improve execution quality.
When Good Setups Still Fail
Indicators help improve execution timing, but even strong setups can fail because of poor decision-making, emotional trading, or incorrect risk management.
The next chapter focuses on the execution mistakes and trade behaviours that repeatedly cause scalpers to lose consistency during live trading.
Test yourself
Check how well you understood using indicators for scalping execution.
Investor knowledge check
How well do you understand the markets?
Five quick questions on EMA, VWAP, RSI, Bollinger Bands and ATR in live scalping conditions.
 5 questionsUnder 3 minutes
 Instant score