
Risk and Money Management
In scalping, outcomes are shaped over a series of trades. This chapter looks at how risk is controlled, how position size is decided, and how small decisions begin to affect results when trades are frequent.
 12 minutes read|
Why Risk Management Matters
In scalping, things usually don’t go wrong in one obvious moment.
A stop-loss is placed a little late, a position is slightly larger than it should have been, or a trade is held just a bit longer because it might come back. On their own, these decisions don’t feel serious.
But you’re not taking one trade. You’re taking multiple trades in the same session, and once you look at it that way, these small decisions don’t stay separate. They start adding up.
A loss that should have been ₹1,500 becomes ₹3,000. The next trade is taken a little early. Then another one, just to recover what was lost. By the end of the session, nothing stands out individually, but the overall outcome is worse than it should have been.
Look at the two cases below.
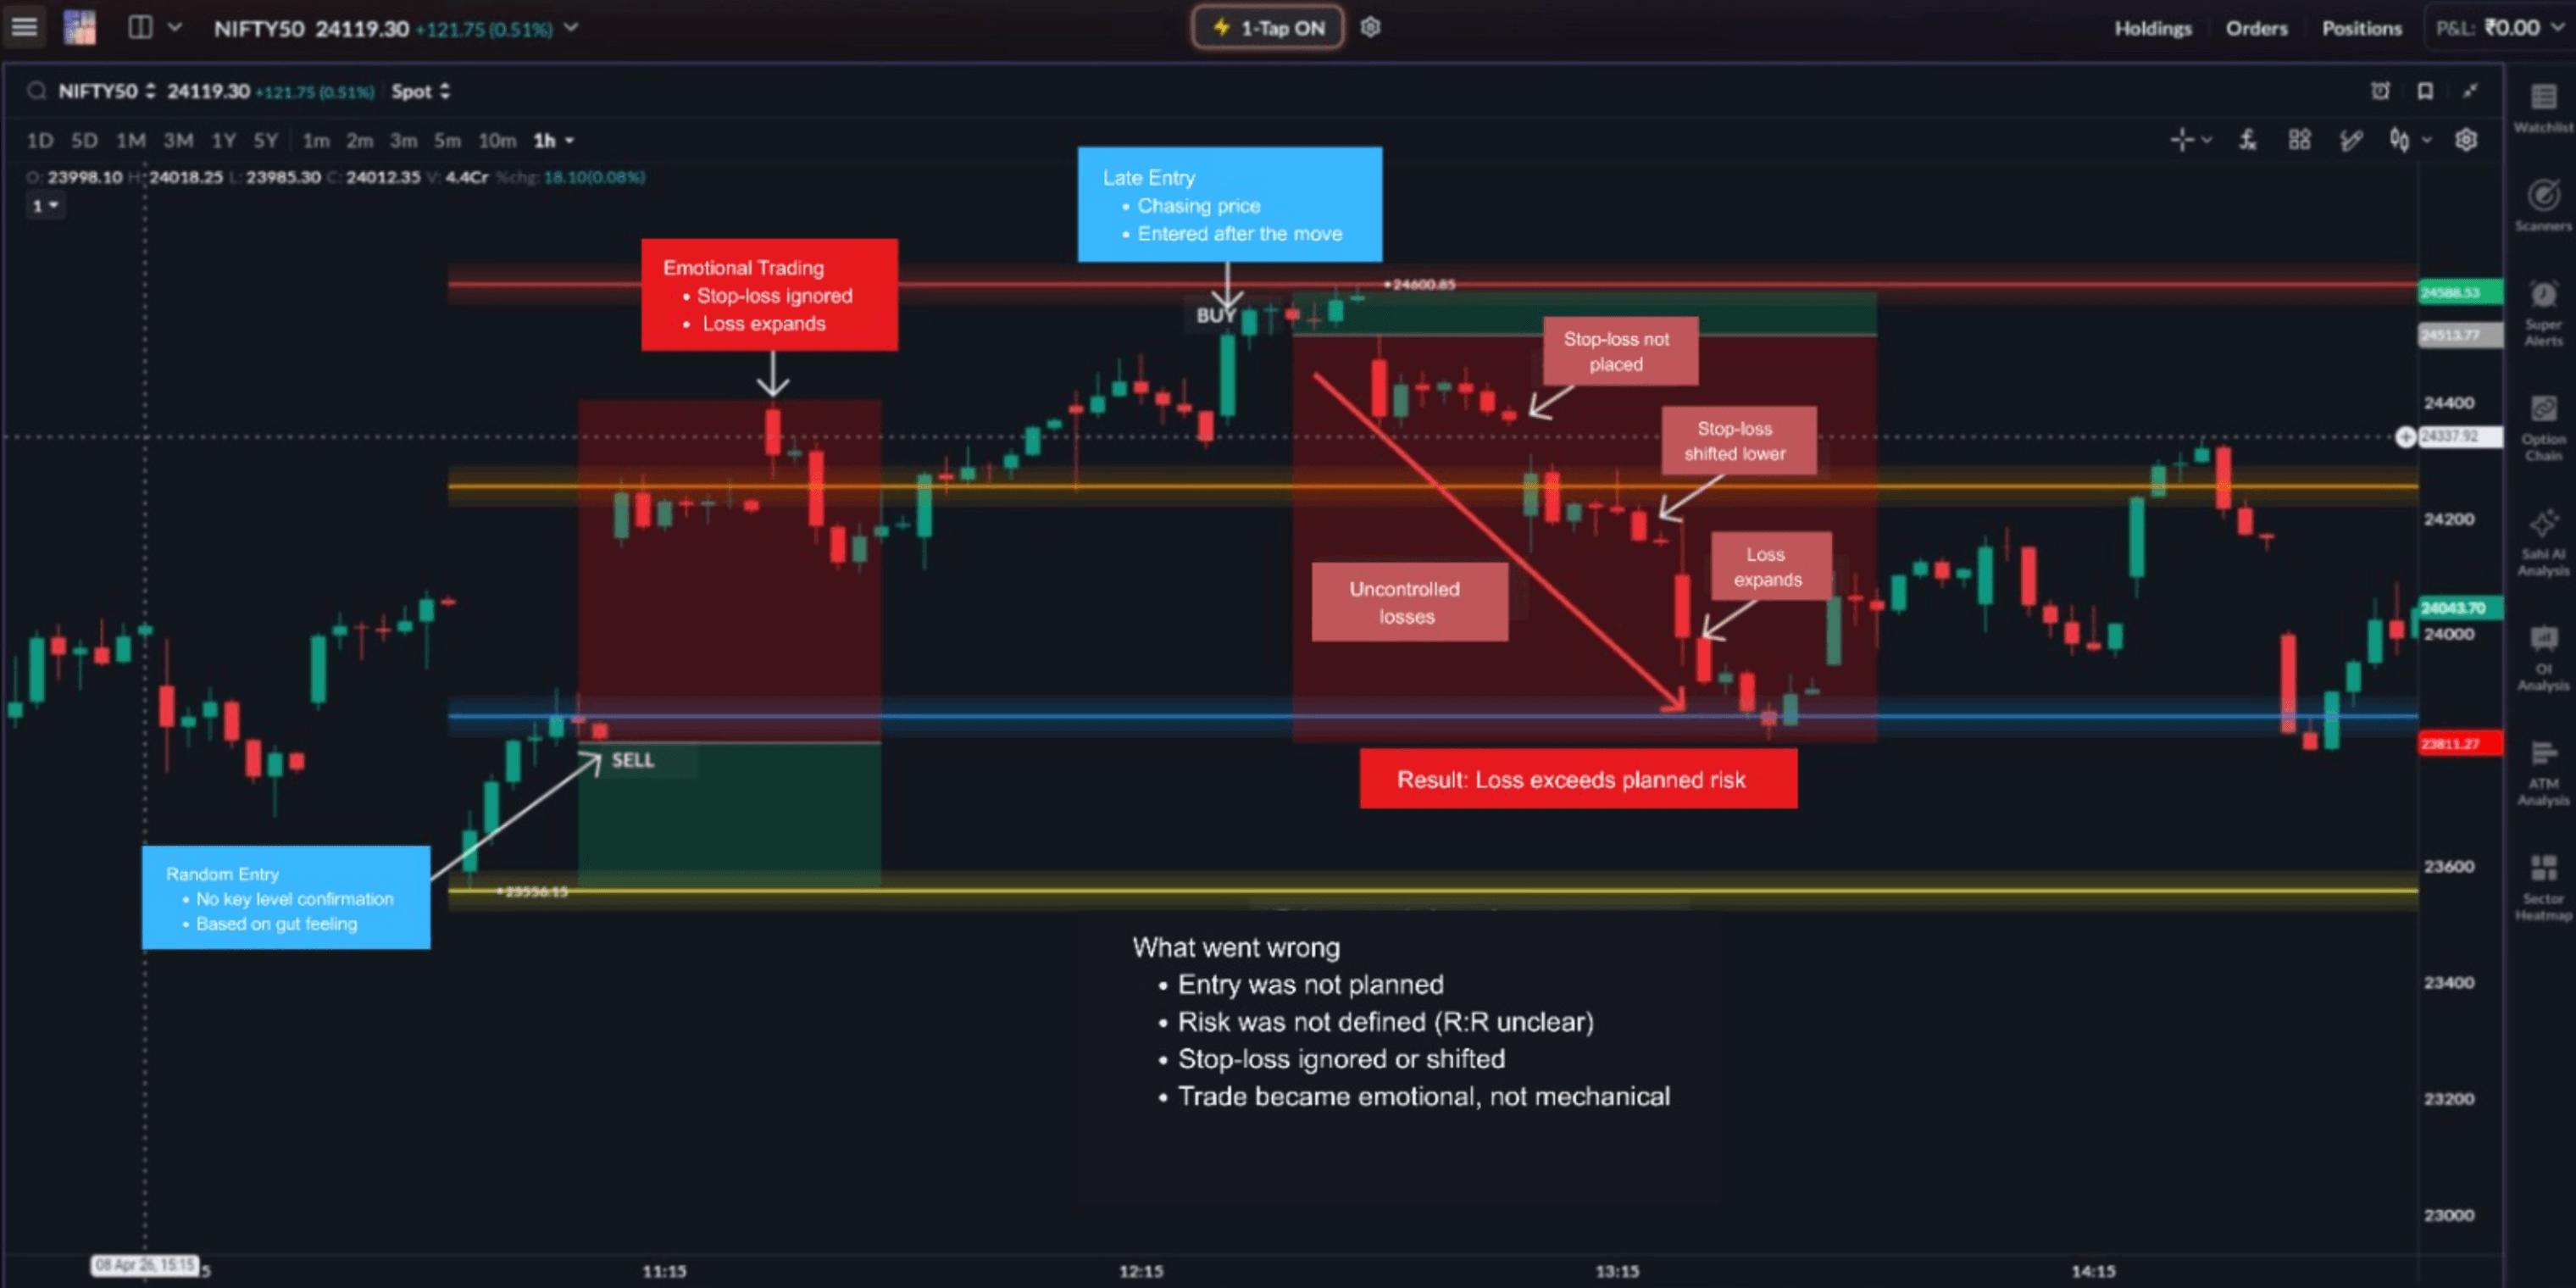
Same trade with stop-loss → loss contained
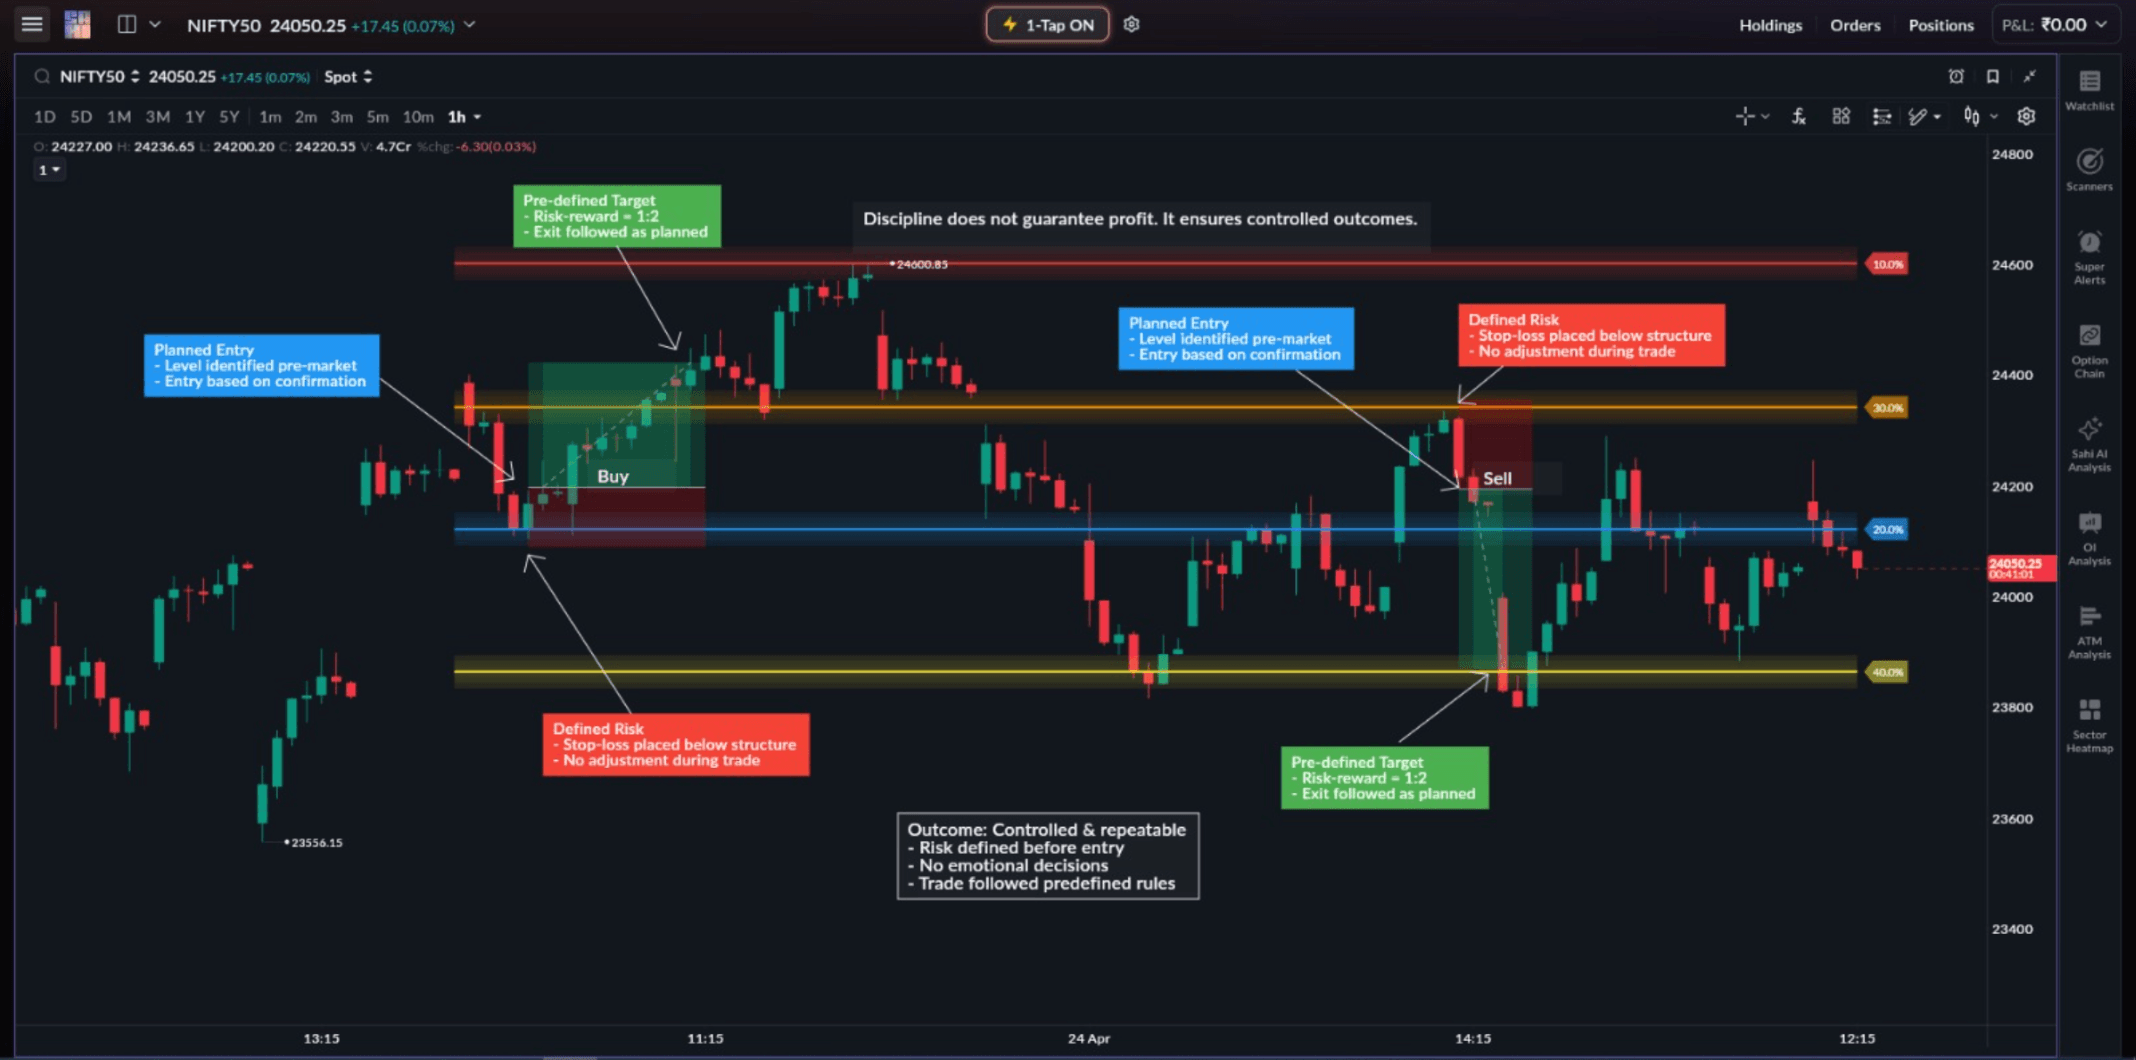
Risk Per Trade
Once you start looking at trades as part of a sequence, the next step is deciding how much you are willing to lose on each one. Every risk framework starts with that question.
In scalping, this is usually defined as a fixed percentage of total capital, typically in the range of 0.5% to 2% per trade.
What this looks like in practice
- Capital = ₹2,00,000
- Risk per trade = 1%
- Maximum loss per trade = ₹2,000
This number is defined before the trade begins and stays the same across trades.
It does not change based on:
- Confidence
- Market conditions
- Previous wins or losses
Once this is kept consistent, individual trades start to matter less on their own. A single loss remains small, and even a short losing streak does not make recovery difficult.
Why this matters
- One trade cannot significantly damage the account
- Drawdowns remain controlled
- The strategy gets enough room to play out across multiple trades
The key here is timing. Risk is defined before the trade is taken, not while it is being managed. Once the maximum loss is fixed, position size becomes a calculation rather than something that is adjusted in the moment.

Stop-Loss Placement
Once risk per trade is defined, the next step is deciding where the trade should be exited if it goes wrong. In scalping, the stop-loss is not a number chosen based on comfort. It is placed at a level where the trade idea no longer holds.
A stop-loss works best when it is aligned with what the chart is doing. In simple terms, it should sit at a point where the market structure breaks, not where your comfort level ends.
The chart below shows the difference between a stop-loss placed around market structure and one placed randomly.
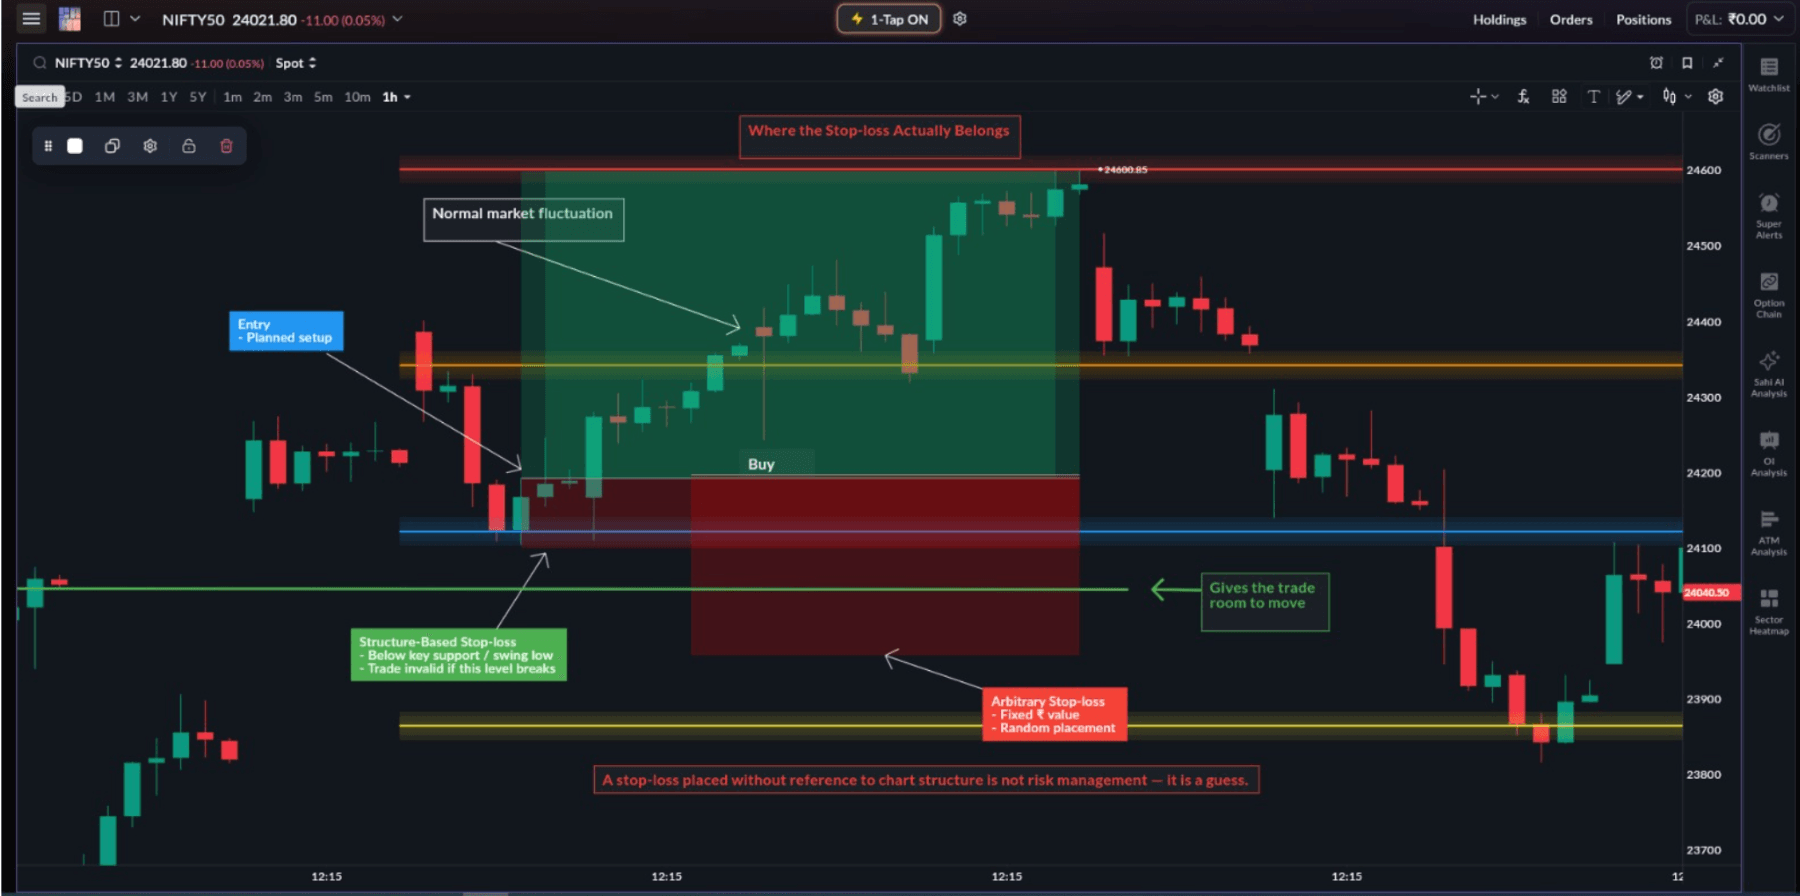
In this example, the structure-based stop-loss sits below the key support area. As long as that level holds, the trade idea remains valid. If it breaks, the setup no longer makes sense and the exit becomes clear.
This is usually how stop-losses are placed in practice:
- Below support for long trades
- Above resistance for short trades
- Outside the structure defining the setup, such as a range or consolidation
What usually goes wrong is using a fixed stop-loss — for example ₹500 or ₹1,000 per trade — regardless of what the chart looks like.
This often creates two problems.
- If the stop is too tight, normal market fluctuation exits the trade early.
- If it is too wide, the loss becomes larger than necessary.
The issue is that price does not move based on a fixed rupee value. It moves based on structure, levels, and liquidity.
The stop-loss is less about how much you are willing to lose, and more about identifying the exact point where the trade no longer makes sense. Once that level is defined, the exit becomes straightforward.
Position Sizing
Once the stop-loss is defined, the next step is deciding how much to trade. This is where things usually start to drift in practice, not because the concept is unclear, but because it is not applied consistently.
Position size is not something that is chosen based on margin, premium, or instinct. It comes from a simple calculation.
Position sizing example (Nifty options)
Let’s take the same numbers from the previous section.
- Risk per trade = ₹2,000
- Stop-loss distance = 20 points
- Lot size (Nifty 50) = 65 units
What this gives you
Position size = 2000 ÷ (20 × 65) ≈ 1.53 lots
Since lots cannot be traded in fractions, the decision comes down to how you adjust this.
- 1 lot keeps the risk lower than planned, around ₹1,300
- 2 lots takes the risk above the limit, around ₹2,600
In practice, rounding down keeps the risk aligned with what was defined earlier.
The important part here is that this decision is already made before the trade is taken. Once the trade is live, position size should not be adjusted based on how the setup looks or how the previous trade played out.
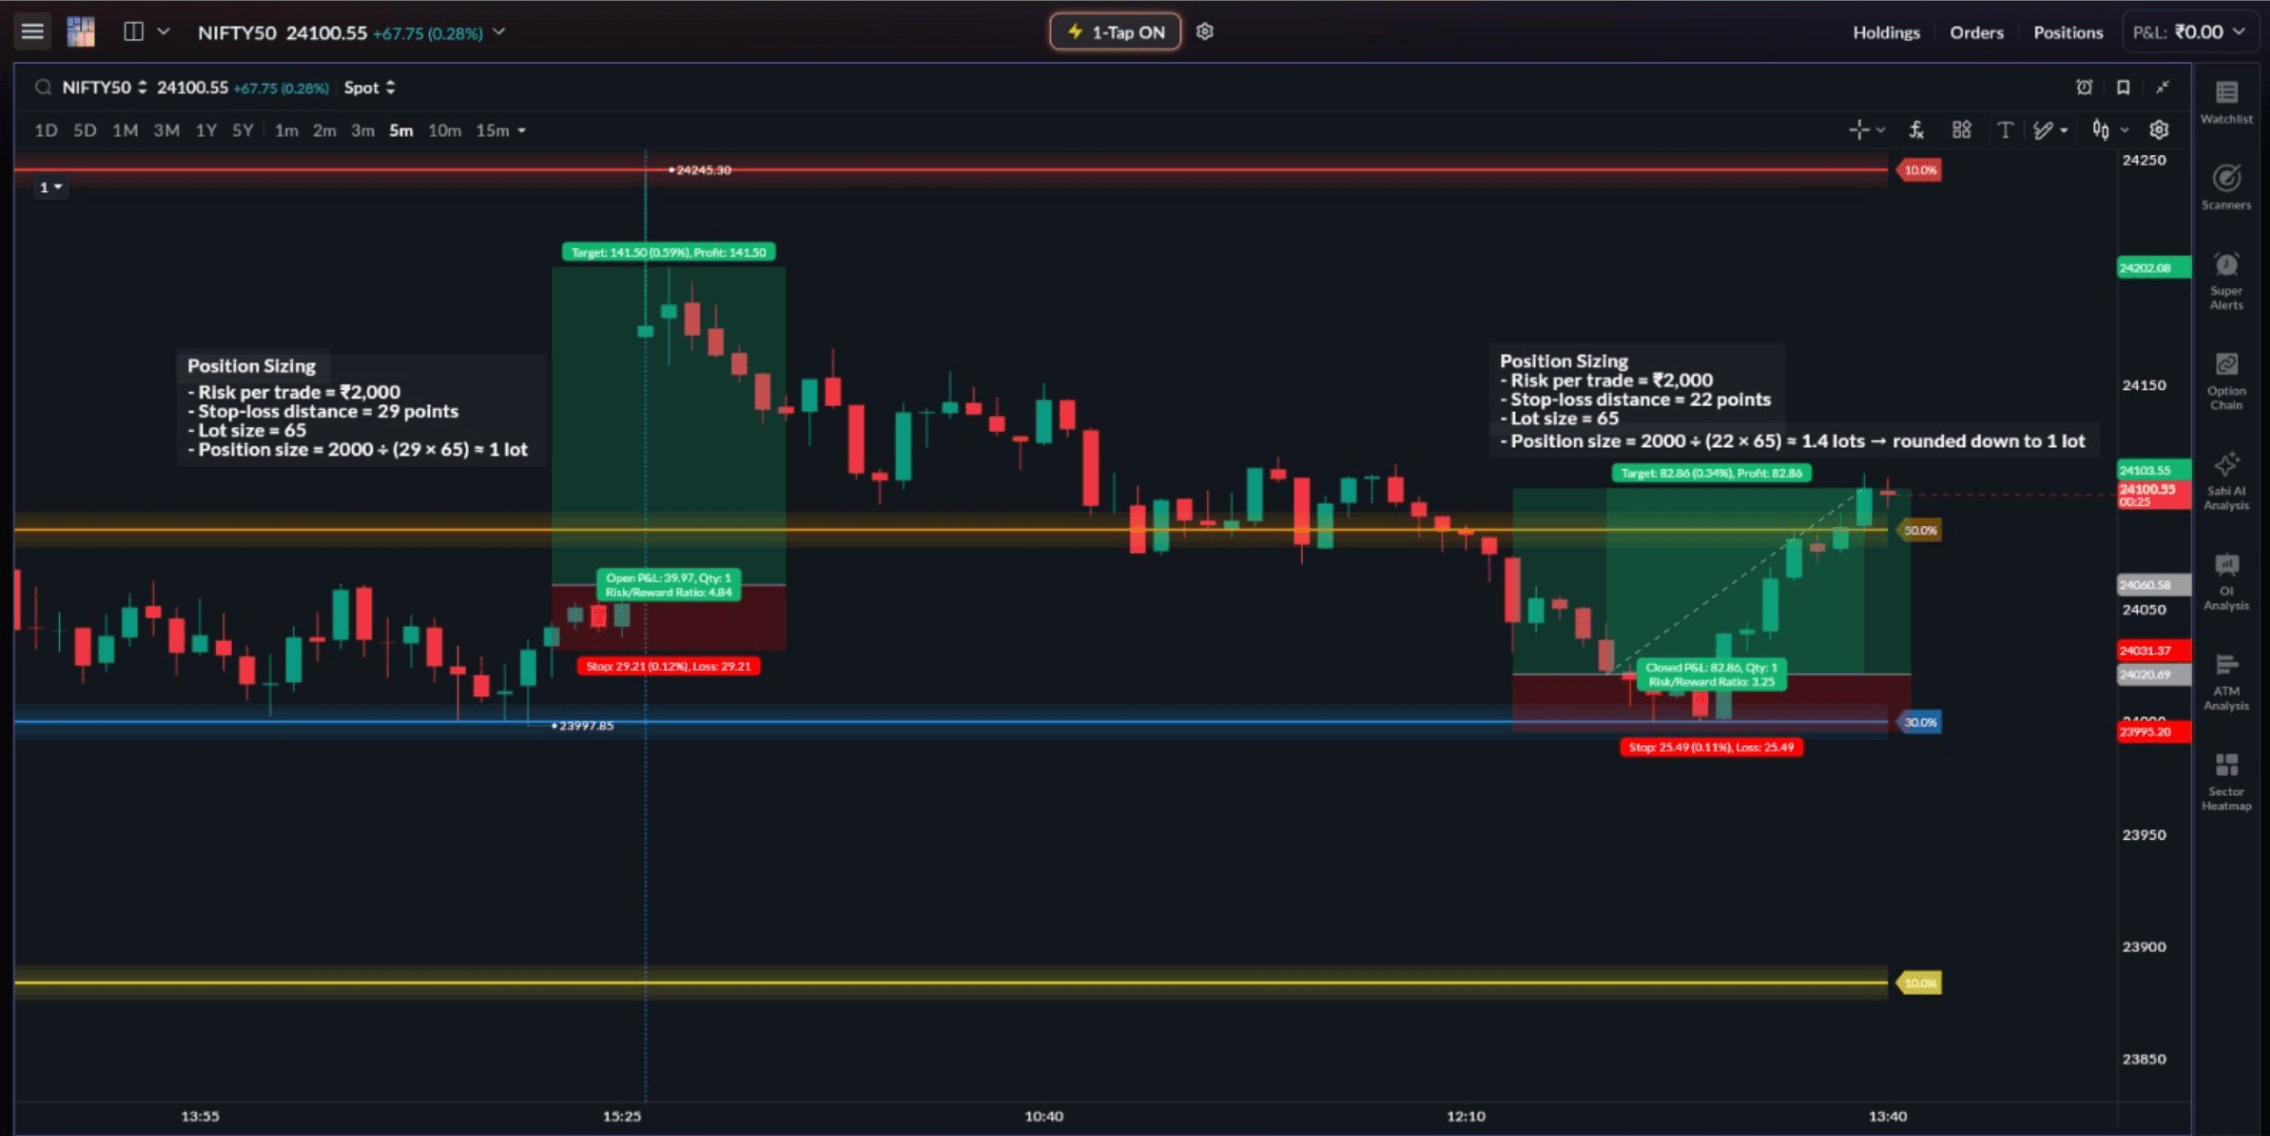
Where things usually go wrong
A common approach is to size positions based on premium. An option that looks inexpensive often leads to larger quantities being taken, because the absolute price feels small.
But that is where risk gets misread. A higher quantity with even a small move against the position can lead to a larger-than-expected loss.
So the price of the option does not define the risk. The stop-loss distance and the position size together do.
Managing Small Gains
Once the per-trade framework is in place — risk defined, stop-loss set, position sized — the next question is how that framework holds up across a full session.
Scalping is built on small, consistent gains. The idea is not to capture large moves, but to repeatedly take relatively smaller moves using defined setups. That also means the margin for error is limited.
Where this starts to matter
In the Indian options market, every trade carries costs — brokerage, STT, exchange charges, and GST.
For a scalper, these costs become meaningful because they repeat across every trade. On a ₹100 profit in a single Nifty options trade, the total transaction cost per lot can still reach around ₹28–₹33, even with a low-cost brokerage structure.
A single trade may not feel expensive. But across 10 or more trades in a session, these costs begin to compound quickly and directly affect the final net outcome.
Cost Calculation Example (1 Lot of Nifty Options)
| Charge Type | Rate | Buy Side (₹) | Sell Side (₹) | Total (₹) |
|---|---|---|---|---|
| Brokerage | Flat | 10 | 10 | 20 |
| STT | 0.15% (Sell) | 0 | 3.75 | 3.75 |
| Exchange Transaction Charges | ~0.05% | 1.25 | 1.25 | 2.50 |
| GST | 18% on (Brokerage + Txn) | 2.03 | 2.03 | 4.06 |
| Stamp Duty | 0.003% (Buy) | 0.08 | 0 | 0.08 |
| SEBI Fee | Approx. | 0.00 | 0.01 | 0.01 |
| Estimated Total | ₹13.36 | ₹17.03 | ₹30.39 |
Note: SAHI may offer introductory zero-brokerage periods for new users. In such cases, the total transaction cost would reduce further since brokerage and related GST components would not apply.
What usually goes wrong
A few trades are executed as planned, and small gains begin to build. Then one trade is handled slightly differently.
The stop-loss is not followed, or the position is held a little longer in the hope that it reverses. That single trade ends up being larger than intended, and the gains from earlier trades are offset.
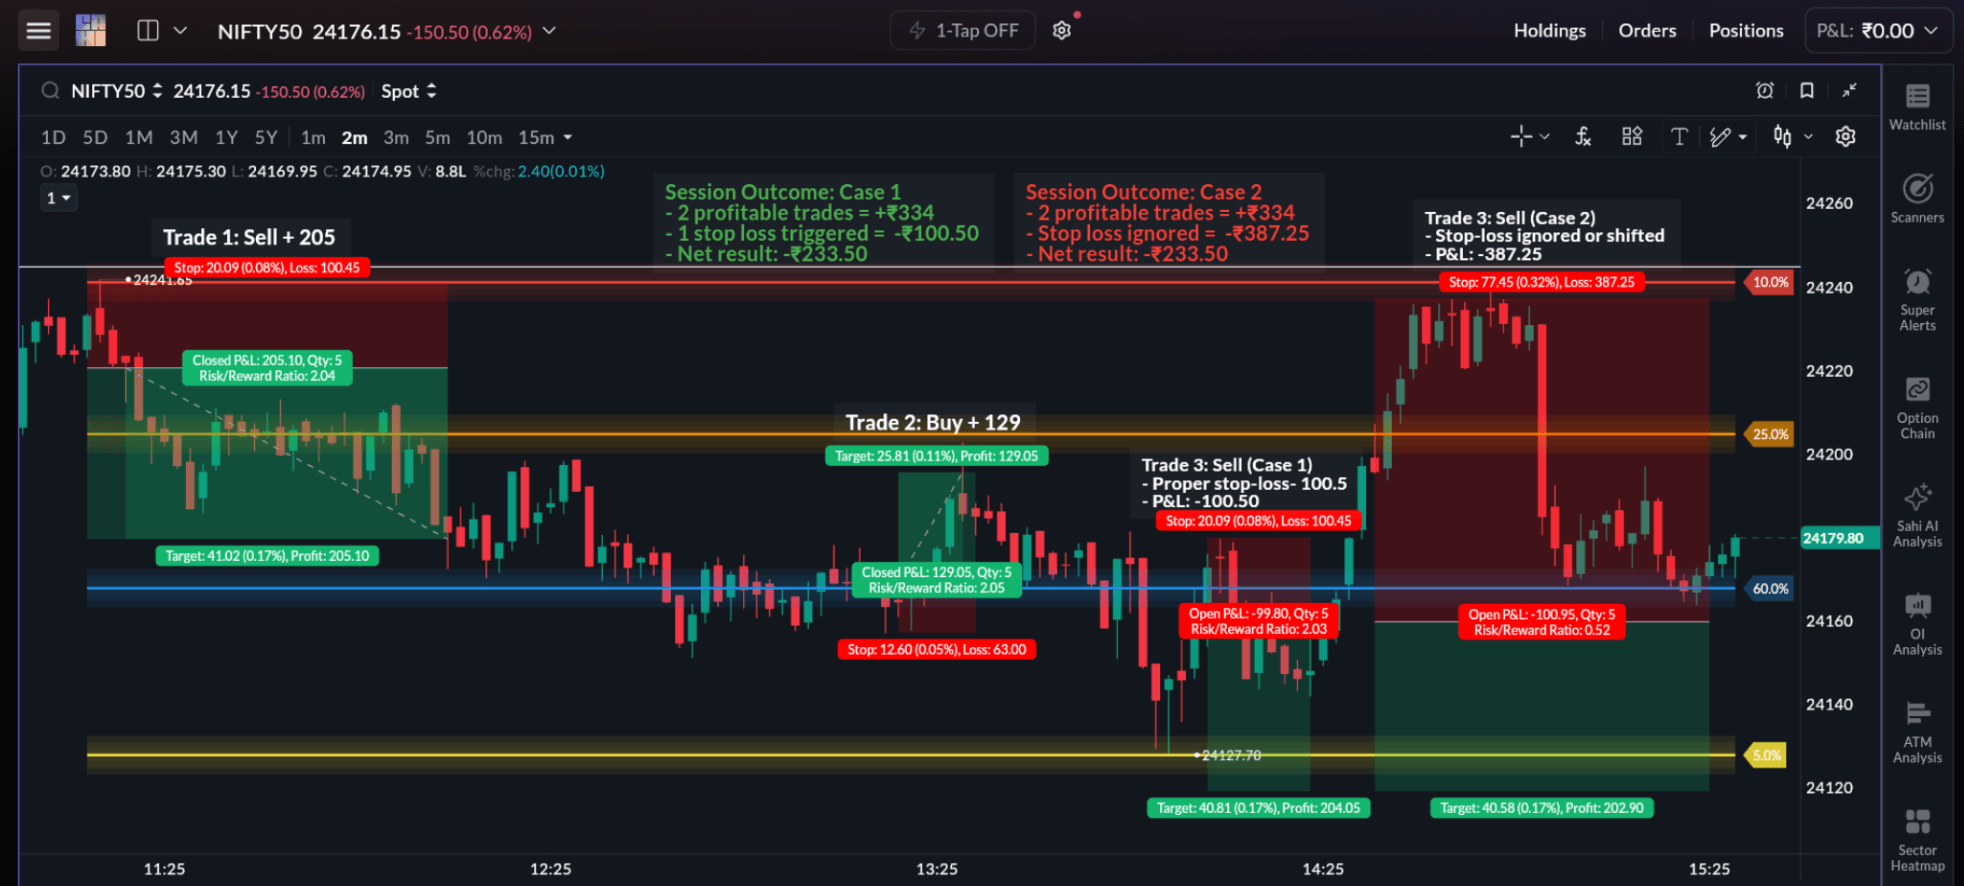
This is not unusual. It is how many sessions end up turning from slightly positive to negative.
In practice, this usually shows up in a few ways:
- Trades are taken only when setup conditions are met
- The stop-loss is placed and followed
- Exits are taken when the trade reaches the defined level or becomes invalid
- Positions are not held in the hope of extending a scalp into a larger move
Pre-Market Routine
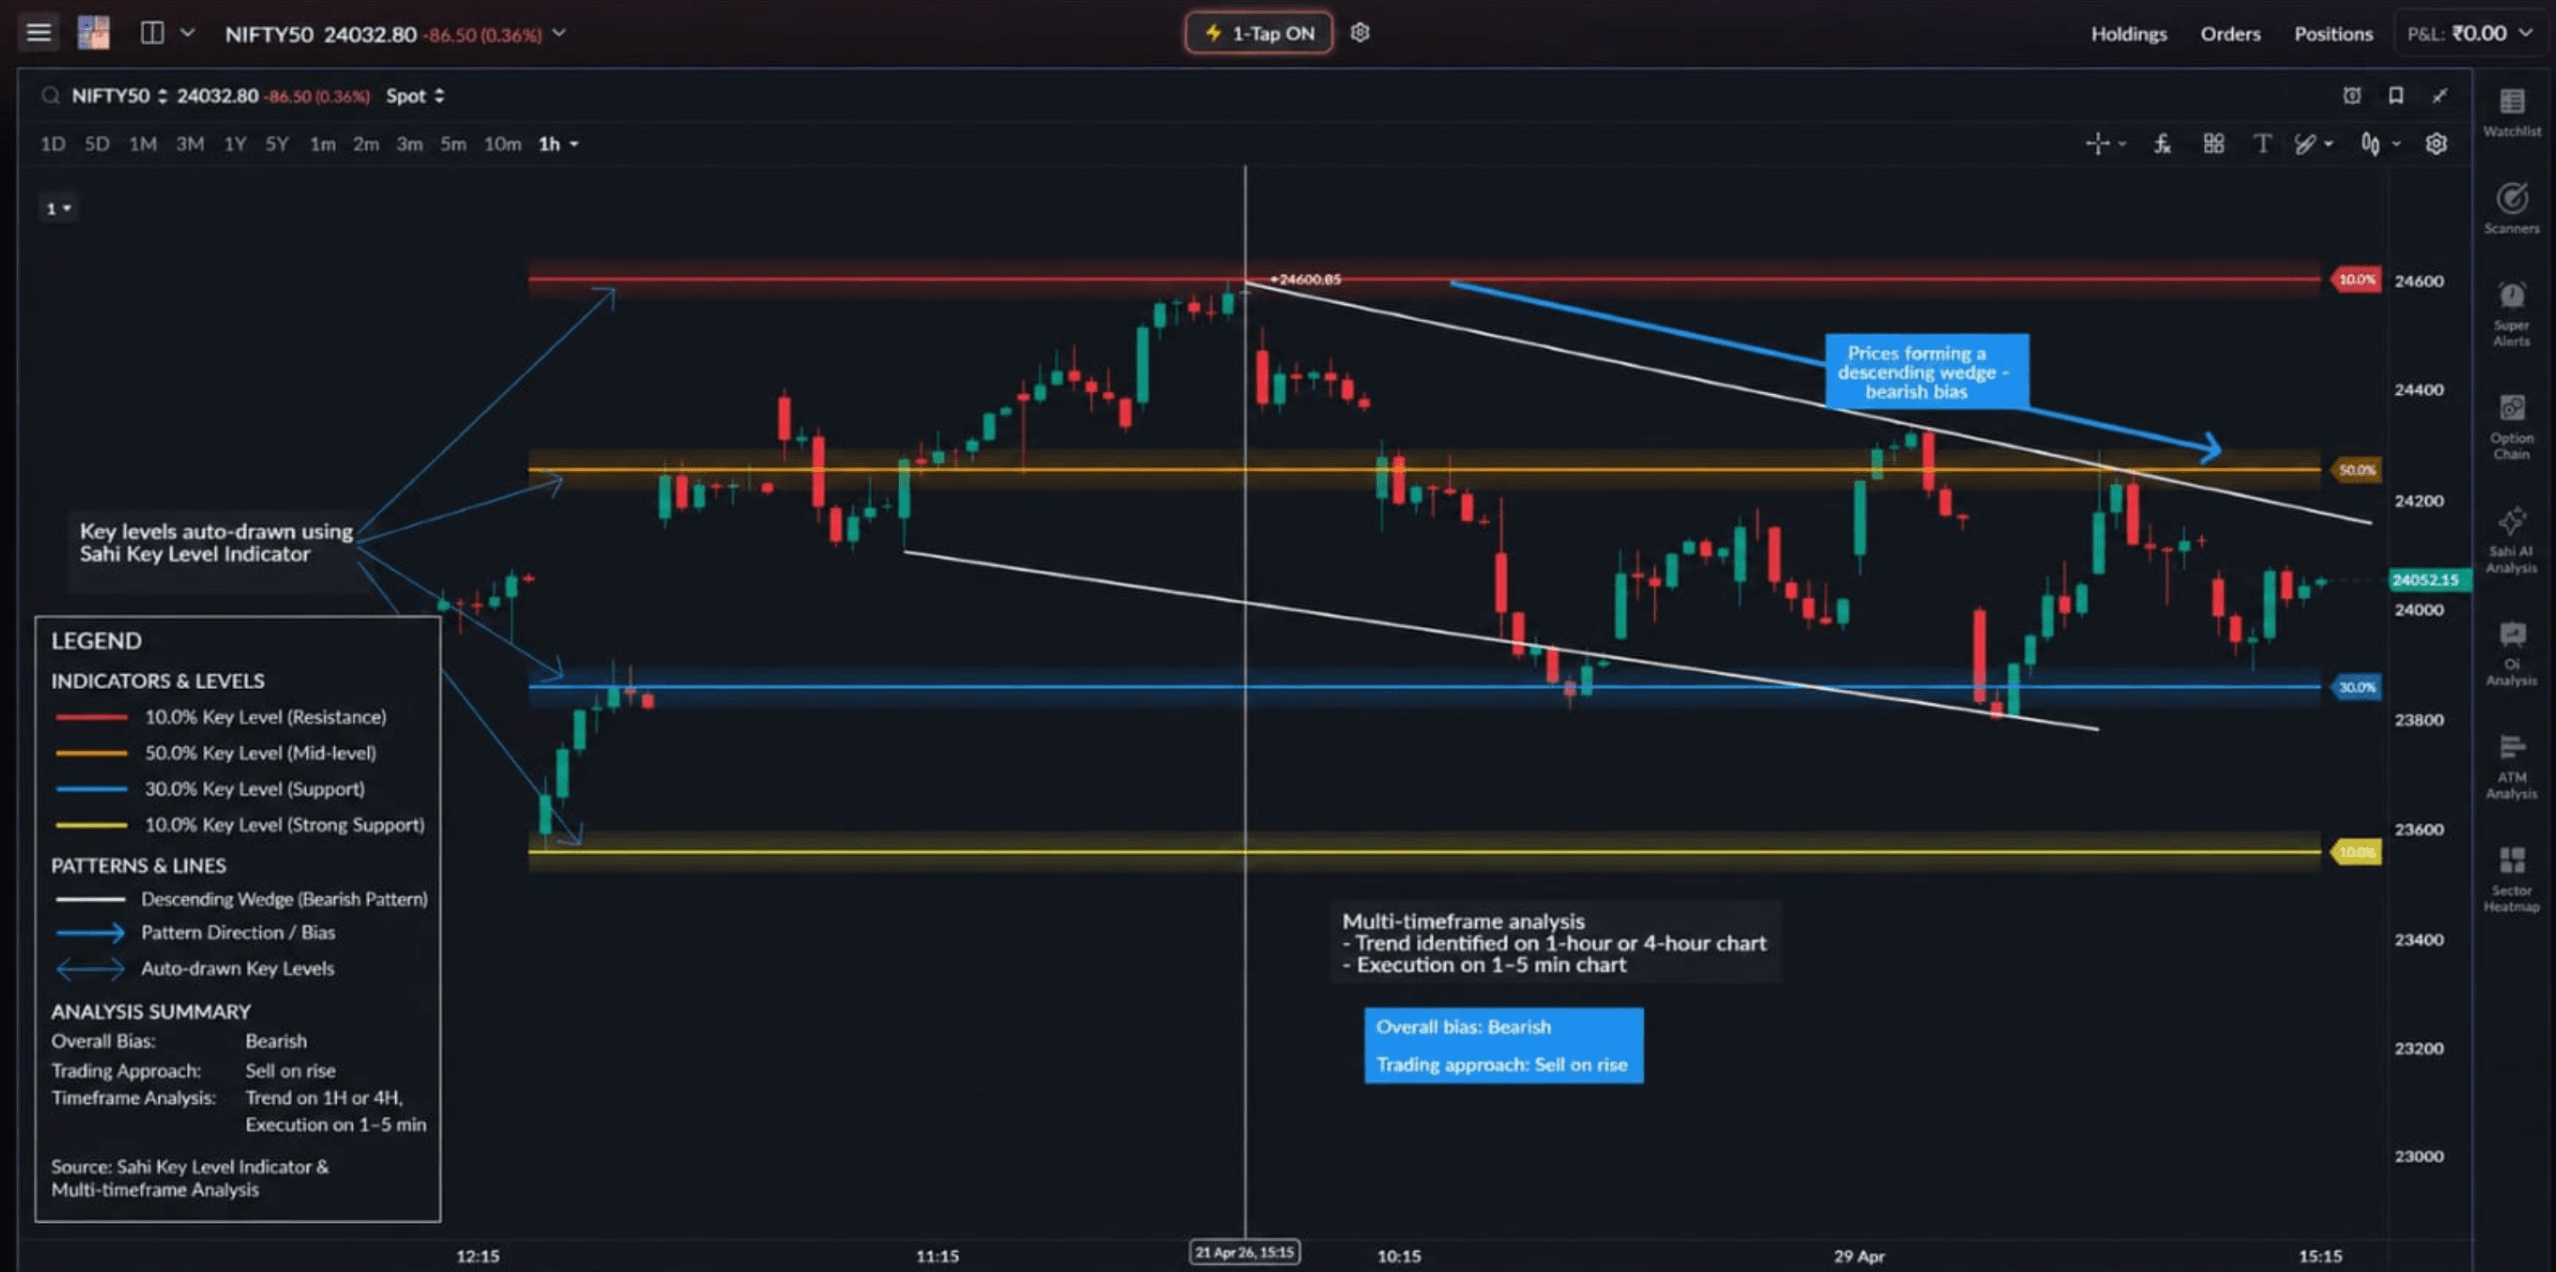
Most execution failures during a session trace back to the same place: what was not decided before the market opened.
By the time the session begins, the basic picture should already be in place, where the key levels are, what kind of conditions the market is in, and how much risk is being taken for the day.
Once that is in place, decisions during the session tend to become simpler, because price reaching a level is something that was already marked, not something that needs to be worked out in real time.
Daily Pre-Market Trading Checklist
| Category | Indicator / Parameter | What to Look For | Trading Action |
|---|---|---|---|
| Volatility | India VIX | Above 18–20 (High) / Below 15 (Low) | High: Reduce lot size, wider SL. Low: Standard lot size, tighter SL. |
| Sentiment | Global / Gift Nifty | Bullish, Bearish, or Neutral | Determines if we expect a Gap Up, Gap Down, or Flat opening. |
| Technical | Key Levels | S/R, PDH/PDL*, Supply/Demand | Identify "No-Trade Zones" and potential breakout/reversal points. |
| Data | Option Chain | Max Pain, PCR, Heavy OI | Confirm where big players are writing contracts (Hard Floors/Ceilings). |
| Discipline | Risk Limits | Max Loss for the day | Stop trading immediately if the "Daily Drawdown" limit is hit. |
*PDH/PDL = Previous Day High / Previous Day Low
How this helps in practice
When preparation is done properly, the session tends to feel more straightforward.
Price reaching a level is something that was already marked earlier, so the response comes quicker and with less hesitation. Entries tend to line up better, and there is less need to second-guess decisions while the trade is live.
When that preparation is missing, trades usually start building around what price is doing in the moment. Entries come a bit late, exits get uncertain, and there is often a need to justify the trade after it is taken.
Over time, this shows up in the way sessions play out. Decisions feel rushed, trades are not always planned, and small gains become harder to hold on to.
What this comes down to
- Fewer emotional decisions
- Less reaction-based trading
- More timely entries
The last row in the aforementioned checklist, risk limits, is not just another preparation step. It is the boundary that protects everything the session builds.
Daily Risk Rules
Alongside risk per trade, there are limits that apply to the session as a whole. These are not precautions for bad days. They are the structure that keeps a bad day from becoming a bad week.
Two limits usually matter the most.
A maximum number of trades prevents overtrading on days where setups are not clear. When the count is reached, the session ends regardless of how the market looks. This removes the temptation to keep searching for a trade that justifies staying active.
A daily loss limit (daily drawdown) defines the point where the trading session ends on a losing day. After a few consecutive losses, the urge to recover them can lead to emotional and impulsive trades that drift away from the original plan.
This is where the Kill Switch feature on the SAHI platform becomes useful. Once a predefined loss limit is reached, it allows traders to disable trading in a selected segment for the rest of the day. The goal is simple: reduce emotional decision-making and prevent revenge trading or overtrading after losses.
Once the limit is reached, the session ends. Not paused or reviewed mid-session. It ends there. The market will still be there tomorrow. The capital needs to be there too.
In practice:
- Set a maximum number of trades per session
- Define a daily loss limit in rupees before the session begins
- Stop trading immediately once either limit is hit
- Use tools like SAHI’s Kill Switch to enforce the limit automatically
- Do not adjust these limits during the session
These rules are decided before the market opens and do not change based on how the session is going.
Trade Journaling
Once the session is done, the only way to understand what actually happened is to go back and review the trades.
Trade journaling is the process of recording and reviewing your trades to understand what is working and what is not. It may sound simple, but it is one of the more effective ways to improve over time, and also one of the first things that tends to get ignored.
Most traders focus only on profits and losses. They remember the outcome, but the process behind those trades often gets missed. Journaling shifts the focus from “Did I make money?” to “Did I execute the trade the way I planned?”
Without a record, mistakes tend to repeat, patterns go unnoticed, and improvement becomes inconsistent.
Over time, the difference starts to show
Without a journal:
- Mistakes get repeated
- Good practices go unnoticed
- Improvement becomes random
With a journal:
- Patterns in execution start to become clearer
- It becomes easier to see which setups actually work
- Consistency begins to build over time
What to record
- Market / script
- Entry and exit levels
- Timing of entries and exits
- Setup type
- Reason for trade
- Execution quality
What becomes visible over time
When reviewed consistently, the journal starts to show things that are not obvious during a live session.
- Whether stop-losses are being followed or adjusted in the moment
- Which time windows tend to work better
- Whether certain setups behave differently under specific conditions
Remember the journal does not need to be complex. A simple, structured log reviewed at the end of each session is enough. Consistency matters more than detail.
From Risk to Timing
Once risk is defined at both the trade and session level, the structure is in place.
What remains is deciding when to act and what to look for. That is where timing, price behaviour, and setups come in, and that is what the next chapter focuses on.
Test yourself
You have covered risk per trade, stop-loss placement, position sizing, session limits, and journaling. Check how well the framework has landed before moving on to timing and setups.
Scalping knowledge check
How solid is your risk framework?
Five quick questions on risk per trade, stop-losses, position sizing, and daily limits. See where you stand and pick up an insight along the way.
 5 questionsUnder 5 minutes
 Instant score