
Ideal Time, Candle Patterns & Chart Structures to Scalp Options
Most traders think of scalping as a function of speed; the faster you act, the more you gain. That is not accurate. A scalper who enters 20 trades in a poor time window will almost always underperform a scalper who takes 3 trades in the right window with clear setups. This chapter separates clock time from trade time — the roughly 2.5 hours of the session where scalping is actually viable.
 10 minutes read|
Options scalping depends on three conditions being present at the same time: enough liquidity so your order fills at a fair price, enough price movement to reach your target, and price behaviour that is readable rather than random.
These three conditions do not exist equally across the trading day. They concentrate in specific time windows. Outside those windows, the market is either too erratic to read or too slow to generate a worthwhile move. Entering during those periods does not increase opportunity; it increases noise.
This chapter explains when these trading windows occur, the setups that work within them, the chart structures to watch, and how SAHI’s Key Level and OI indicators improve reliability.
The Trading Windows
The Indian equity market operates from 9:15 AM to 3:30 PM. Within this session, two windows consistently offer the conditions ideal for options scalping.
Opening Phase (9:15 AM to 9:30 AM)
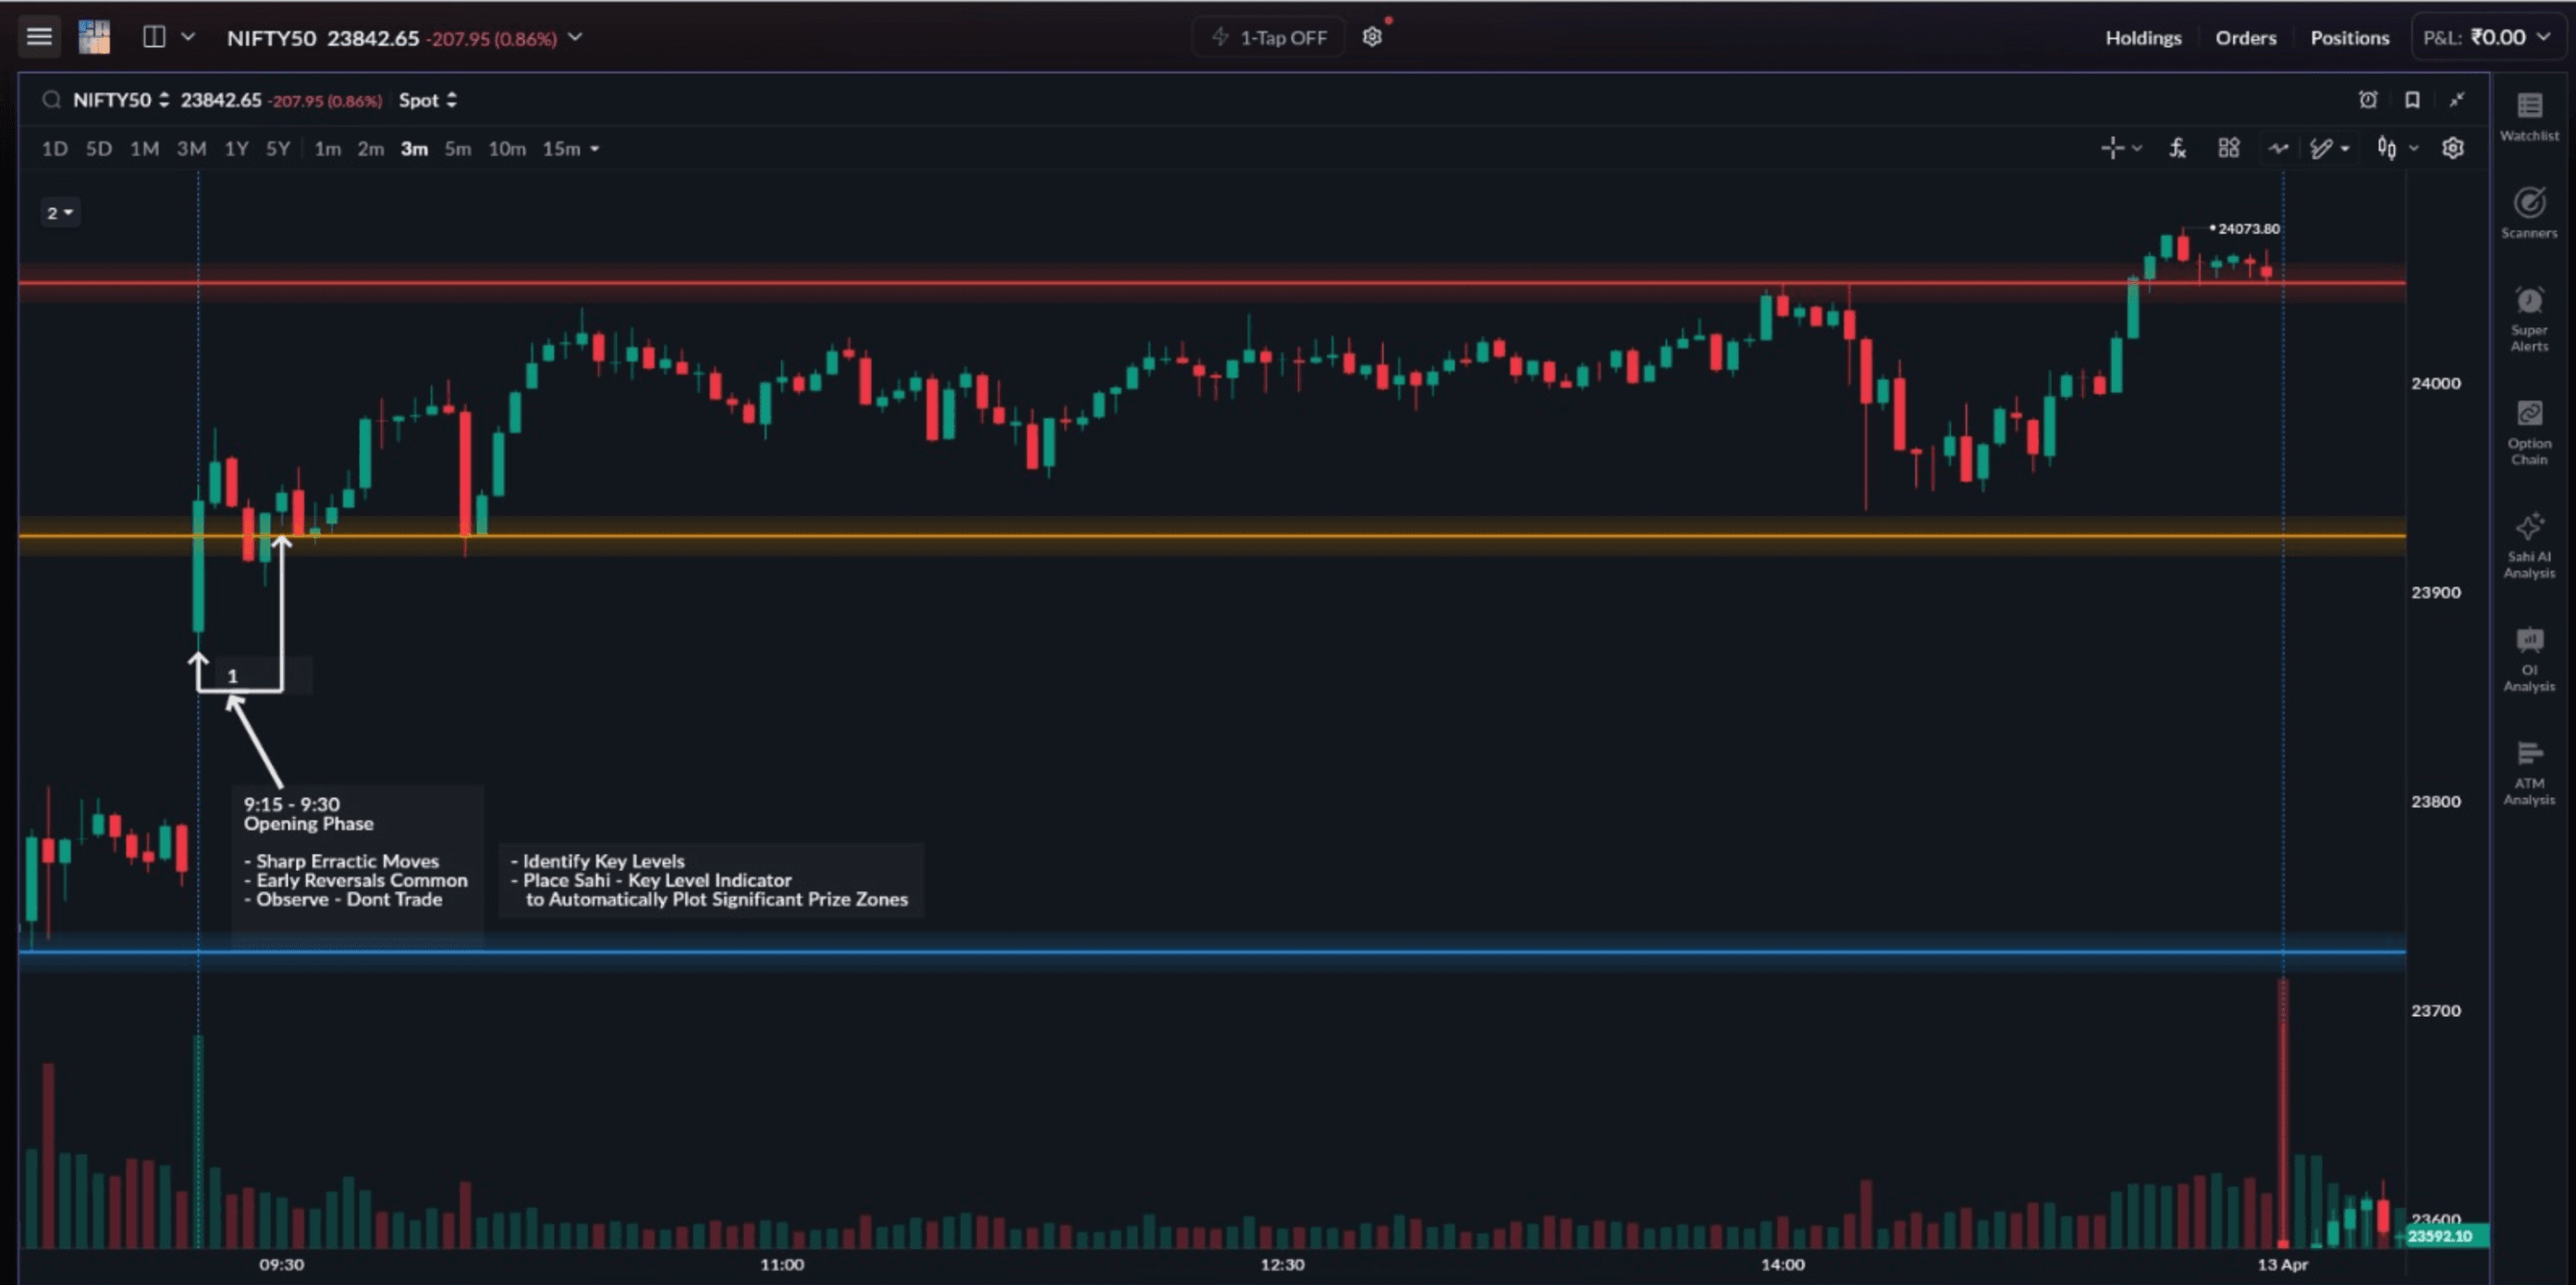
The session begins with overnight news, global cues, and Gift Nifty levels getting priced in at once. This leads to sharp moves in both directions, often within minutes. Price behaviour during this phase is typically erratic. Gaps open, spikes form quickly, and many of these moves reverse just as fast. This makes the first 15 minutes difficult to read and unreliable for execution.
This is not a trading window. Use this time to observe how the market is behaving, identify where price is opening relative to previous levels, and assess whether the initial move is likely to continue or reverse. It is also the right time to let SAHI’s Key Level Indicator mark the important price zones so that you enter the next phase with a clear structure in mind.
Example: Look at the Nifty chart on April 10, 2026. The index opened gap-up at 23,880, moved up nearly 100 points, and then dropped back to the 23,900 zone within minutes.
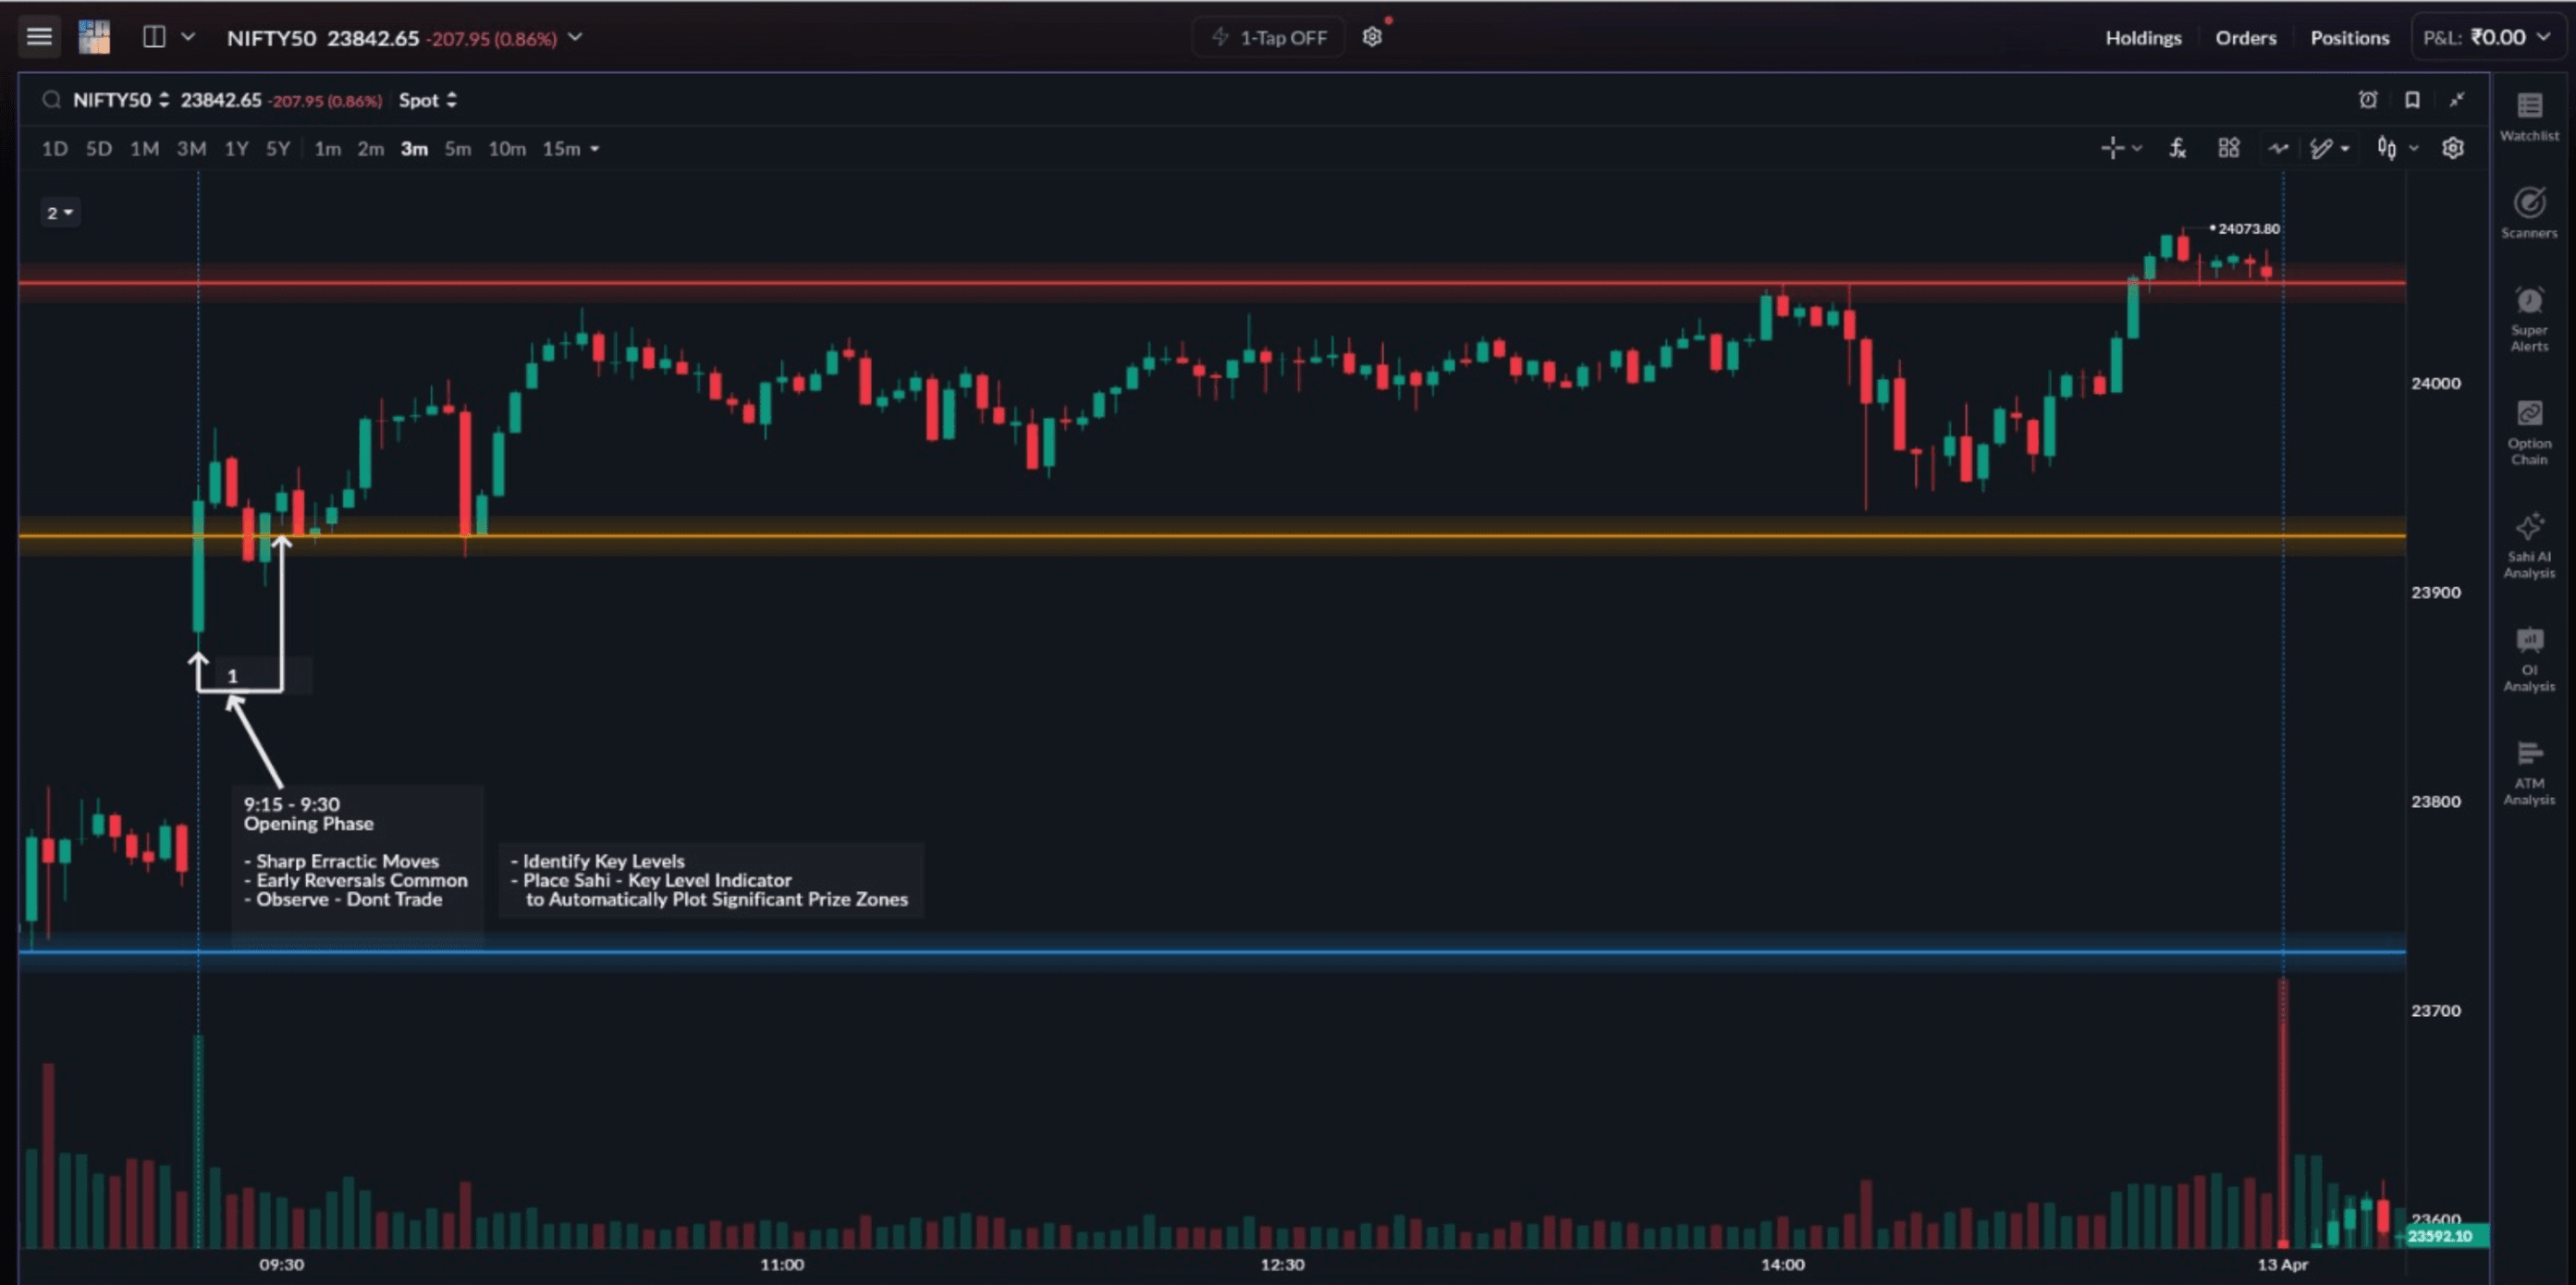
This is typical of the opening phase. Price moves quickly but without structure. Entering during this period often leads to false entries and quick reversals.
The better approach is to wait for the initial volatility to settle, identify key levels, and look for entries only after price begins to behave in a more structured manner.
Window 1 — Opening Hour: 9:30 AM to 10:15 AM
Once the initial volatility settles, price action becomes significantly more structured. Levels begin to hold, spreads remain tight, and option premiums start responding more cleanly to underlying movement. This is the first high-probability scalping window of the day.
Entries taken during this phase tend to be more reliable because the market has already revealed its initial direction and behaviour. Setups on the 1-minute and 5-minute charts become clearer, and execution becomes more consistent compared to the opening phase.
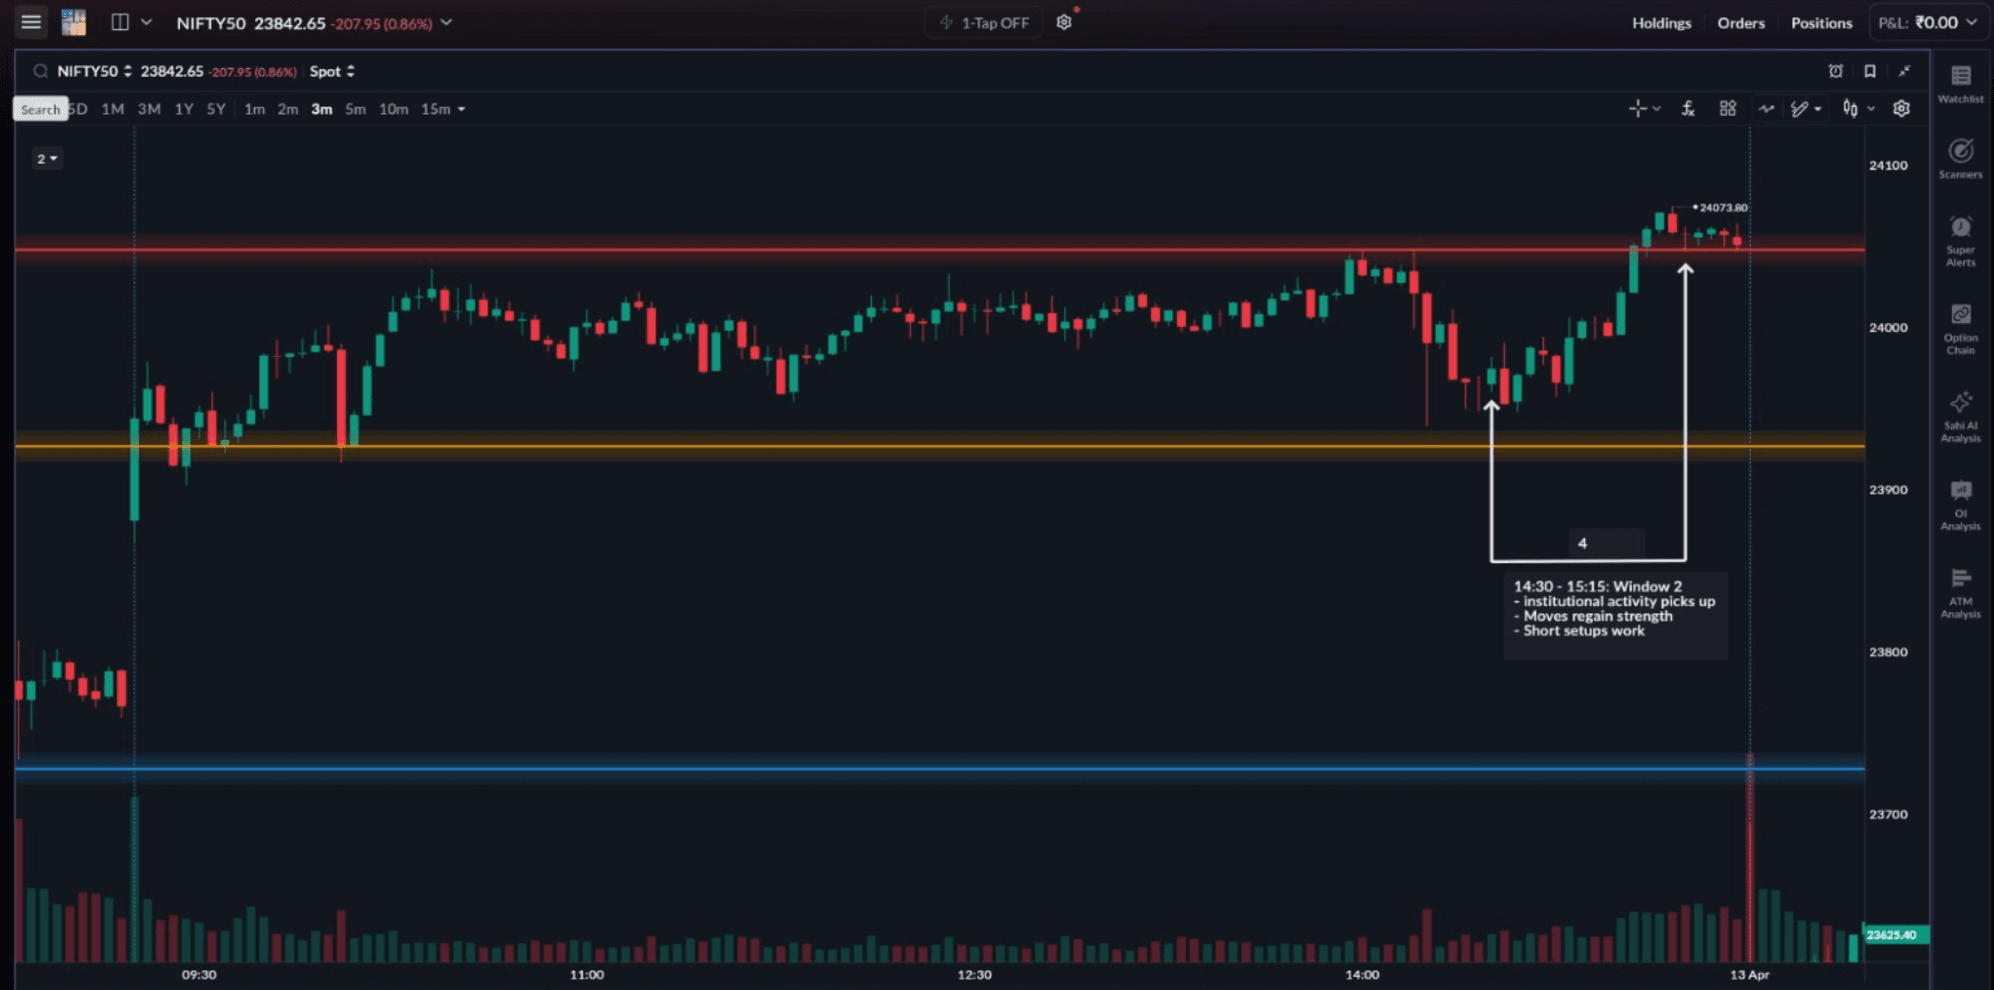
Window 2 — Pre-Close Hour: 2:30 PM to 3:15 PM
The final trading window appears in the last hour of the session. During this time, institutional activity increases as large participants adjust or close their positions before the market shuts. This brings back volume, tightens spreads, and often leads to quicker completion of price moves, which suits scalping.
However, options behave differently in this window. Time decay accelerates as the session approaches close, especially on expiry days. Option premiums can decline even if the underlying price does not move significantly. Because of this, option buying becomes riskier, while option selling strategies can benefit from the accelerated decay.
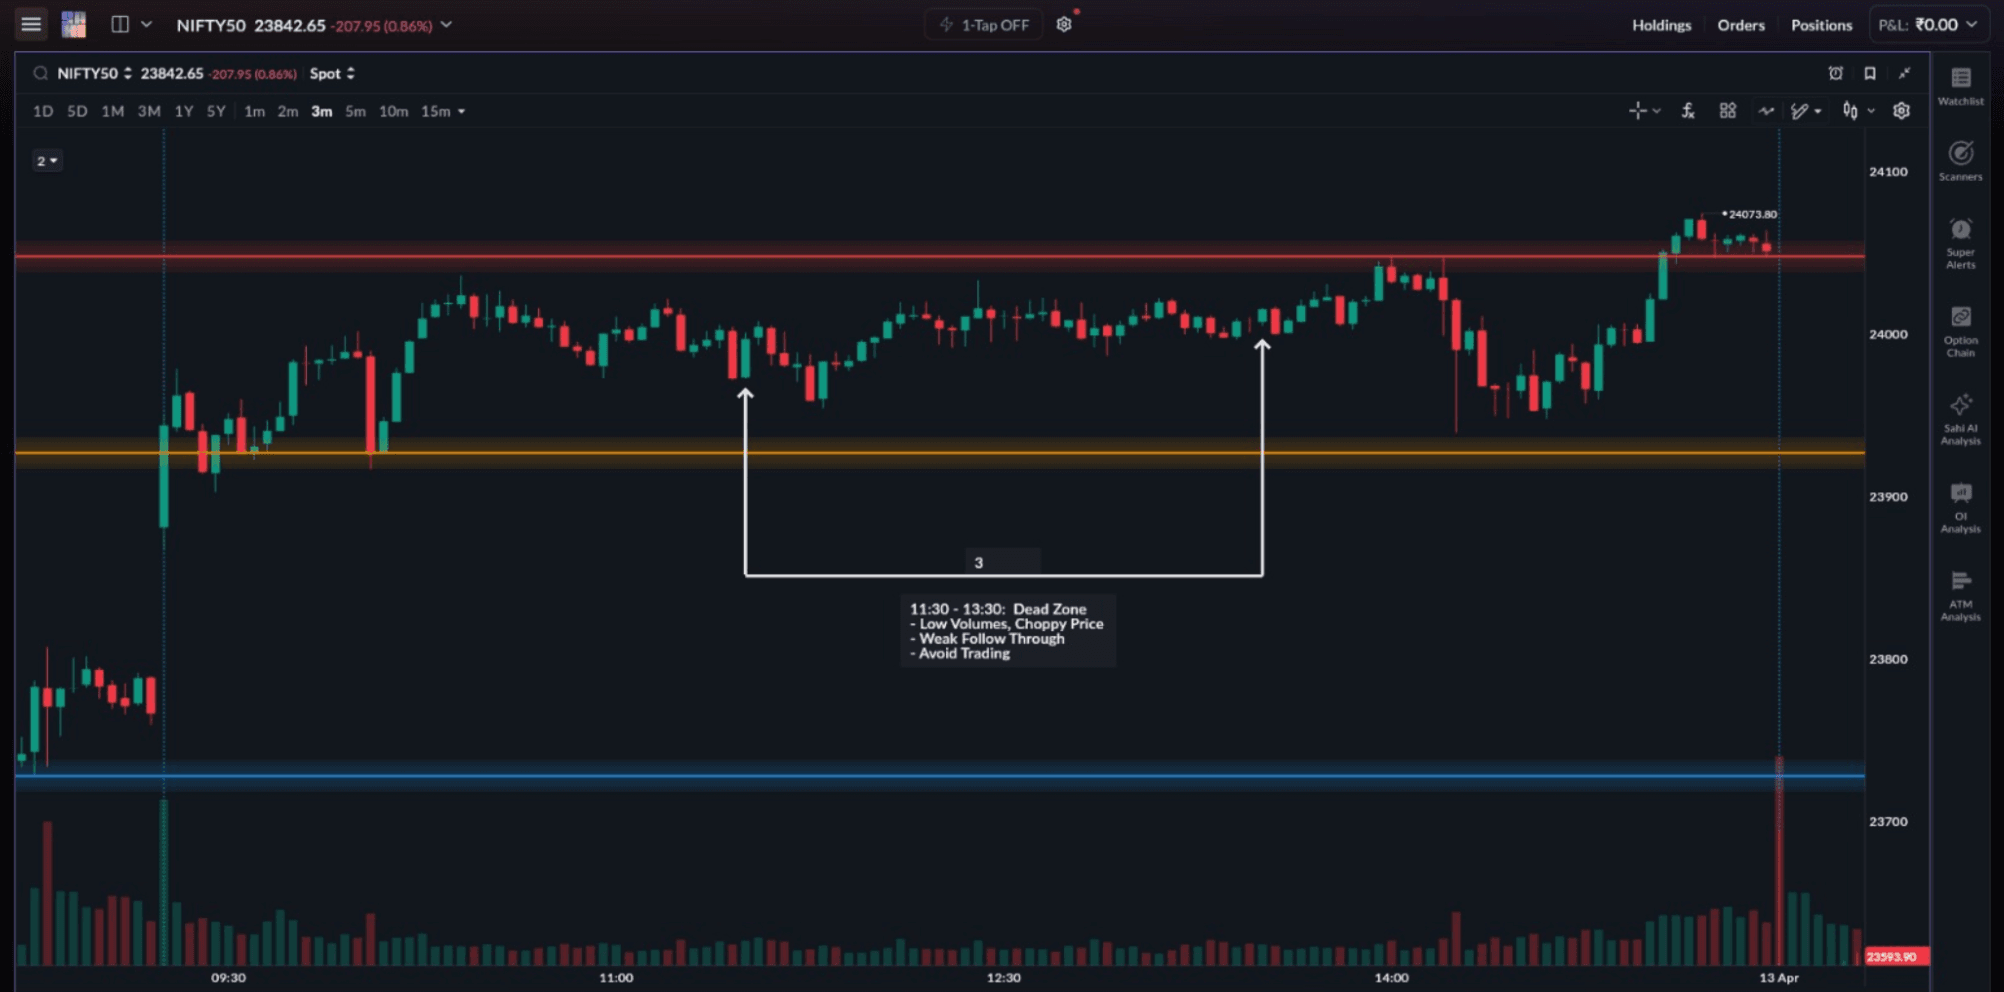
The Dead Zone: 11:30 AM to 1:30 PM
The midday session is usually the least productive phase for scalping. Volume drops, spreads widen, and price tends to move without clear direction. This creates a choppy environment where setups are harder to identify and even harder to execute consistently.
While trades are still possible, the quality of opportunities is significantly lower. For most scalpers, the cost of participating during this period, in terms of transaction charges, slippage, and mental fatigue, outweighs the potential gains. As a result, experienced traders often step away from the market during this time.
Expiry Days
Expiry days behave differently. OI positions are being closed throughout the session, which keeps gamma elevated. Option premiums can move sharply even when the underlying moves by just a few points. The entire session sees higher-than-normal activity, not just the two standard windows. Treat expiry days as higher-opportunity, higher-risk days, and size positions accordingly.
Time Window Summary Table
| Time | Suitability |
|---|---|
| 9:15 – 9:30 AM | Observe only. Too erratic for reliable setups |
| 9:30 – 10:15 AM | Best window. High volume, directional moves, clean setups |
| 10:15 – 11:30 AM | Moderate. Morning trend continuation possible but volume fading |
| 11:30 AM – 1:30 PM | Avoid. Choppy, wide spreads, low volume |
| 1:30 – 2:30 PM | Selective. Watch for range breakouts only |
| 2:30 – 3:15 PM | Good. Volume returns, institutional activity picks up |
| 3:15 – 3:30 PM | Avoid new entries. Last 15 minutes can be unpredictable |
Timeframes
Once you know when to trade, the next step is understanding how to read price during these windows.
Options scalpers in India typically work across two timeframes simultaneously:
- 5-minute chart: for market structure and direction
- 1-minute chart: for entry timing
The 5-minute chart helps you identify the trend, mark key support and resistance zones, and recognise whether a pattern is forming. This is where you build your bias.
The 1-minute chart tells you when to act. It helps you time entries, spot breakout candles and volume spikes, and place tighter stop-losses.
The rule: structure on the 5-minute chart, entry on the 1-minute chart.

Most false-signal trades happen when a scalper skips the 5-minute read and enters purely off a 1-minute signal without structural context.
Liquid Instruments
With timing and structure in place, the next consideration is what to trade.
Scalping works best in highly liquid instruments such as Nifty and Bank Nifty options. These contracts have tighter bid-ask spreads and consistent order flow, which allows for cleaner entries and exits.
Nifty and Bank Nifty options alone account for the majority of derivatives trading activity on the NSE, often comprising over 90% of total turnover. The exchange itself ranks among the largest derivatives markets globally by volume, which ensures deep liquidity and reliable execution for short-duration trades.
In illiquid options, spreads tend to be wider and price movement is uneven. Even if the setup is correct, execution becomes inconsistent due to slippage. For short-duration trades, this can distort both entry and exit, reducing the reliability of the setup.
For this reason, most scalping strategies are built around index options rather than individual stocks.
Trade Setups
Once you are trading the right instruments at the right time, the next step is identifying the types of setups that work in these conditions.
In scalping, the goal is not to memorise individual patterns, but to recognise the kind of setup forming at a key level. Most intraday setups fall into two categories: reversal and continuation, each reflecting a different type of price behaviour.
Reversal Setups
Reversal setups occur when price approaches a significant level and shows signs of changing direction. These setups typically form after an extended move and indicate exhaustion of the current trend.
Common reversal patterns include:
- Engulfing patterns
- Double Top and Double Bottom
- Head and Shoulders
- Morning and Evening Star
- Rejection-based candles at key levels
The following example shows how a reversal setup appears in real trading conditions when price reacts at a key level.
Trade 1 — Bearish Engulfing at SAHI Key Level: Nifty 50
SAHI’s Key Level Indicator identified a resistance zone near 24,034 on a 2-minute chart. Nifty had been making higher highs and higher lows through the session and was approaching this level with momentum. At 24,034, a bearish engulfing formed. The red candle closed at 24,034 with a low of 24,030.75.
| Parameter | Value |
|---|---|
| Pattern | Bearish Engulfing |
| Key Level (SAHI) | 24,034 |
| Entry | 24,030 (below engulfing low) |
| Stop-loss | 24,048 (above engulfing high) |
| SL Distance | 18 points |
| Target (1:4 R:R) | 23,958 |
| Exit | Near 23,960 |
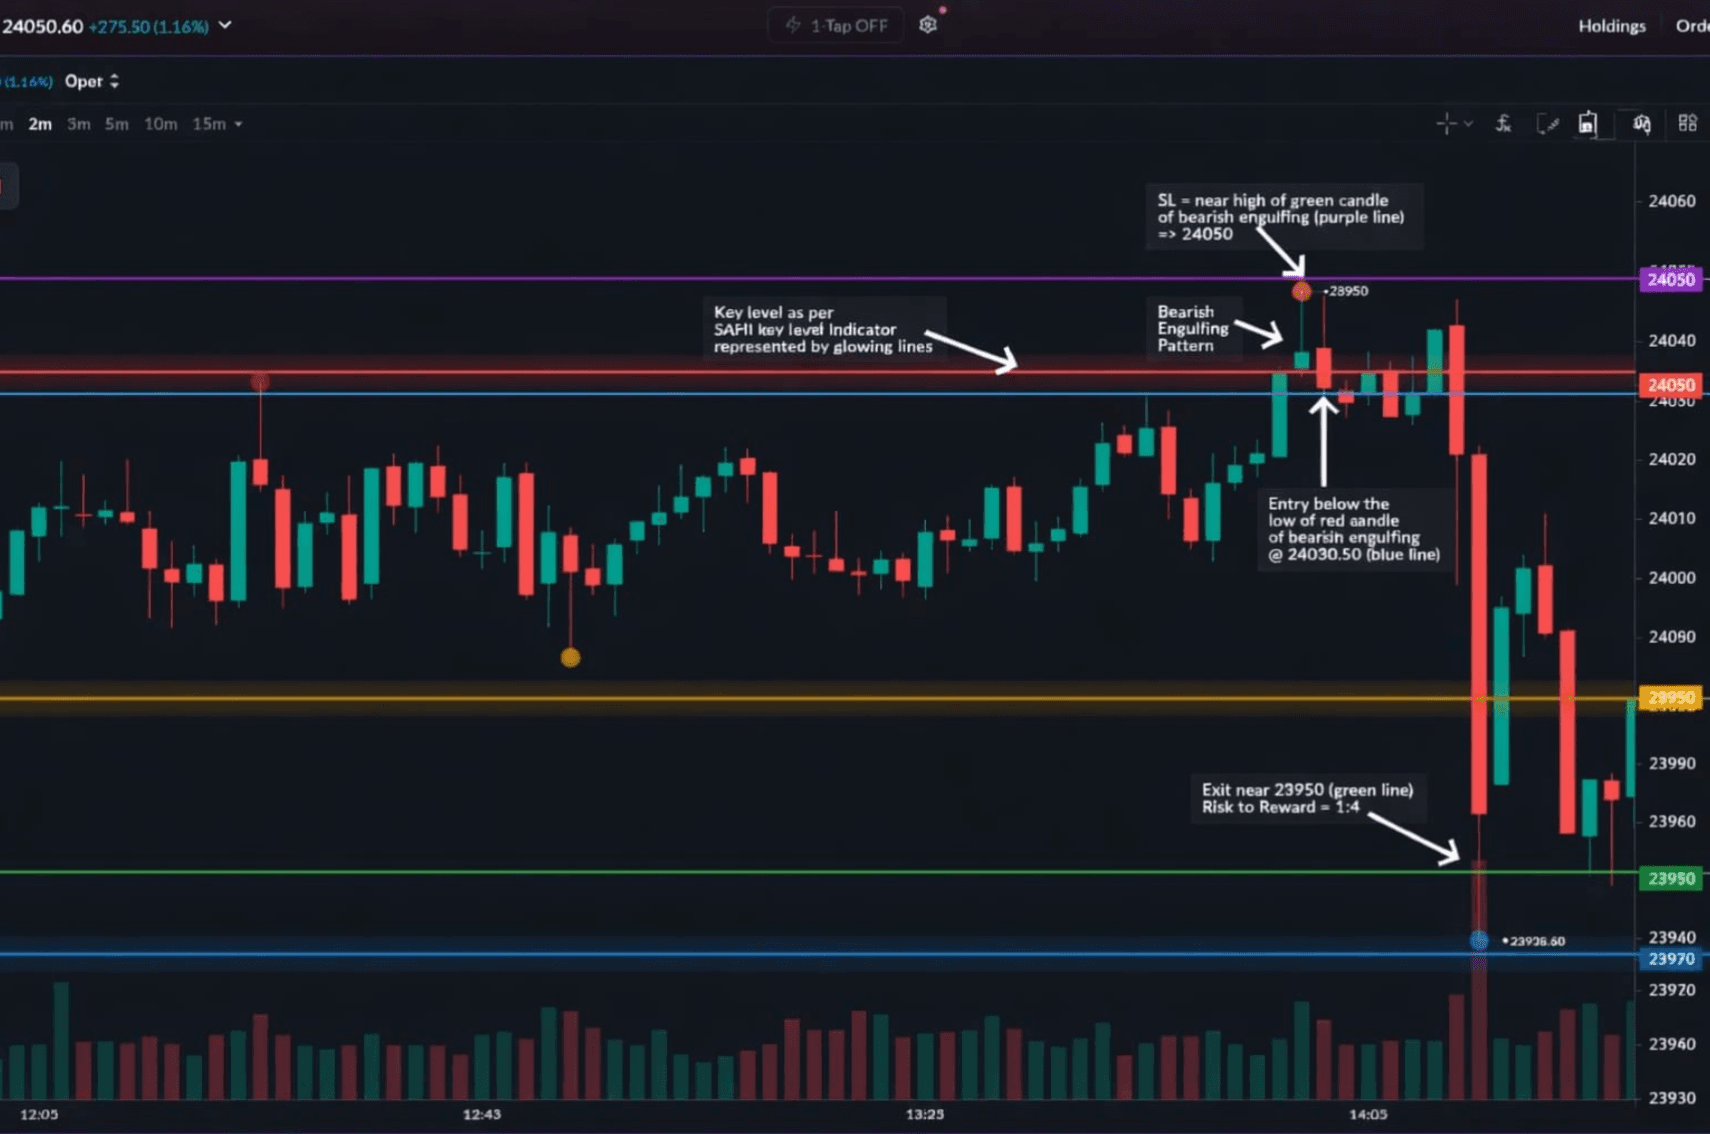
Without the SAHI Key Level Indicator marking this level, the pattern alone would have had little significance.
Continuation Setups
Continuation setups occur when price makes a directional move, pauses briefly, and then resumes in the same direction. These setups represent temporary consolidation before momentum continues.
Common continuation patterns include:
- Pennants
- Flags
- Triangles such as ascending, descending, and symmetrical
- Rectangles or range consolidations
- Short-term consolidation breakouts
- Continuation candles at key levels
The following example shows how a continuation setup forms after consolidation and leads to a breakout in the direction of the trend.
Trade 2 — Pennant Breakout with OI Support: Nifty 50
SAHI’s OI Support tool marked 24,000 as a strong support level, indicating significant put writing. The SAHI Key Level Indicator also confirmed 24,000 as an important level.
After a sharp move from below 24,000, price consolidated into a pennant just above this level for around 15 minutes. A breakout above the pennant confirmed continuation.
| Parameter | Value |
|---|---|
| Pattern | Pennant Breakout |
| OI Support Level | 24,000 |
| Key Level (SAHI) | 24,000 |
| Entry | 24,010 (above breakout candle high) |
| Stop-loss | 23,992 (below pennant low) |
| SL Distance | 18 points |
| Target (1:2.5 R:R) | 24,055 |
| Exit | Near 24,070 |
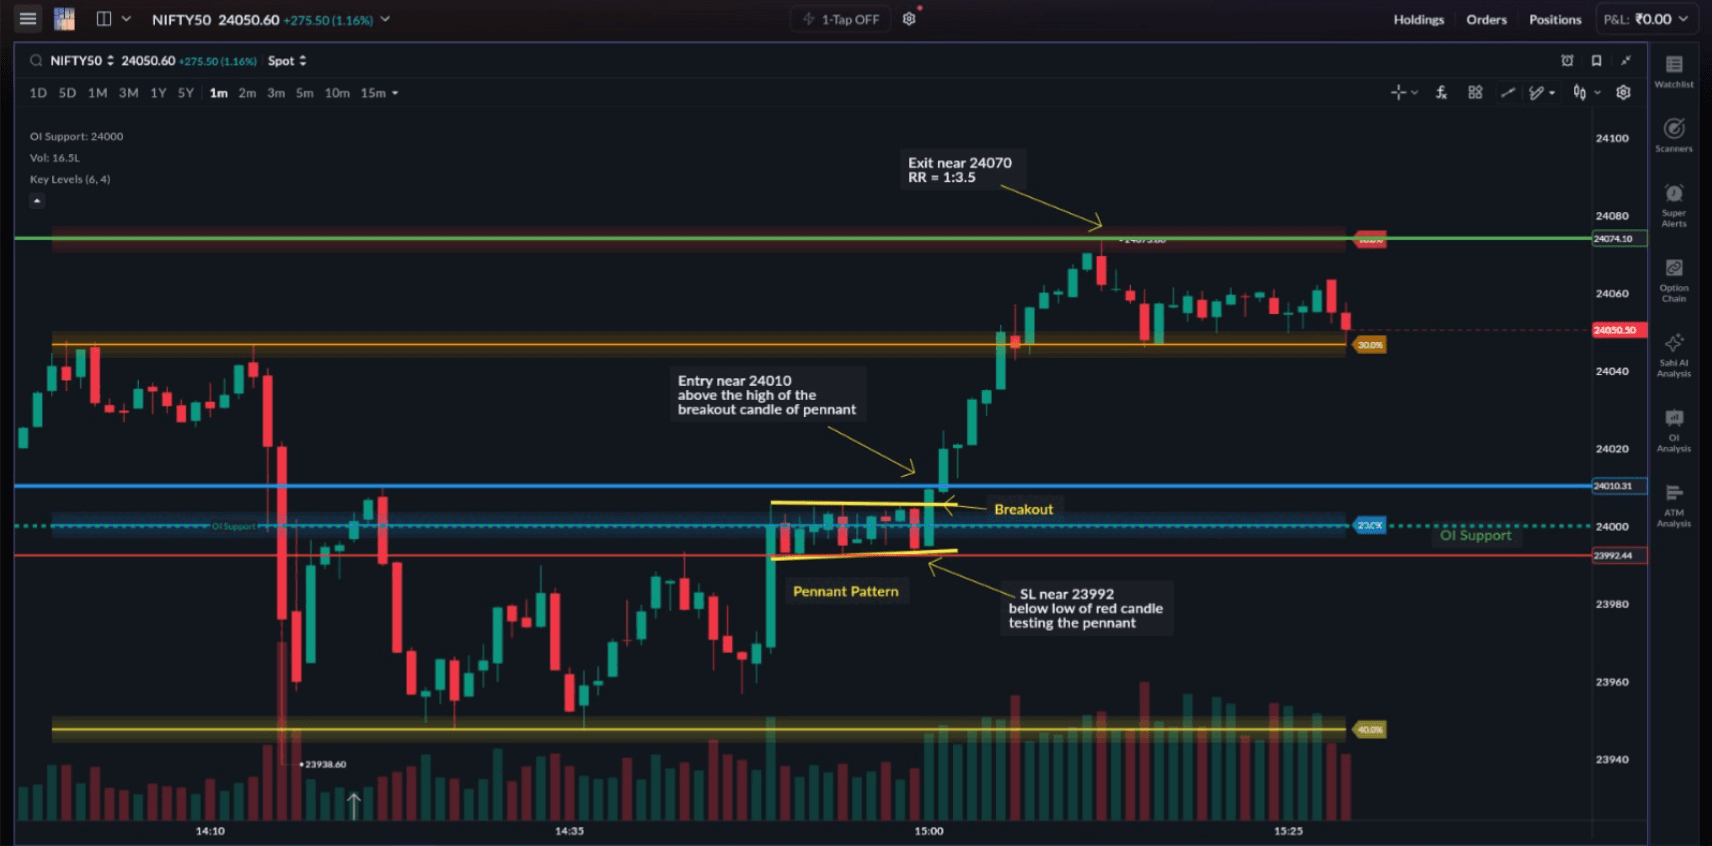
The strength of this setup comes from alignment. Both OI and key level confirmed the same zone, increasing the reliability of the breakout.
Risks and Limitations
While these setups work under the right conditions, it is equally important to understand where they can fail.
OI levels can shift quickly. Large institutional positions get unwound within minutes, especially around expiry. A level that showed strong put writing at 9:00 AM can look very different by 11:00 AM. Always place a stop-loss below your entry regardless of how strong the OI picture appears.
Candlestick patterns fail without volume confirmation. A bearish engulfing on low volume at a key level is a weaker signal than the same pattern with a volume spike. Always check the volume bar on the breakout or reversal candle. If volume is flat or declining, the pattern is less reliable.
The Dead Zone generates false setups. Between 11:30 AM and 1:30 PM, price movements can look like valid patterns on the chart but carry no follow-through. The same candlestick formation that works at 9:45 AM will often fail at 12:30 PM. The time window matters as much as the pattern.
Theta decay changes the math for option buyers on expiry days. On expiries, ATM premiums can erode ₹5–10 every 30 minutes in a flat market. A trade that works directionally can still lose money if held too long. Keep scalp durations under 15 minutes on expiry days where possible.
Transaction costs reduce net returns on repeated entries. Each scalp trade generates brokerage, STT, exchange charges, and GST. On a ₹50 premium move, total transaction costs can be ₹8–12 per lot. Enter only when the setup meets all conditions.
The goal is not more trades. The goal is better trades where timing, level, pattern, and confirmation align.
Test yourself
You have covered the trading windows, the patterns that matter, and how SAHI’s Key Level and OI indicators strengthen a setup. Check how well it has landed before the next chapter.
Scalping knowledge check
Do you know when and what to scalp?
Five quick questions on trading windows, timeframes, candlestick patterns, and OI levels. See where you stand and pick up an insight along the way.
 5 questionsUnder 5 minutes
 Instant score