
Reading the Option Chain for Scalping
Charts show price action. The option chain shows how market participants are positioned. How scalpers use OI, Change in OI and Volume to build bias, find levels and validate setups.
 12 minutes read|
Charts show price action. The option chain helps explain how market participants are positioned. Used together, they give a more complete view of the market before a scalp trade is placed.
Why Option Chain Matters
Most scalpers rely primarily on charts, and that is a reasonable starting point. But charts only show how price is moving. They do not show the positioning behind that move.
That is where the option chain becomes useful.
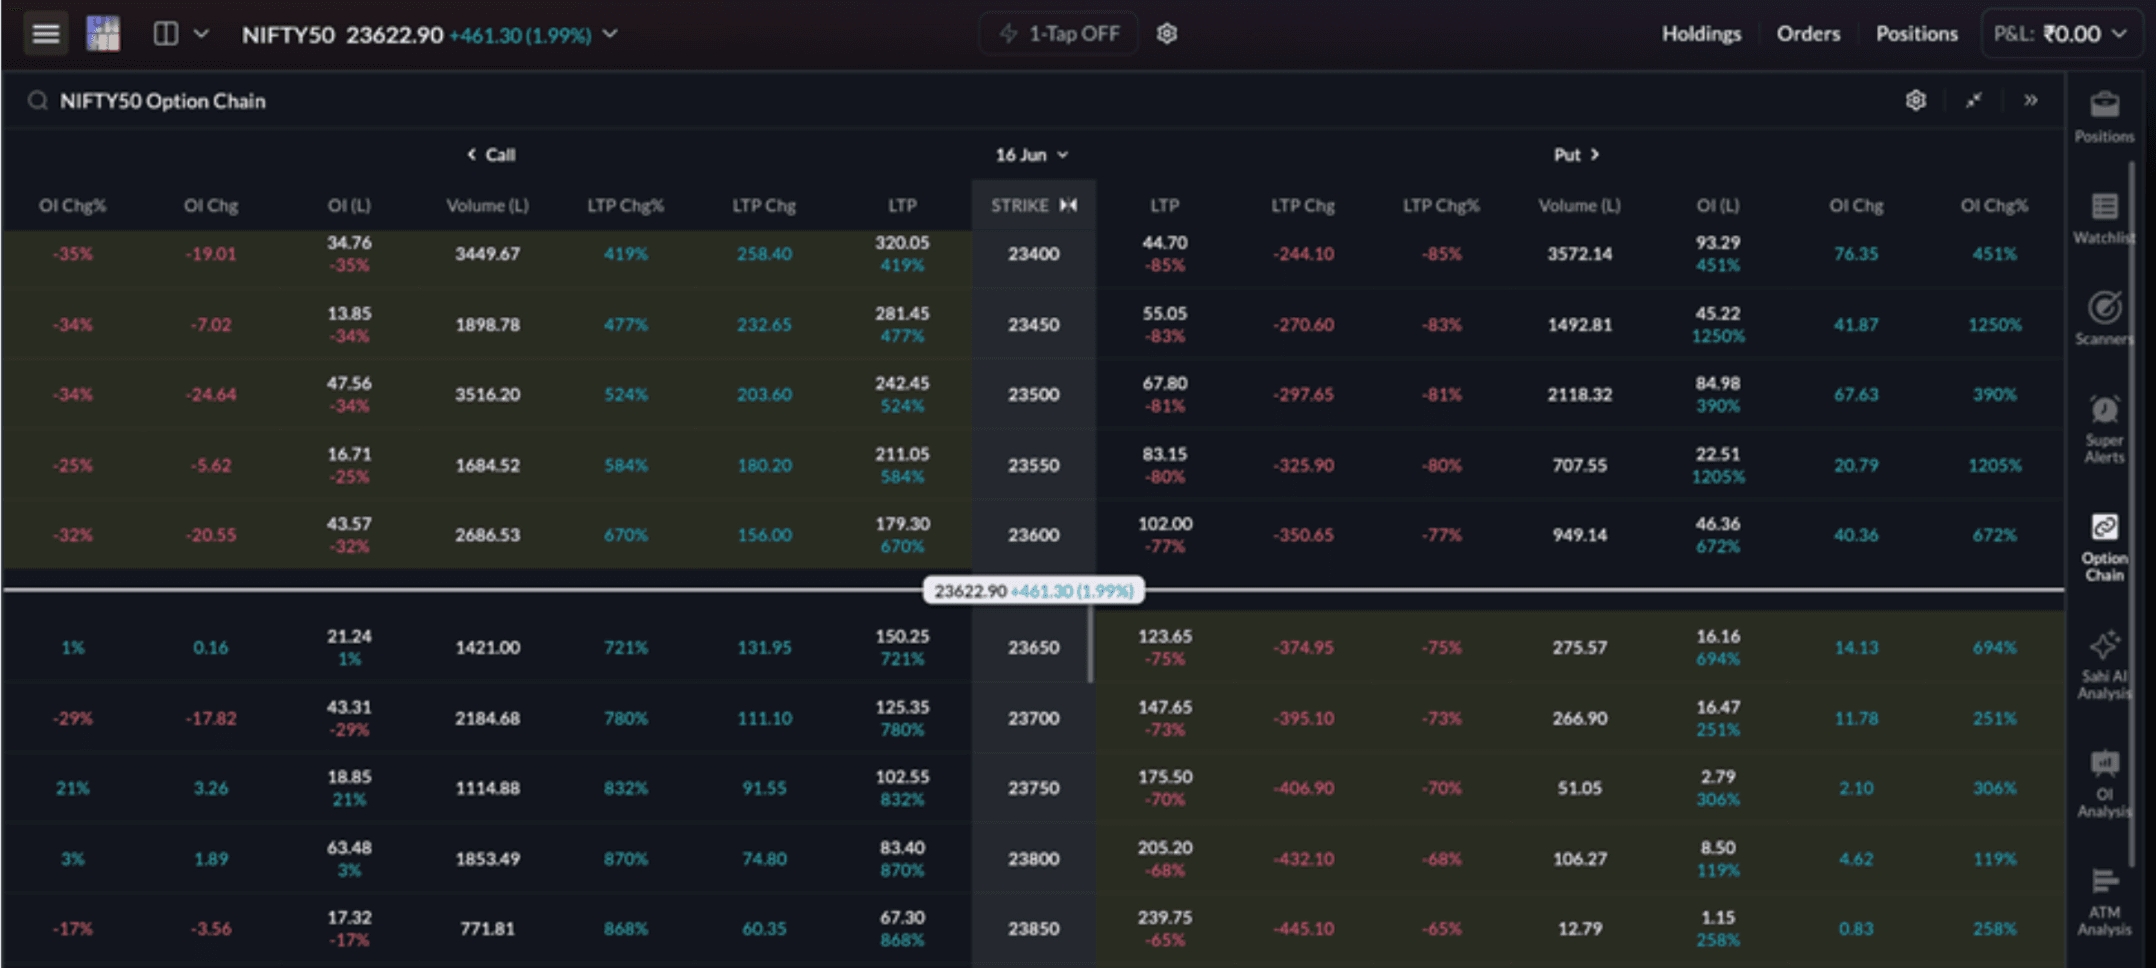
The option chain provides a real-time view of activity across strike prices. It shows where traders are most active, where positions are being built, and where they are being unwound.
For a scalper, the option chain should not replace price action. It should be used as an additional layer of confirmation.
Among the many columns available in the option chain, a few are especially useful for intraday decision-making:
- Open Interest (OI)
- Change in OI
- Volume
These are usually enough to understand participation and positioning during the session. Throughout this chapter, we will focus only on the parts of the option chain that directly support intraday scalping decisions.
Lesson to Learn
- Charts show price movement, while the option chain shows positioning
- OI and Volume help identify areas of market interest
- Option chain works best as a confirmation tool, not a standalone signal
Using OI to Develop a Market Bias
Before searching for trade setups, it helps to first develop a working bias for the session. One practical way to do this is by observing how OI changes around the market’s opening strike price.
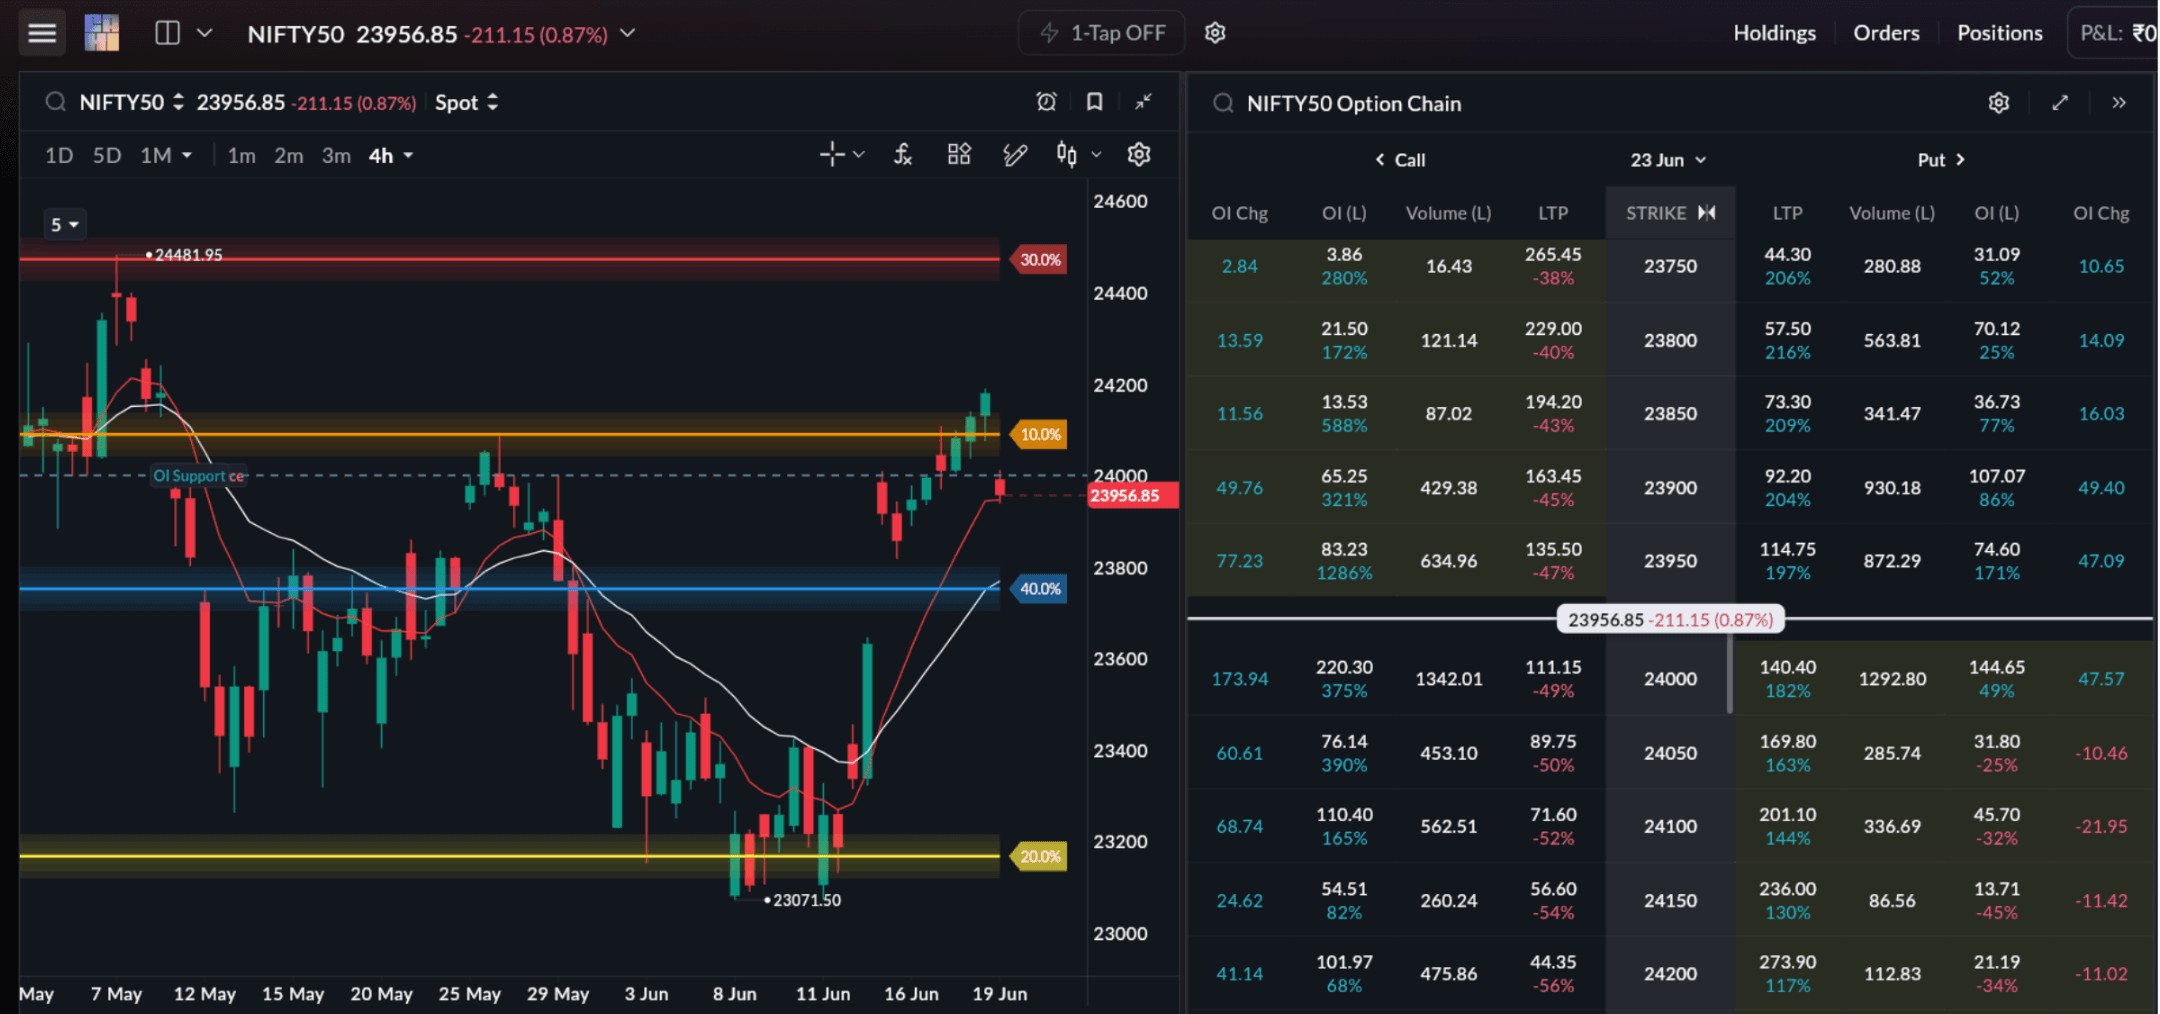
We will refer to the strike closest to the opening market price as the Reference Strike.
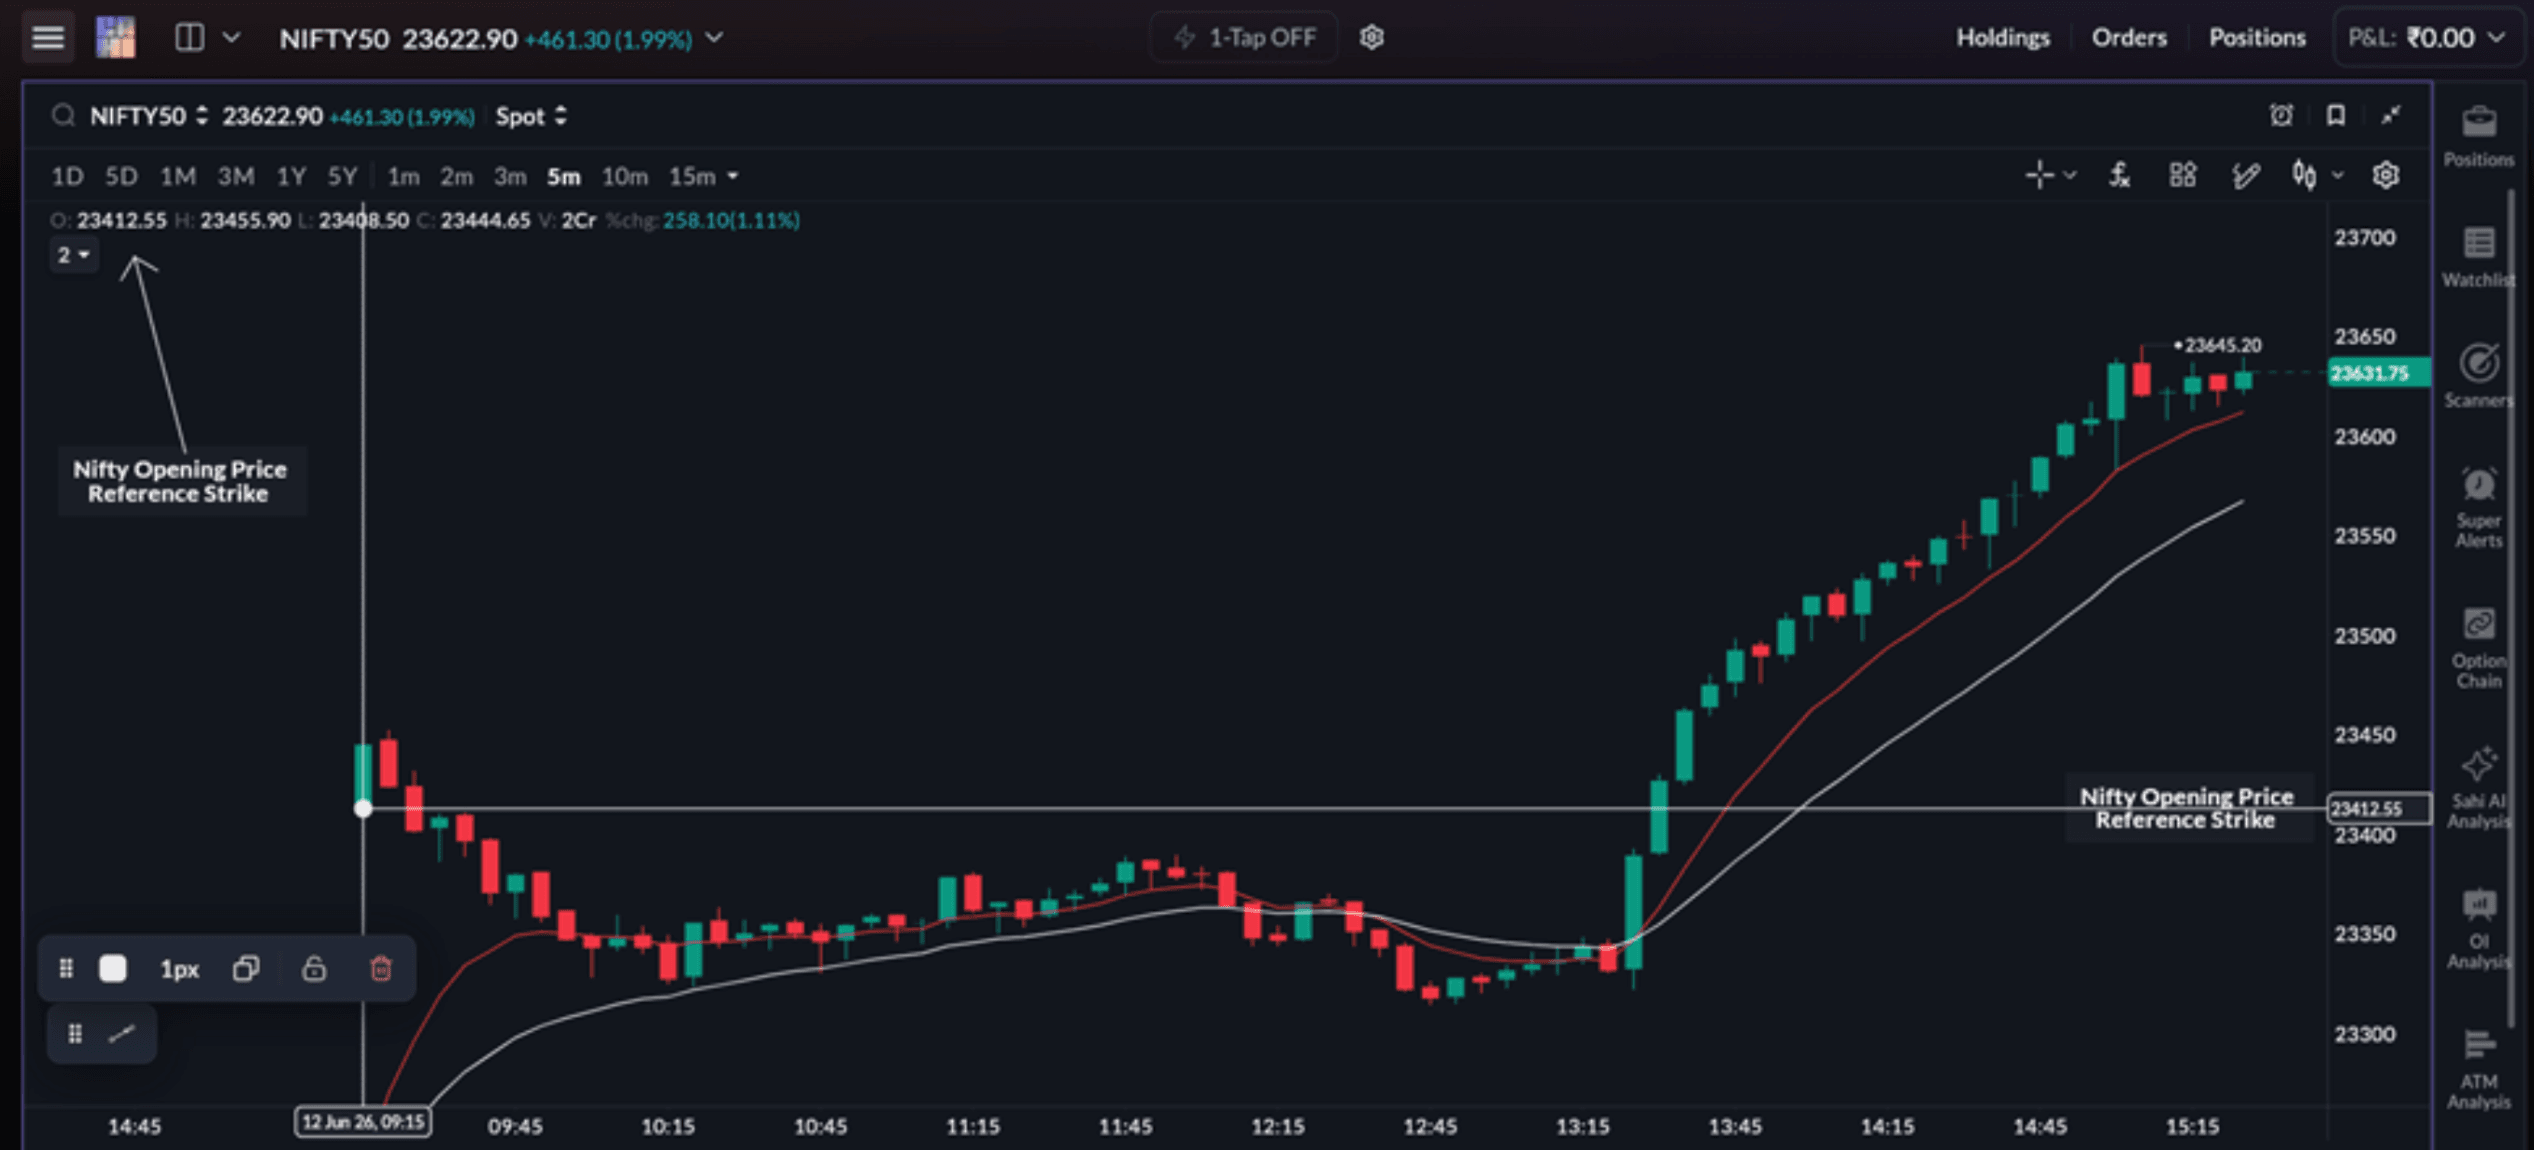
By comparing the change in Call OI and Put OI at the Reference Strike, traders can develop a bullish, bearish, or neutral bias for the day.
The objective is not to predict exact price levels. It is to identify which side of the market is attracting stronger participation.

| Change in Call OI | Change in Put OI | Interpretation | Market Bias |
|---|---|---|---|
| Increasing | Decreasing | Call writing increasing, Put support weakening | Bearish |
| Decreasing | Increasing | Put writing increasing, Call resistance weakening | Bullish |
| Increasing | Increasing | Both sides building positions | Range-bound / Neutral |
| Decreasing | Decreasing | Position unwinding on both sides | Uncertain |
On June 12, 2026, NIFTY opened near 23412, so the 23400 strike became the Reference Strike. After the first hour, the development around the Reference Strike looked like this:
| Development Around the Reference Strike (23400) | Value |
|---|---|
| Change in Call OI | -19.01 lakhs |
| Change in Put OI | +76.35 lakhs |
This indicates:
- aggressive put writing at 23400 and call writers reducing positions
- support strengthening below price and resistance weakening above price
The positioning suggests a bullish intraday bias, as market participants appear more comfortable defending lower levels than resisting higher ones.
OI as Support and Resistance
One of the most practical uses of the option chain is identifying possible support and resistance zones. Large concentrations of OI often create these levels.
In simple terms:
- Highest Put OI often acts as a support zone
- Highest Call OI often acts as a resistance zone
This happens because traders holding large option positions often defend these areas. As price approaches such levels, reactions become more noticeable.
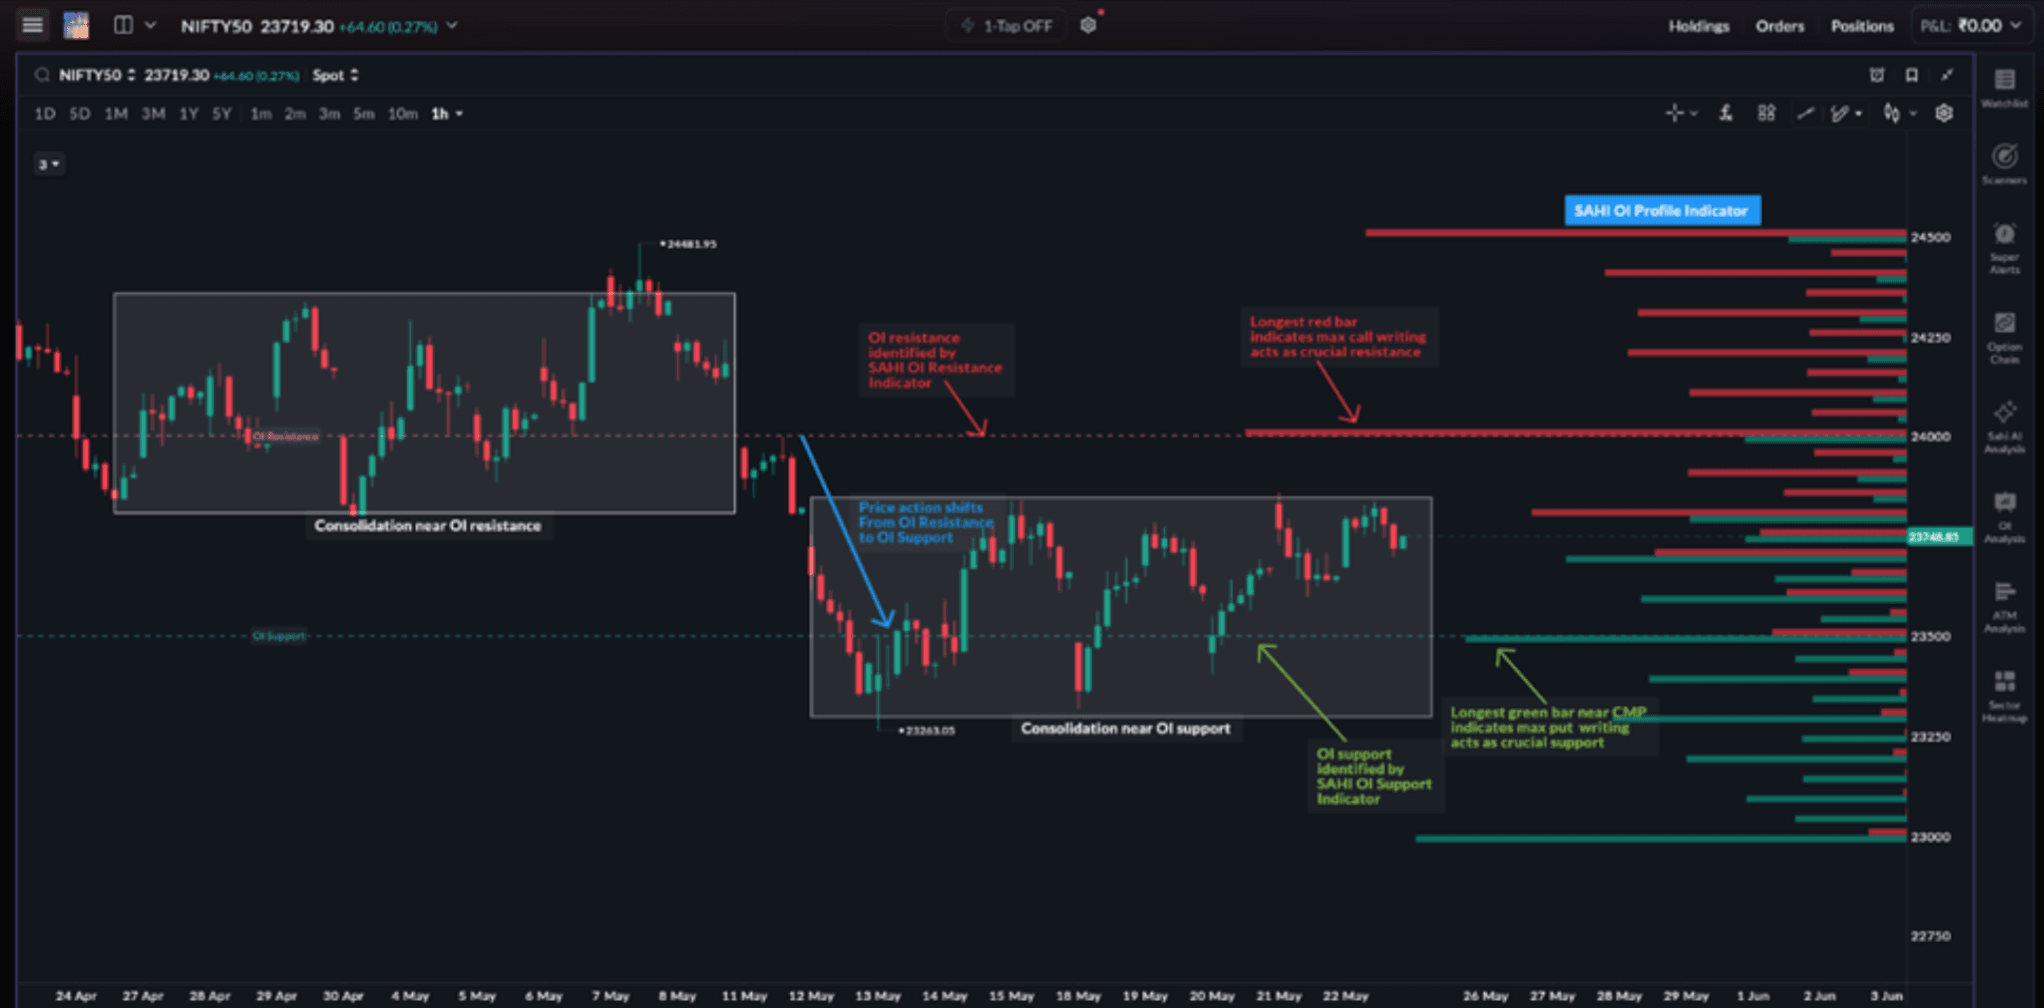
Traders can identify these levels directly from the option chain, but SAHI makes the process easier through its automated OI Profile and Support & Resistance Indicator, which marks the strongest positioning zones directly on the chart.
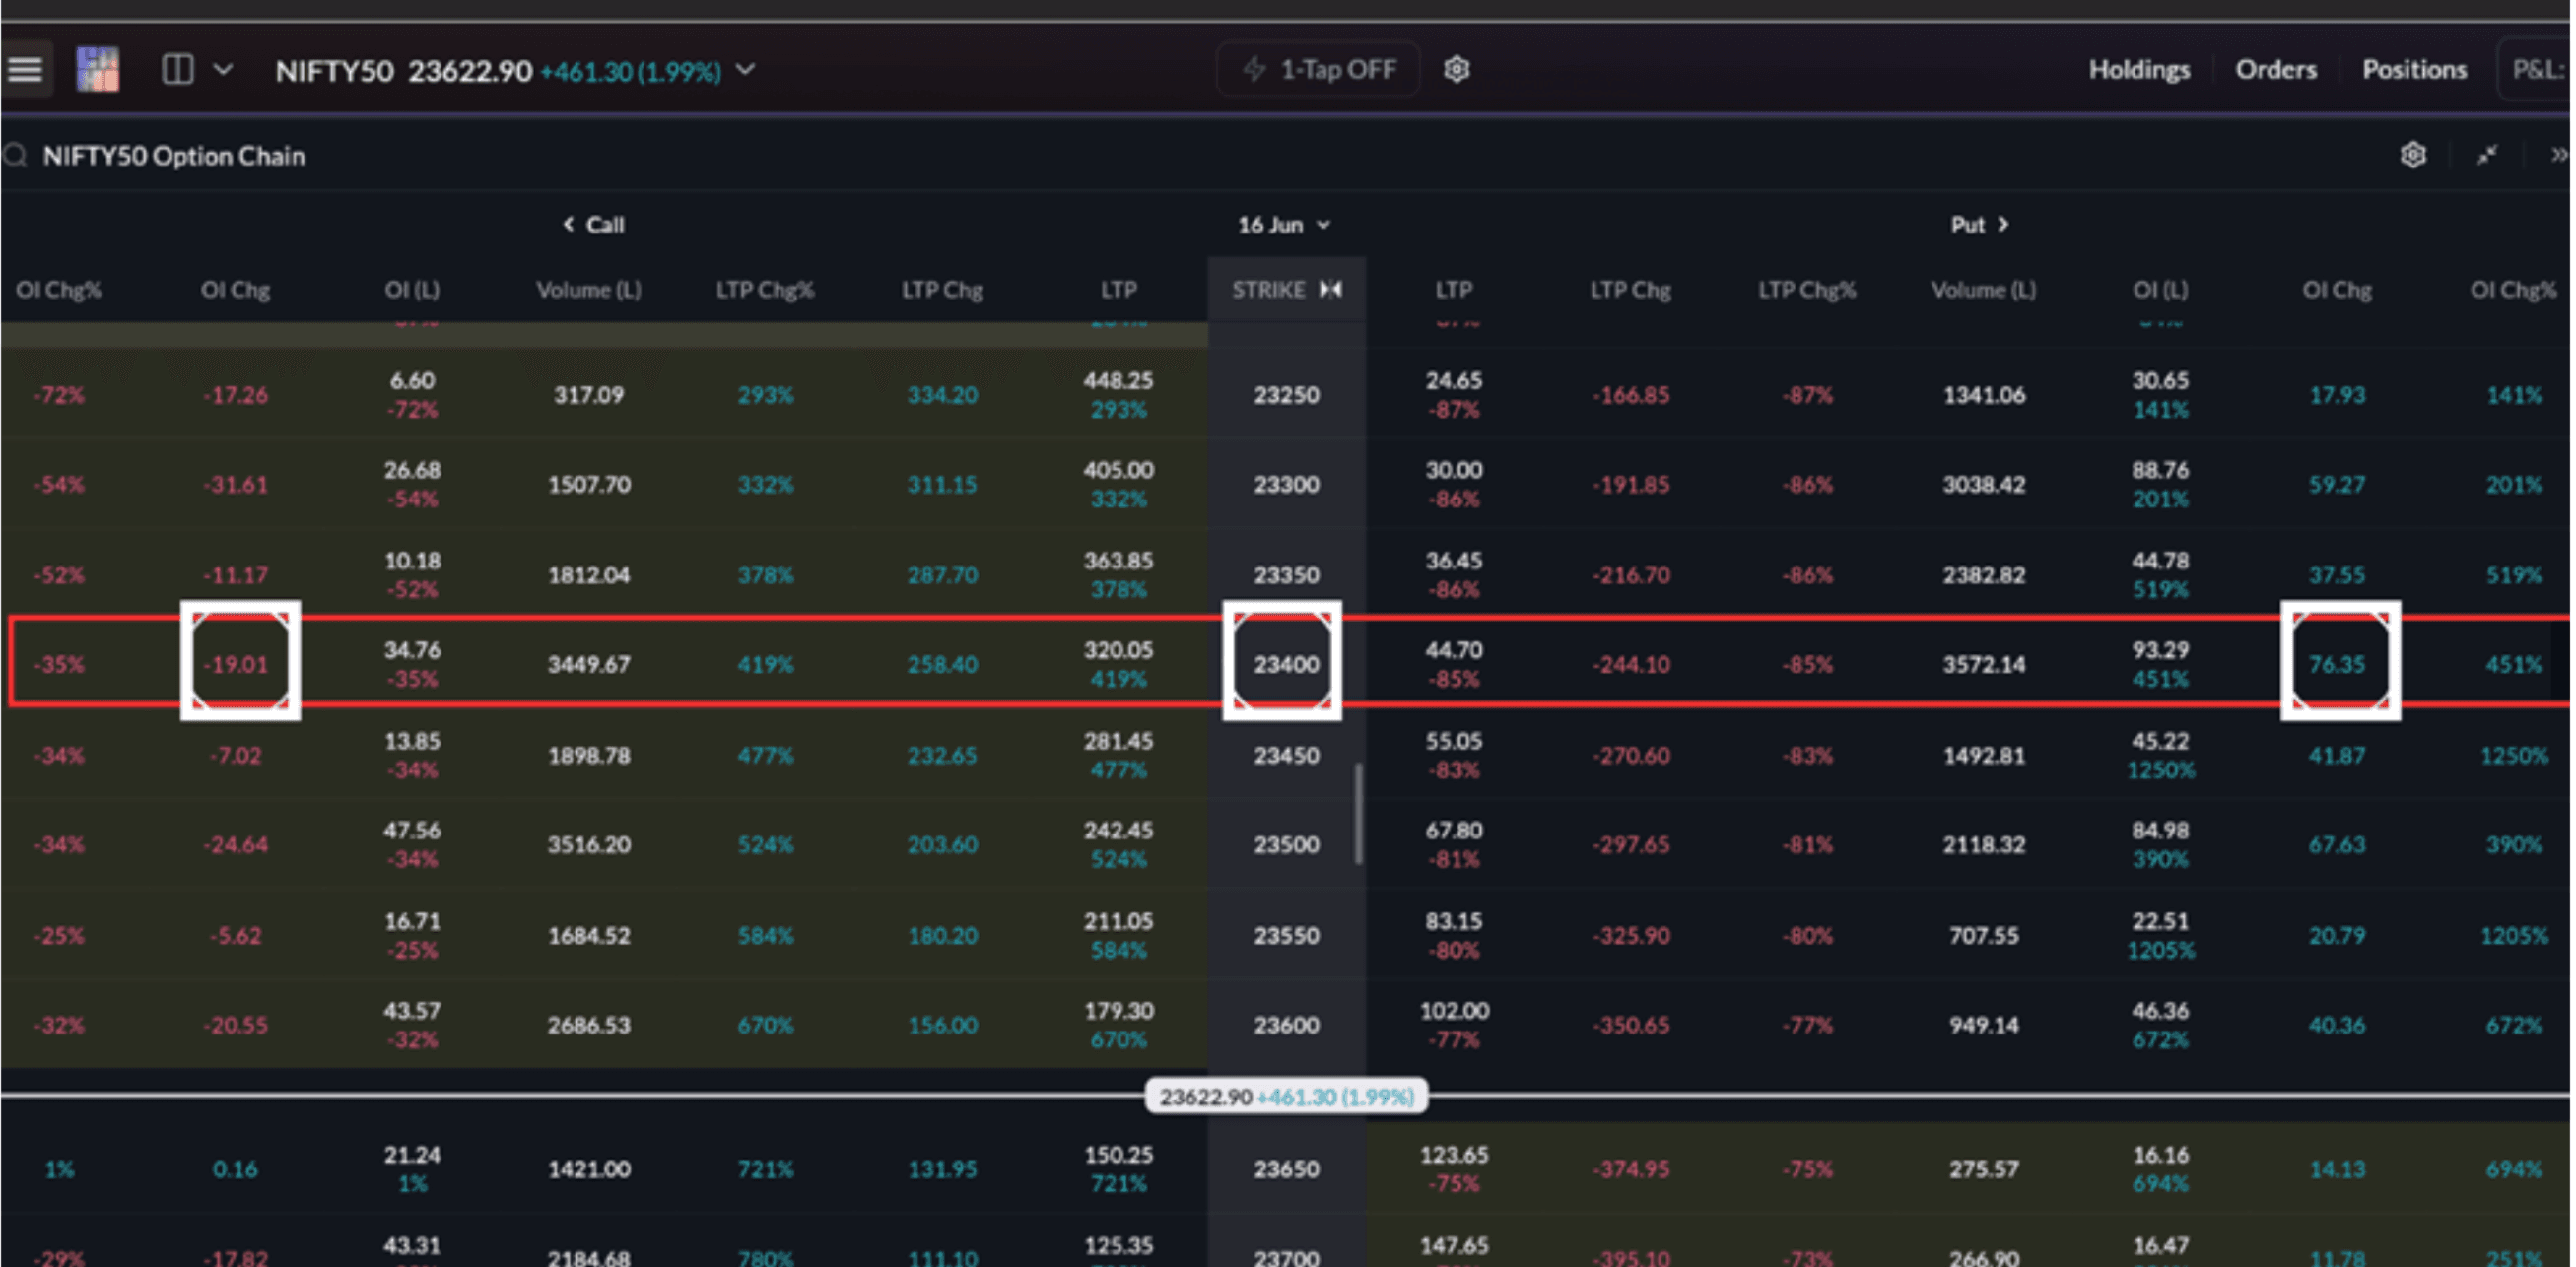
In the example below, the indicator identifies:
- OI Resistance near 24,000
- OI Support near 23,500
These levels correspond to strikes with the strongest option-writing activity and therefore represent areas where price is likely to react.
Lesson to Learn
- Highest Put OI often represents support
- Highest Call OI often represents resistance
- OI zones should be treated as areas of interest, not absolute barriers
OI Shifts During the Session
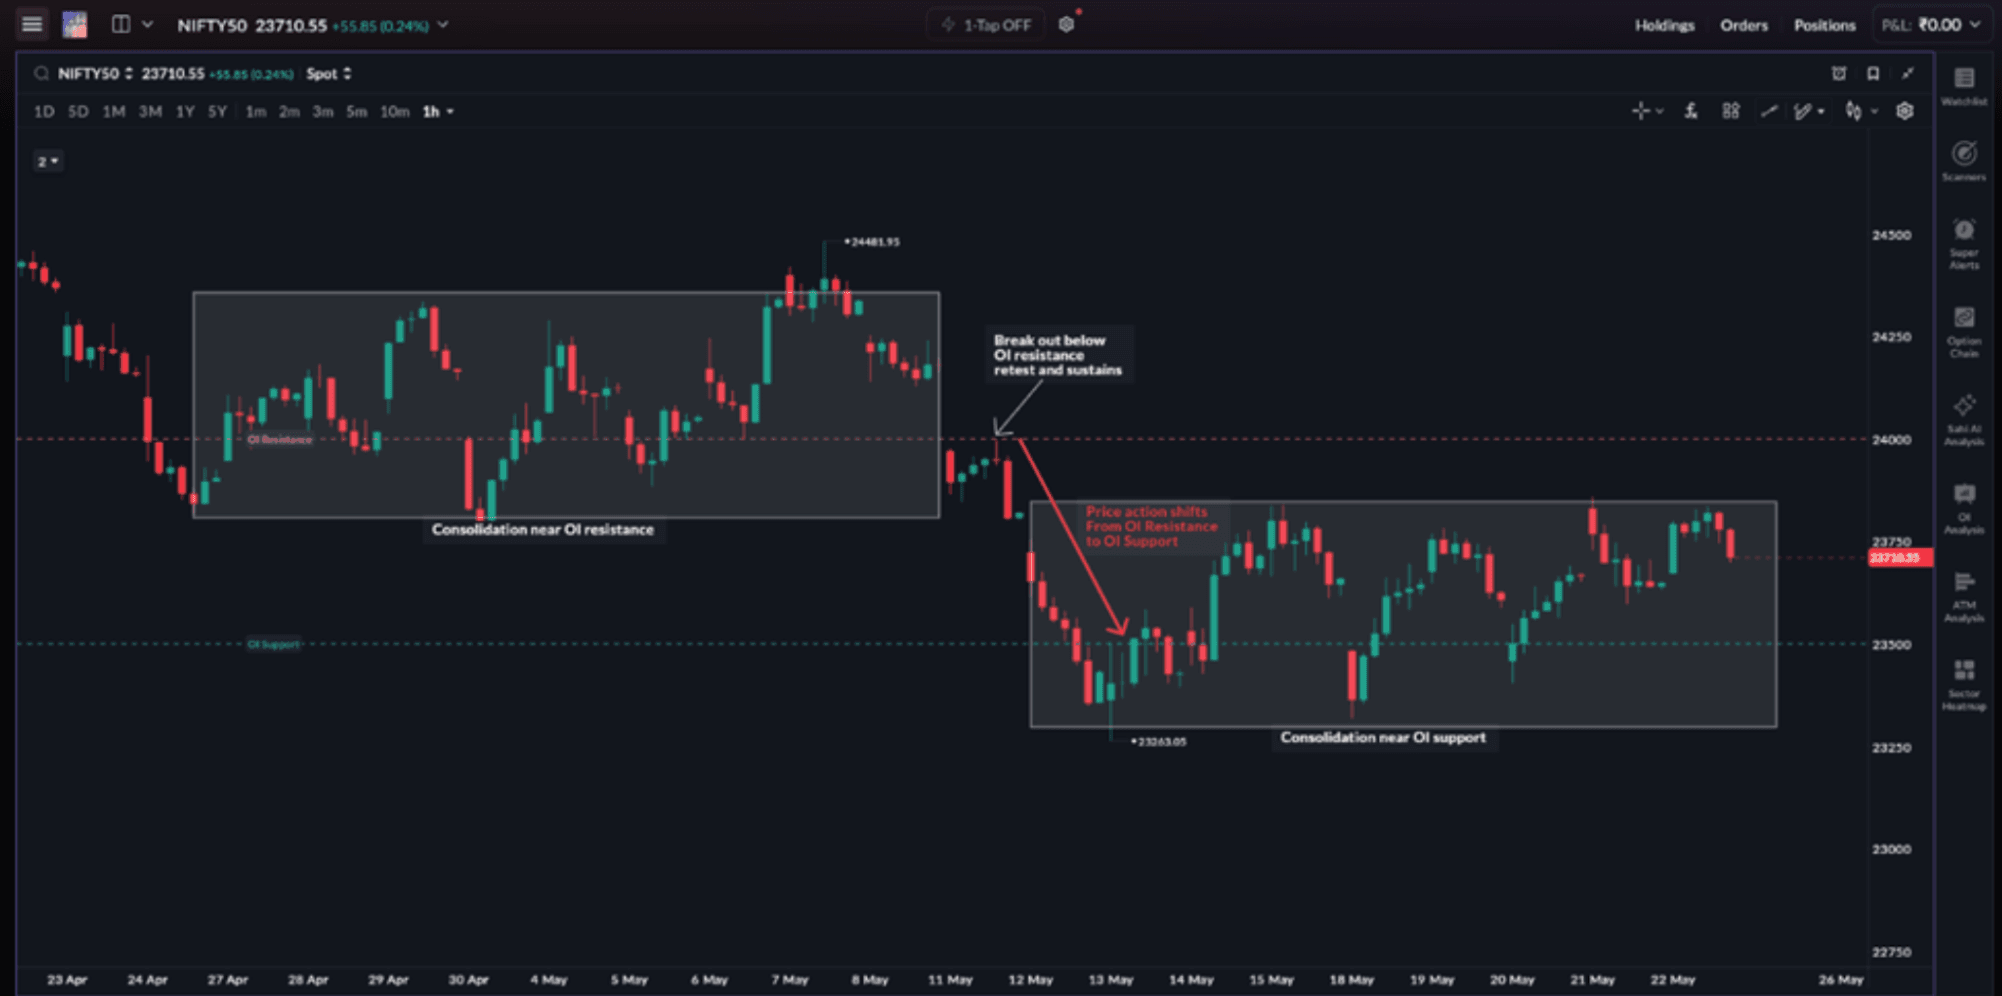
Many traders make the mistake of treating OI levels as fixed throughout the day. In reality, OI changes continuously as positions are added, reduced, or shifted.
What this means in practice:
- a level that showed the highest Put OI at 9:30 AM may not hold that position by 12:00 PM
- as price moves, participants often shift positions to strikes closer to the current market
- a sharp directional move can cause rapid unwinding at one strike and fresh build-up at another
These shifts are not random. They usually reflect changing expectations. When the highest OI level shifts meaningfully during the session, it often suggests that the dominant expectation for the day is changing as well.
For example, at market open:
- Highest Put OI = 25,000
- Highest Call OI = 25,200
A few hours later:
- Put OI shifts to 25,100
- Call OI shifts to 25,300
This suggests that traders are adjusting expectations. The market structure itself may not have changed much, but positioning has. Tracking these shifts helps traders understand whether support and resistance levels are strengthening, weakening, or moving.
Rather than relying on a single snapshot of OI, scalpers should monitor how OI evolves throughout the session.
| Call OI (L) | Call OI Updated | Put OI (L) | Strike | Put OI Updated | Interpretation |
|---|---|---|---|---|---|
| 48.06 | 39.61 | 112.54 | 23,800 | 67.15 | Both Call and Put OI reduced, indicating unwinding around the strike |
| 41.79 | 33.74 | 69.24 | 23,850 | 35.29 | Reduction on both sides, suggesting weaker conviction near current price |
| 149.97 | 95.03 | 96.66 | 23,900 | 49.17 | Heavy positions remained, but fresh participation slowed considerably |
| 261.38 | 188.35 | 53.95 | 24,000 | 42.62 | Largest Call OI remained intact, keeping 24,000 as the primary resistance zone |
Lesson to Learn
- OI levels are dynamic, not static
- Position shifts often reveal changing expectations
- Monitoring OI movement can provide additional context during the session
Reading OI Build-Up
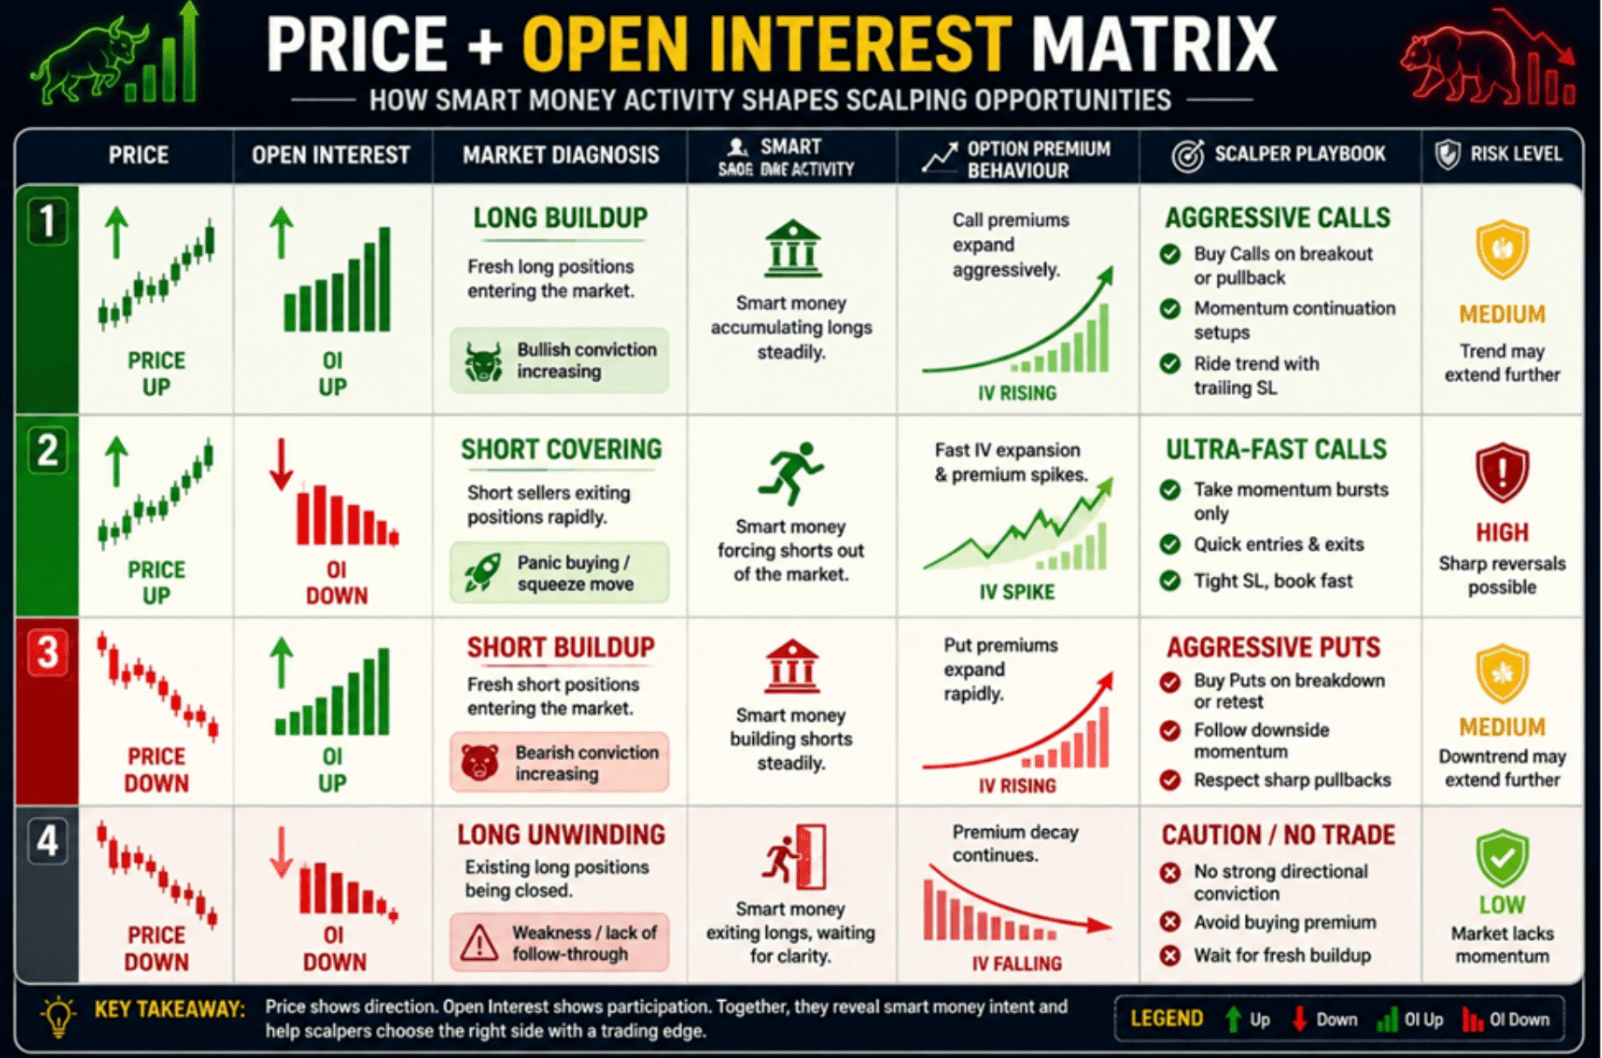
Beyond support and resistance, OI also helps traders understand whether a move is attracting participation.
A move supported by increasing participation is usually stronger than a move happening without it.
One of the most useful relationships in the market is the interaction between price and OI.
Lesson to Learn
- OI helps determine whether participation supports the move
- Stronger moves are often accompanied by fresh positioning
- Price and OI should be analysed together, not independently
Using OI to Validate Trade Setups
Once a directional bias has been established, the option chain can be used to evaluate individual trade opportunities. At this stage, the objective is no longer to decide whether the market is broadly bullish or bearish. The objective is to determine whether a specific setup is supported by positioning.
A simple workflow is:
- Identify key OI support and resistance levels
- Map those levels onto the chart
- Observe how price behaves around them
- Monitor whether OI is strengthening or weakening
- Confirm the setup using price action and indicators
Practical Use in a Trade
The most effective approach is to combine everything learned so far. A typical workflow may look like this:
- Identify important OI levels from the option chain
- Map those levels onto the chart
- Analyse price action around those levels
- Confirm momentum using indicators
- Select the appropriate strike
- Execute only when the factors align
Notice that the option chain is only one part of the decision-making process. It provides context. The trade itself still comes from the combination of structure, positioning, volatility, and execution.
- Use OI to validate trade ideas, not create them blindly
- Strong setups often align price action, positioning, and momentum
- Option chain analysis works best when combined with chart-based confirmation
When OI Can Mislead
Although OI is useful, it is not perfect. Like every trading tool, it has limits.
There are situations where OI interpretation becomes less reliable:
- sudden expiry-day volatility
- low-volume strikes
- temporary intraday spikes in OI
- major news events causing rapid repositioning
Strong OI levels can fail. Heavy resistance can break. Support can disappear. This usually happens when momentum and volatility become strong enough to overwhelm existing positioning.
OI should never be treated as a prediction tool. It is a contextual tool. Price remains the final decision-maker.
Lesson to Learn
- OI provides probabilities, not certainty
- Strong levels can still fail during high-momentum conditions
- Price action always deserves greater priority
What to Avoid
Option chain data is most useful when it is treated as a supporting input. Problems begin when traders start treating it as a primary signal or a predictive tool.
Common mistakes to avoid when using the option chain for scalping:
- Over-relying on Put-Call Ratio (PCR): PCR can indicate broad sentiment, but it lacks the precision needed for intraday scalping decisions. Acting on PCR alone without looking at actual OI distribution often leads to weak entries.
- Using OI as a standalone signal: A high OI level at a strike does not mean price will definitely reverse there. It only means there is positioning there. The reaction still needs confirmation from price action.
- Ignoring price action: If price has already broken through a major OI level with conviction, holding the opposite view only because the OI level still looks strong is a mistake.
- Reacting to every small OI change: OI fluctuates throughout the session. Small intraday changes at individual strikes are not actionable. The focus should remain on meaningful shifts at the largest concentration zones.
Lesson to Learn
- Avoid treating OI as a prediction tool
- Price action remains the primary source of information
- Significant changes matter more than small fluctuations
From Market Positioning to Complete Execution
The option chain helps explain positioning, momentum, and market intent during a trade. But successful scalping requires more than understanding OI. It requires combining market structure, volatility, Greeks, indicators, strike selection, execution, and risk management into one workflow.
The final chapter brings these concepts together through a complete NIFTY scalping framework using SAHI.
Test yourself
Check how well you understood reading the option chain for scalping.
Investor knowledge check
How well do you understand the markets?
Five quick questions on using OI, Change in OI and the option chain during live sessions.
 5 questionsUnder 3 minutes
 Instant score