
Putting It All Together: Building and Executing a Scalping Trade on SAHI
The complete scalping workflow on SAHI: pre-market preparation, combining price action with the option chain, strike selection, bracket-order risk management, live trade management and post-trade review, all inside one example trade.
 14 minutes read|
Every previous chapter looked at one part of the puzzle: mindset, risk, timing, Greeks, market context, indicators, mistakes, and the option chain. This chapter brings all of that into a single live trade, from the moment the workspace is opened to the moment the trade is reviewed, using SAHI’s tools end to end.
Objective: Apply all concepts from the series in one complete scalping workflow using SAHI’s tools, and understand how market context, indicators, option chain analysis, execution, and risk management come together during a live trade.

Why This Chapter Matters
Every chapter so far has added one layer to the framework: mindset and discipline (Chapter 2), risk and money management (Chapter 3), timing and chart structure (Chapter 4), Greeks (Chapter 5), market context and Vega (Chapter 6), indicators (Chapter 7), common failure patterns (Chapter 8), and the option chain (Chapter 9).
This chapter puts all that we have learned so far in the series to work inside one trade setup. The goal here is to show how decisions are structured before, during, and after execution.
Focus areas:
- preparation
- execution
- trade management
- discipline
- review process
Setting Up the SAHI Workspace
Before the session begins, the workspace should be organised for fast and efficient execution.
Core panels you may want to keep on:
- Nifty chart
- Option chart
- Option chain on the same screen
- Order panel
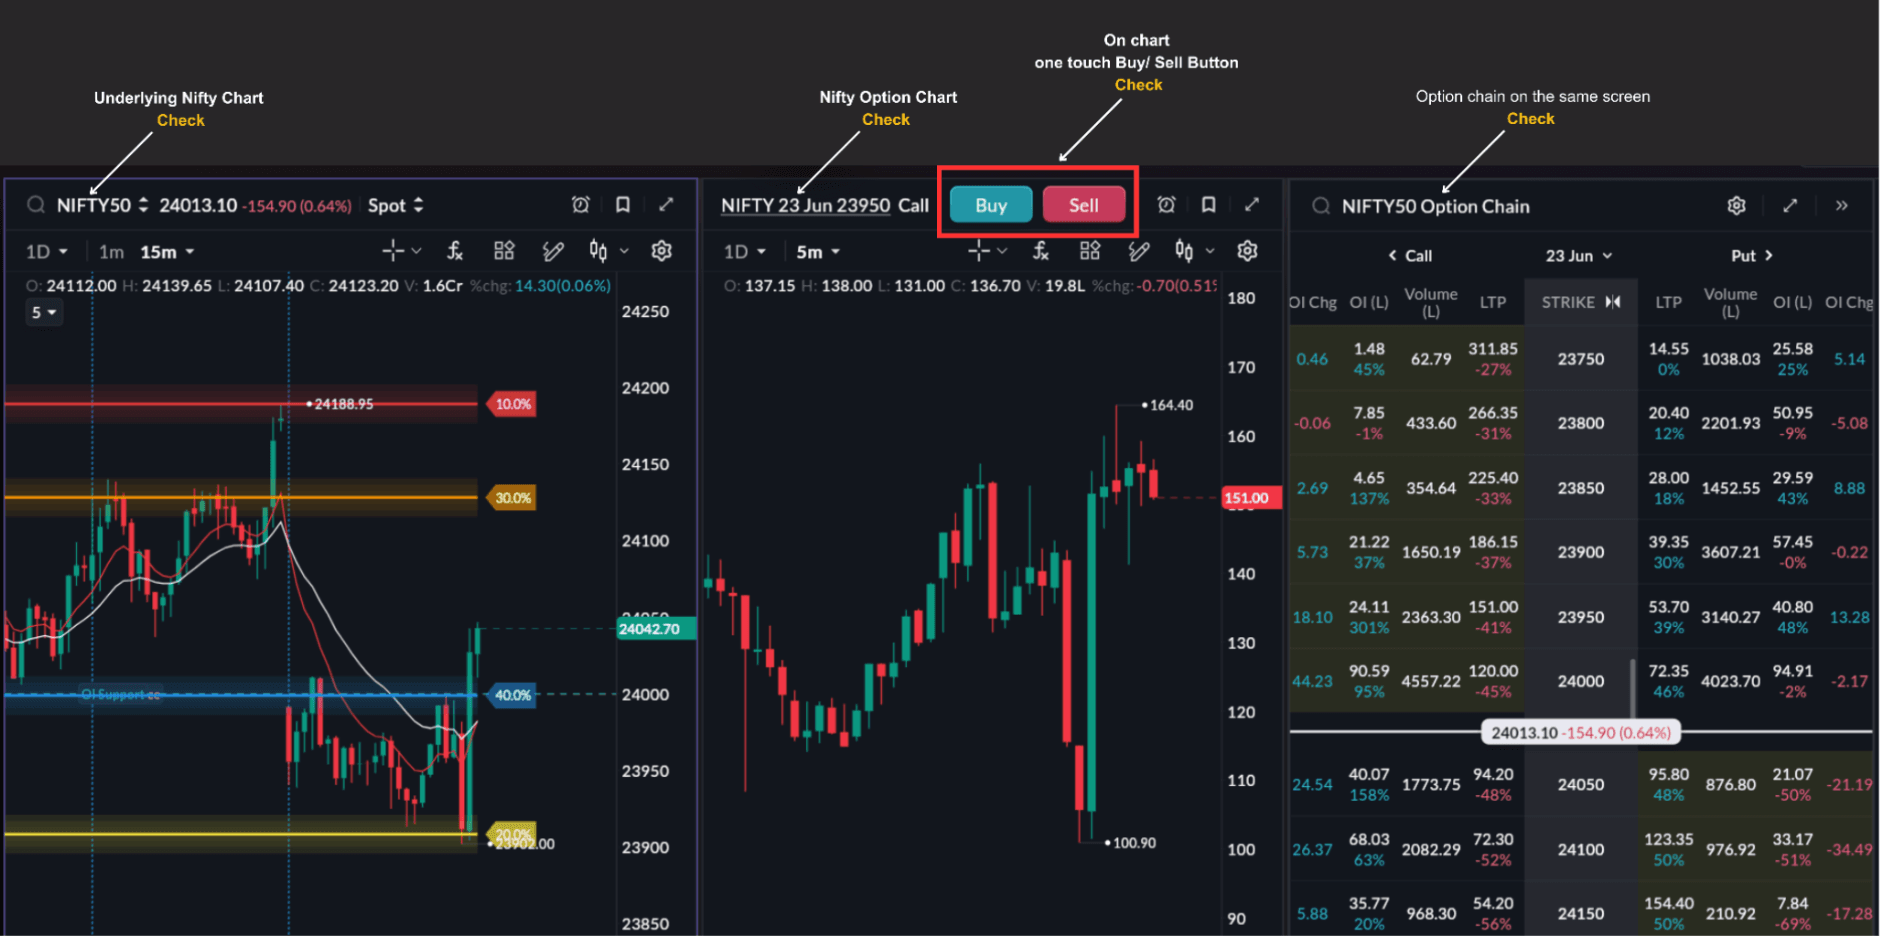
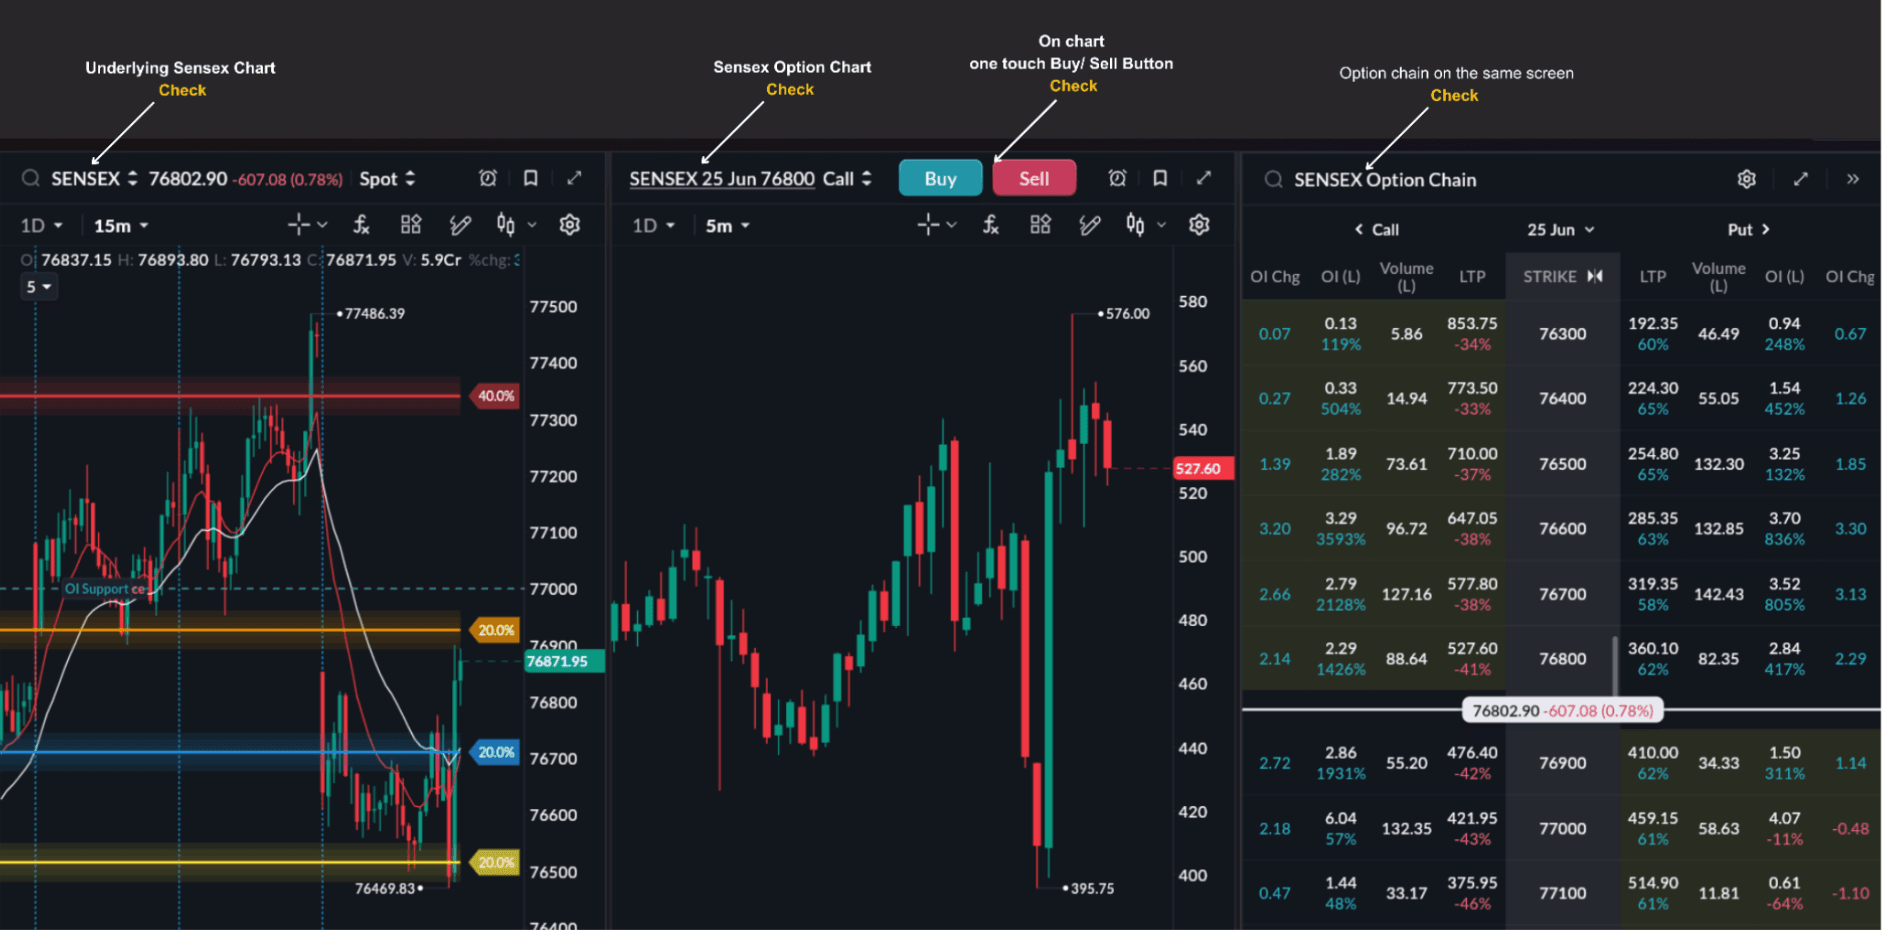
SAHI’s workspace is different from a typical setup because the underlying chart, the option’s own price chart, and the live option chain can all be viewed together. This reduces the need to switch constantly between a charting platform and a separate option chain window.
That matters in scalping, where speed, context, and execution often matter more than any single indicator.
The integrated layout helps traders by providing:
- quick strike selection
- clear visibility of both underlying and option price action
- faster order execution
- minimal switching between charts, option chain, and trading panels
A note on patience before the bell: a well-built workspace can create a false sense of readiness. Having every tool on screen is not the same as having a setup.
As discussed in Chapter 4, the first 15 minutes of the session are erratic by nature. Gaps fill, spikes reverse, and structure has not formed yet. The discipline remains the same: do not trade just because the screen is ready.
The workspace should be ready before 9:15 AM. The first trade does not need to be.
Pre-Market Preparation Using SAHI
Before the market opens:
- check India VIX and overall volatility conditions
- observe global cues and Gift Nifty
- use SAHI’s OI Support & Resistance tool to identify major positioning levels
- use SAHI’s Key Levels Indicator to mark important support and resistance zones
- observe Max Pain positioning near expiry
- build an initial market bias before the session begins
None of this is new ground. The Daily Pre-Market Trading Checklist from Chapter 3 is simply being executed on the SAHI workspace here.
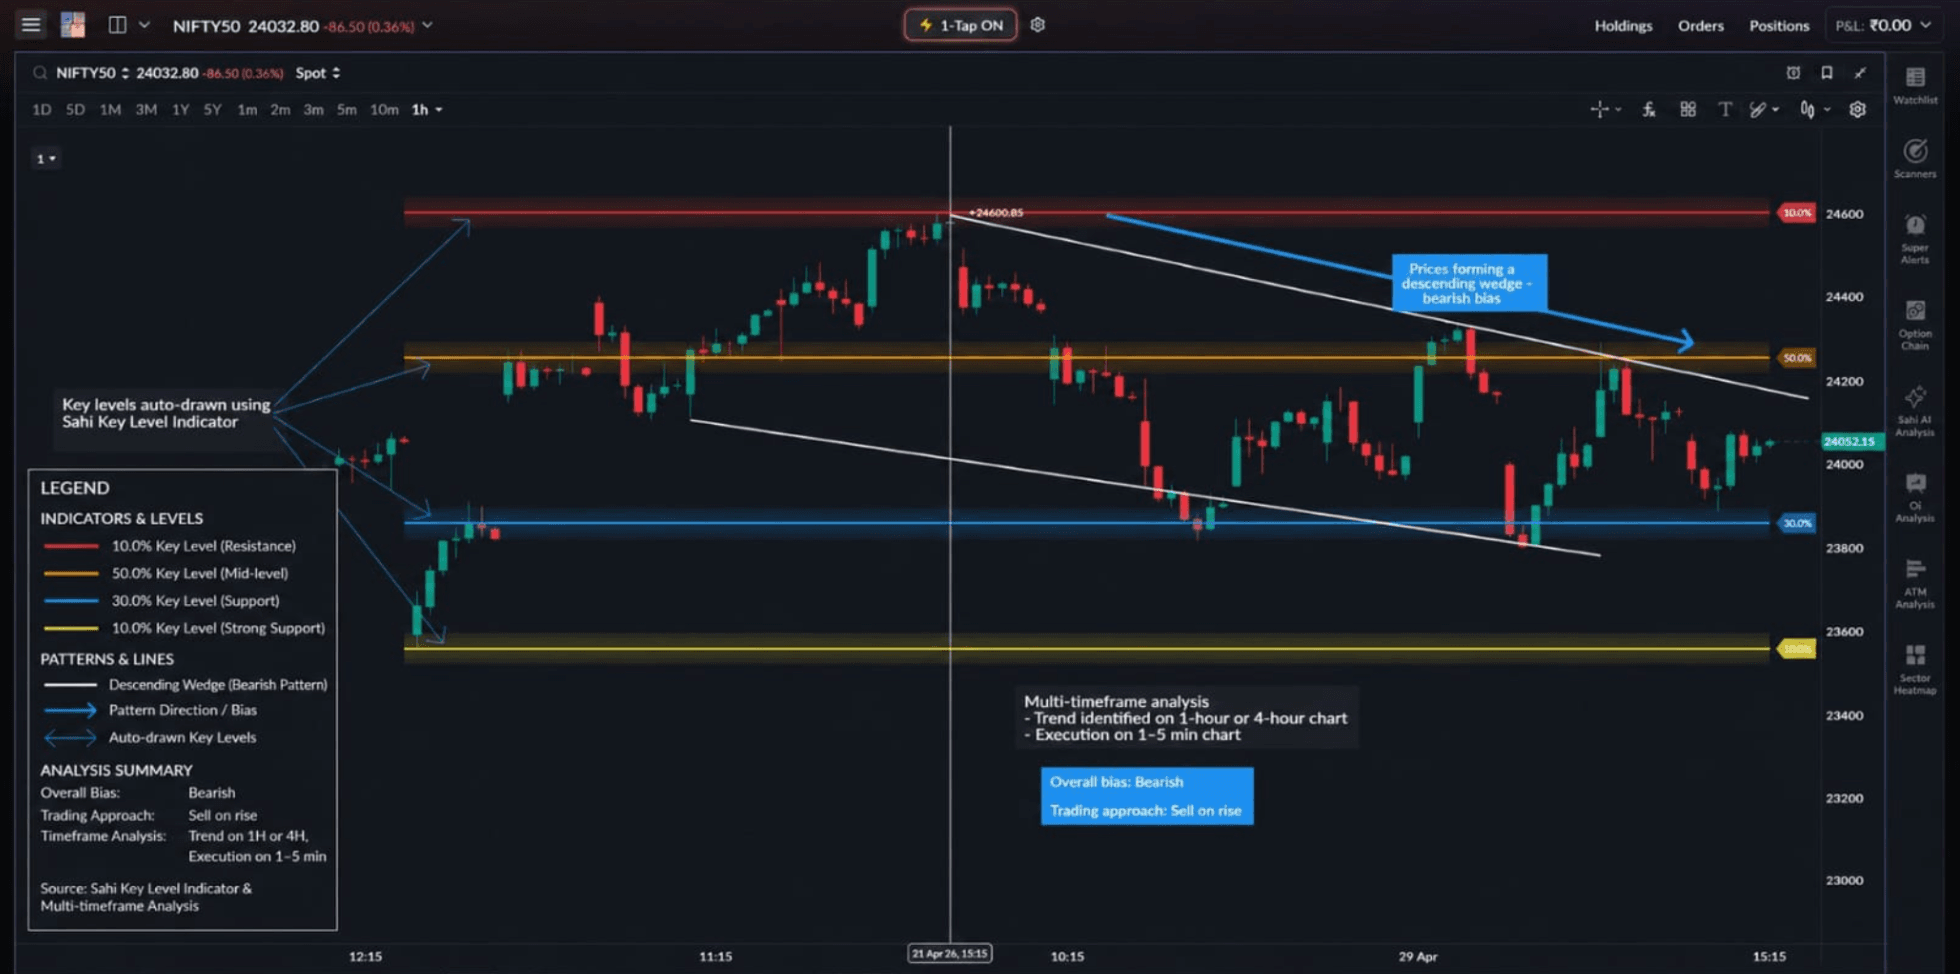
These levels then become reference points during the session, so trades are taken at planned zones instead of being driven by live emotion.
Chapter 9’s Reference Strike method is then used to turn that pre-market observation into a working bullish, bearish, or neutral bias for the session. The objective is to reduce reaction-based decision-making once the market opens.
Identifying the Setup on SAHI
The first step is to identify the type of market condition:
- trending
- range-bound
- volatile expiry session
This is the same trend-versus-chop read from Chapter 6, now applied live.
The setup itself can vary, but the underlying logic remains similar:
- price approaches a key level
- EMA and VWAP align with direction
- OI positioning supports the move
- premium behaviour confirms momentum
This is the same alignment described in Chapter 7, now layered onto the OI and key-level context from Chapters 6 and 9.
Example: Combining Price Action and Option Chain Before Execution
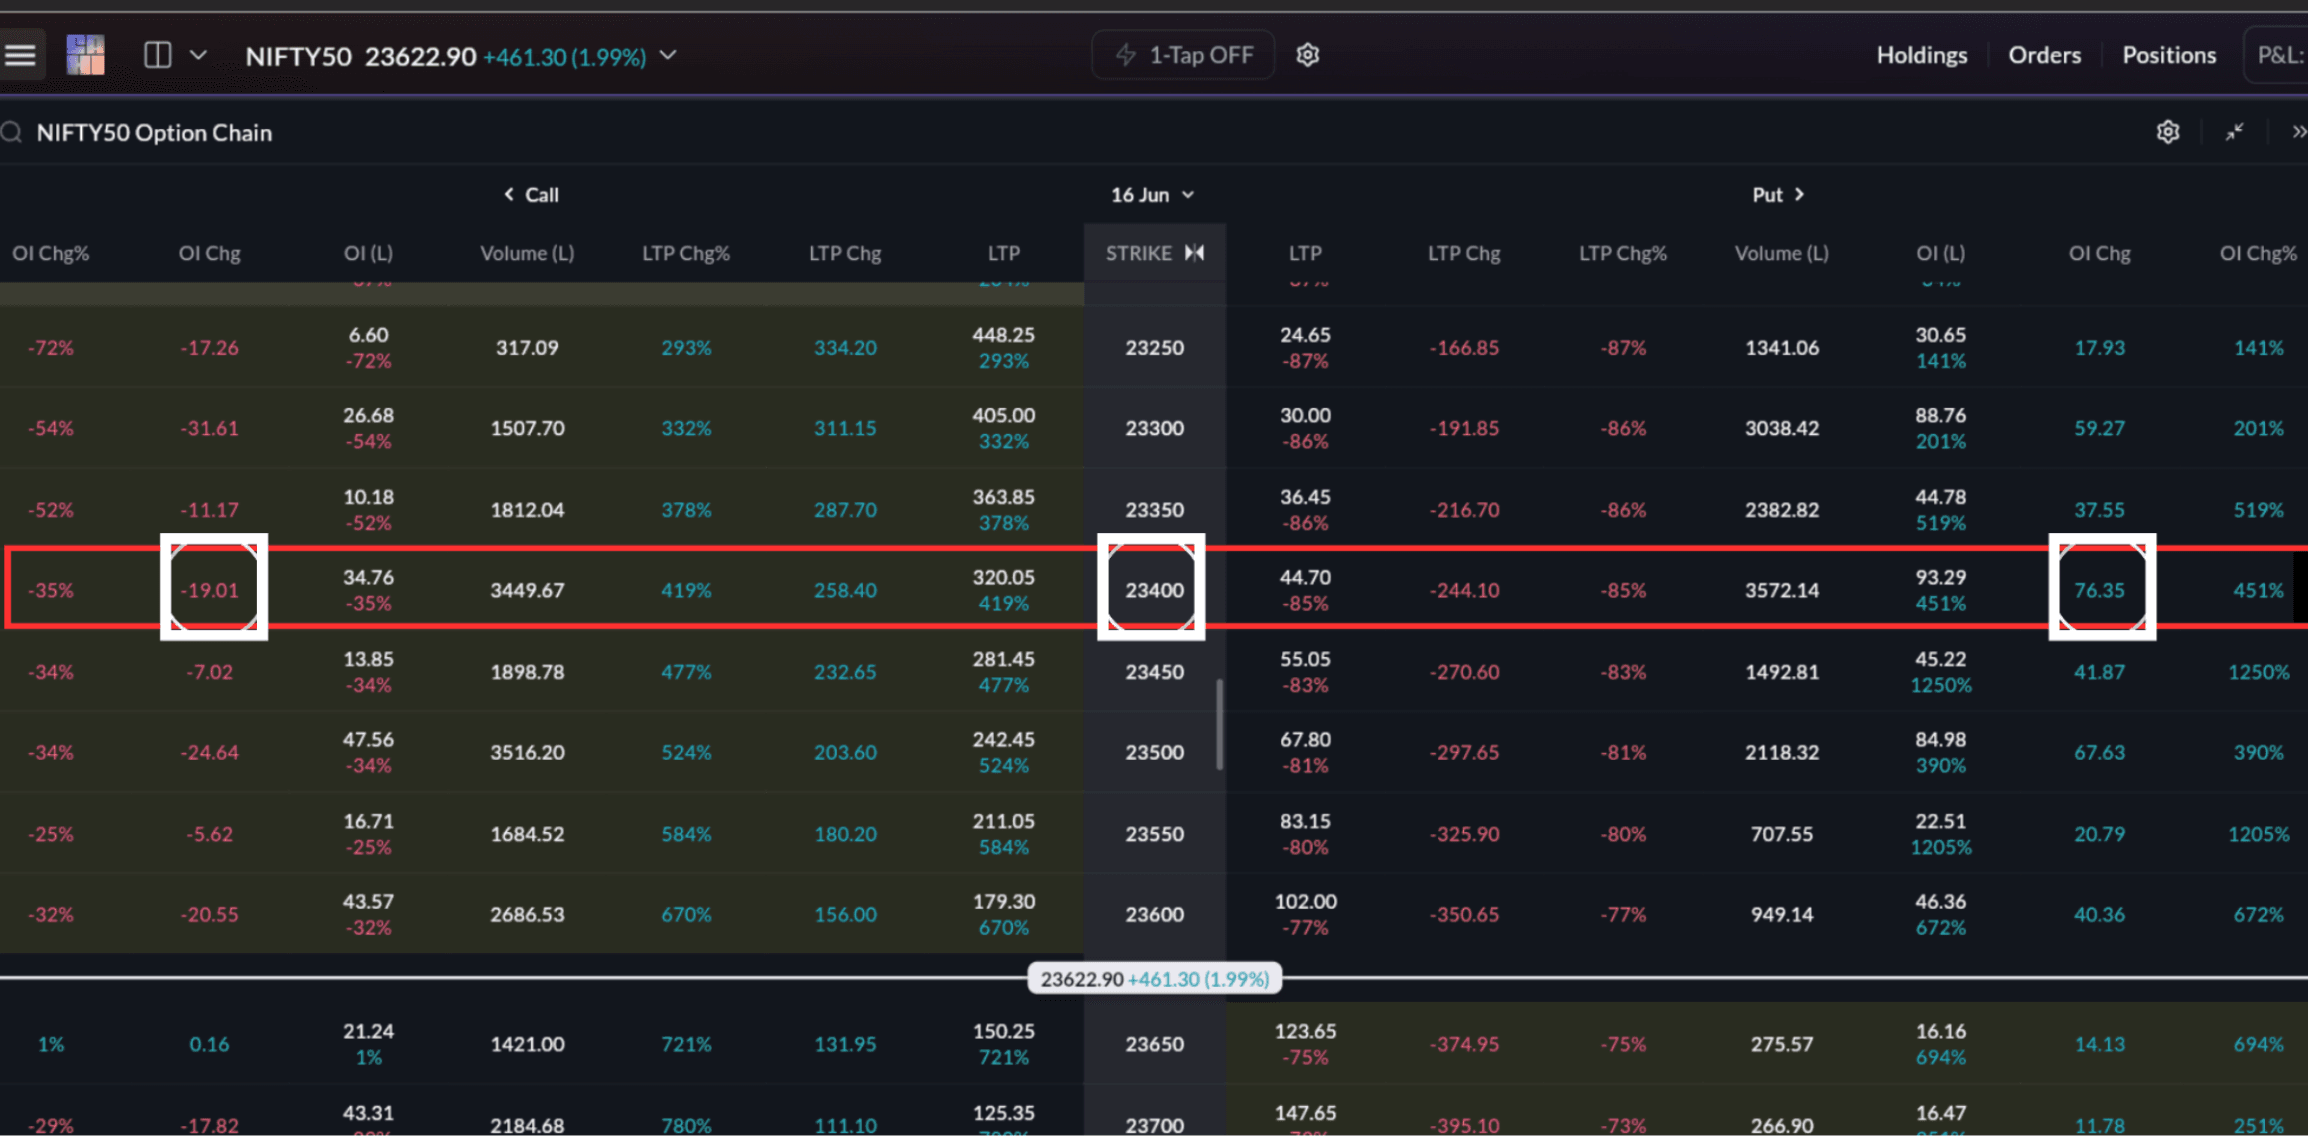
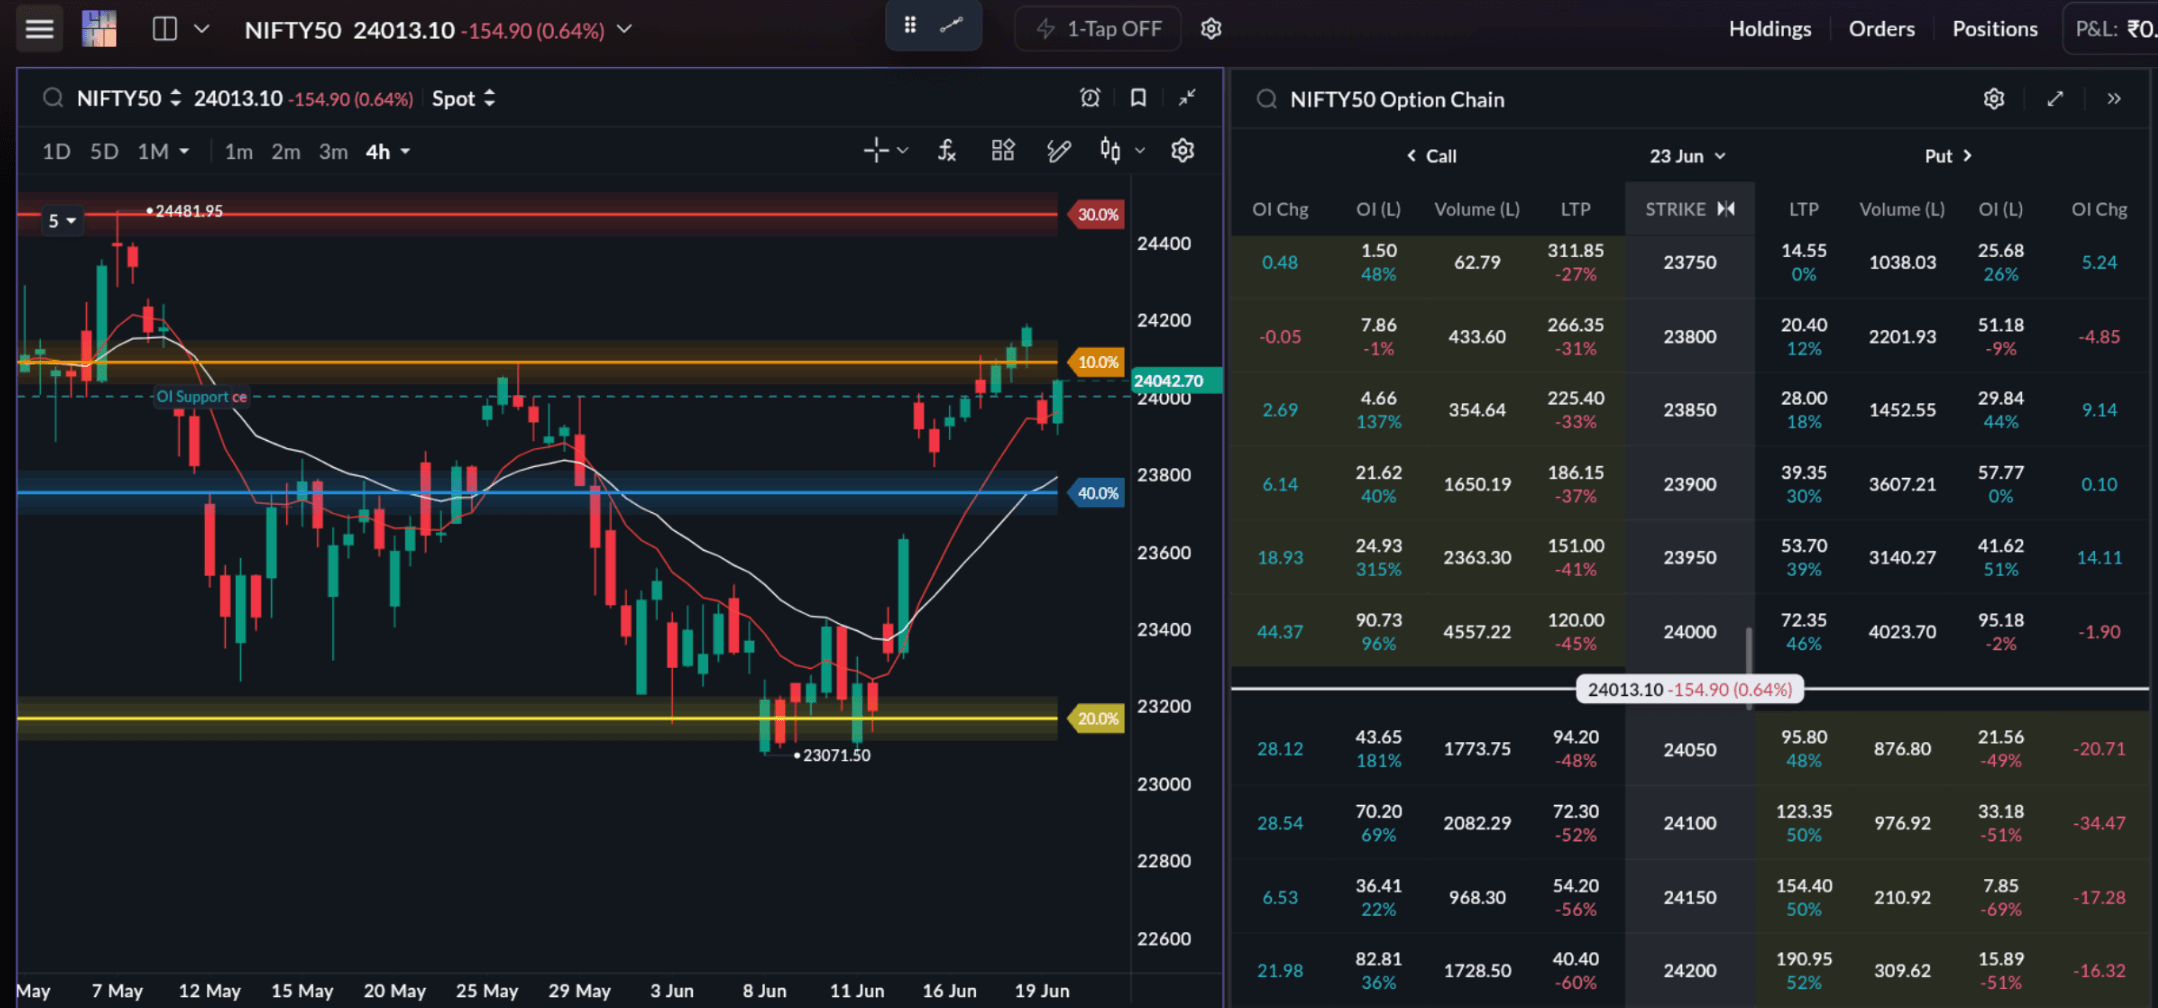
The chart below illustrates an idea repeated throughout this book: neither price action nor option chain data should be used in isolation. High-quality trades usually emerge when both begin to tell the same story.
At the start of the session, the 24,000 strike showed the highest Open Interest and the largest fresh additions on both sides. Call writers were clearly stronger, with 220 lakh Call OI compared with 145 lakh Put OI, while Change in OI stood at +174 lakh on Calls versus +48 lakh on Puts.
On positioning alone, this suggested that resistance around 24,000 remained strong and that a bearish bias was reasonable.
However, the price chart was showing something different. Price was trading near the SAHI OI Support zone, and recent candles were repeatedly finding support near the rising 9 EMA. Although option writers appeared bearish, the price itself had not yet broken its support structure.
So the two forms of analysis were not aligned:
| Factor | Observation | Bias |
|---|---|---|
| 24,000 Call OI | 220 lakh vs 145 lakh Put OI | Bearish |
| Change in OI | +174 lakh Calls vs +48 lakh Puts | Bearish |
| SAHI OI Support | Price holding near OI support | Bullish |
| 9 EMA | Price respecting EMA | Bullish |
| Overall Confirmation | Mixed signals | No Trade |
Despite the bearish positioning by option writers, price had not confirmed weakness. Entering short positions purely because of heavy Call writing would have been premature.
Instead, the trader waits for dual confirmation:
- Bearish trade: price breaks below SAHI OI Support and loses the 9 EMA while Call writers continue to dominate
- Bullish trade: price sustains above support and the resistance created by Call writers begins weakening through unwinding
Key Principle: Option chain tells us how traders are positioned. Price action tells us whether that positioning is actually influencing the market. When both align, probability improves. When they disagree, patience is often the best position.
Strike Selection Through the SAHI Option Chain
Strike selection is based on:
- Delta responsiveness
- liquidity
- OI positioning
- market condition
As Chapter 5 explained, Delta determines how responsive a premium will be to the underlying’s movement. And as Chapter 8 showed, selecting a contract only because it looks cheap is one of the more expensive mistakes a scalper can make.
Using SAHI’s option chain, the trader can:
- identify liquid ATM or near-ATM strikes
- observe active OI concentration
- monitor changes in positioning before entry
- execute directly from the option chain for faster order placement
Continuing the same example, the ATM 24,000 CE becomes the more sensible choice over a cheaper OTM strike. Its Delta near 0.5 gives it a more meaningful reaction to the expected move, and OI at that strike is already among the most active in the chain, which helps keep spreads tighter.
The contract is bought directly from the option chain at a premium of roughly ₹110, without the need to move to a separate order screen. Later, the premium rises to ₹120, as shown in the chart below.
Trade Execution Using SAHI
Entry is taken only after confirmation.
Execution process:
- breakout or reaction confirms direction
- strike is selected through the option chain
- order type is chosen based on market conditions
- stop-loss is defined immediately after entry
Chapter 8 explained why this sequencing matters. A breakout entered after it has already expanded is no longer a breakout trade. It is chasing, and the risk-reward has already deteriorated.
SAHI’s execution flow helps reduce delay between confirmation and order placement during fast-moving conditions, but the discipline of waiting for confirmation still sits with the trader.
Managing Risk Using Bracket Orders
Risk is defined before the trade begins.
Using SAHI’s bracket order system:
- stop-loss is placed immediately
- target is defined in advance
- risk remains fixed during execution
This is simply the risk-per-trade and stop-loss placement framework from Chapter 3, made operational. Risk is fixed before the trade, not adjusted mid-trade based on confidence or how the position is behaving.
This becomes even more important during expiry sessions, where Gamma and Theta can change premium behaviour quickly once a trade is live.
Managing the Trade Using SAHI Tools
Once the trade becomes active:
- momentum is monitored through price structure
- premium behaviour is observed
- OI shifts are tracked during the move
- Gamma and Theta effects are considered during holding
The positions panel helps monitor:
- open P&L
- premium movement
- trade responsiveness
This is where the Greeks stop being theory and start explaining what is happening on screen.
As the price moves from 24,005 toward 24,080, Gamma accelerates the premium’s reaction. The move from ₹95 to ₹118 happens faster than the early part of the trade.
Once the price stalls near 24,090 and candles begin compressing, that acceleration disappears and Theta starts working against the position, even though the underlying has not reversed. This is the same pattern discussed in Chapter 8 under holding trades too long.
Trades are exited when:
- target is reached
- momentum weakens
- structure breaks
- premium behaviour changes significantly
Post-Trade Review
This is the Review and Refine stage from Chapter 2, and it serves the same purpose as the trade journal in Chapter 3.
The question shifts from “Did I make money?” to “Did I execute the trade the way I planned?”
That is what improves consistency across future sessions.
Common Execution Mistakes During Live Scalping
- chasing entries after expansion
- entering without confirmation
- delaying stop-loss placement
- holding after momentum weakens
- overreacting during volatility spikes
- ignoring premium behaviour
- cluttering the workspace with unnecessary tools
Each of these was covered in depth in Chapter 8, and the example trade above is deliberately built to avoid them.
The same contrast remains true here: a trade run on a plan looks mechanical from the outside, while the same setup traded reactively produces late entries, undefined stop-losses, and exits driven by hope rather than structure.
Self-Assessment Checklist
Before every scalp trade, ask:
- Is the market condition clear?
- Am I trading near an important level?
- Does OI support the setup?
- Are indicators aligned?
- Is the strike responsive enough?
- Is risk defined before entry?
- Does premium behaviour support the trade?
This brings together the self-assessment framework from Chapter 2 and the Daily Pre-Market Checklist from Chapter 3 into one final pre-trade pass.
Final Takeaway
A successful scalp trade is rarely built on one factor alone.
The strongest setups usually involve alignment between:
- market context
- key levels
- OI positioning
- volatility
- indicators
- strike selection
- disciplined execution
SAHI’s tools help organise these elements into a faster and more structured execution workflow. But consistency still depends on discipline and decision-making.
Test yourself
Check how well you understood the complete scalping workflow on SAHI.
Investor knowledge check
How well do you understand the markets?
Five quick questions on bringing context, indicators, the option chain, execution and risk together in one trade.
 5 questionsUnder 3 minutes
 Instant score