
Stock Scalper: From your stock list to your order, on one screen
4 min read
Published 28 Oct 2026, 10:00 PM ISTUpdated Thu, 29 Oct, 2026, 05:30 AM IST
Summary
Swipe through your scanner or watchlist, read the live chart, and place or manage your order without switching screens. Plus, Intraday Scanners are now live.
Trade Smarter, Not Harder
Receive market breakouts, AI insights, and trading strategies directly in your inbox.
Stock Scalper
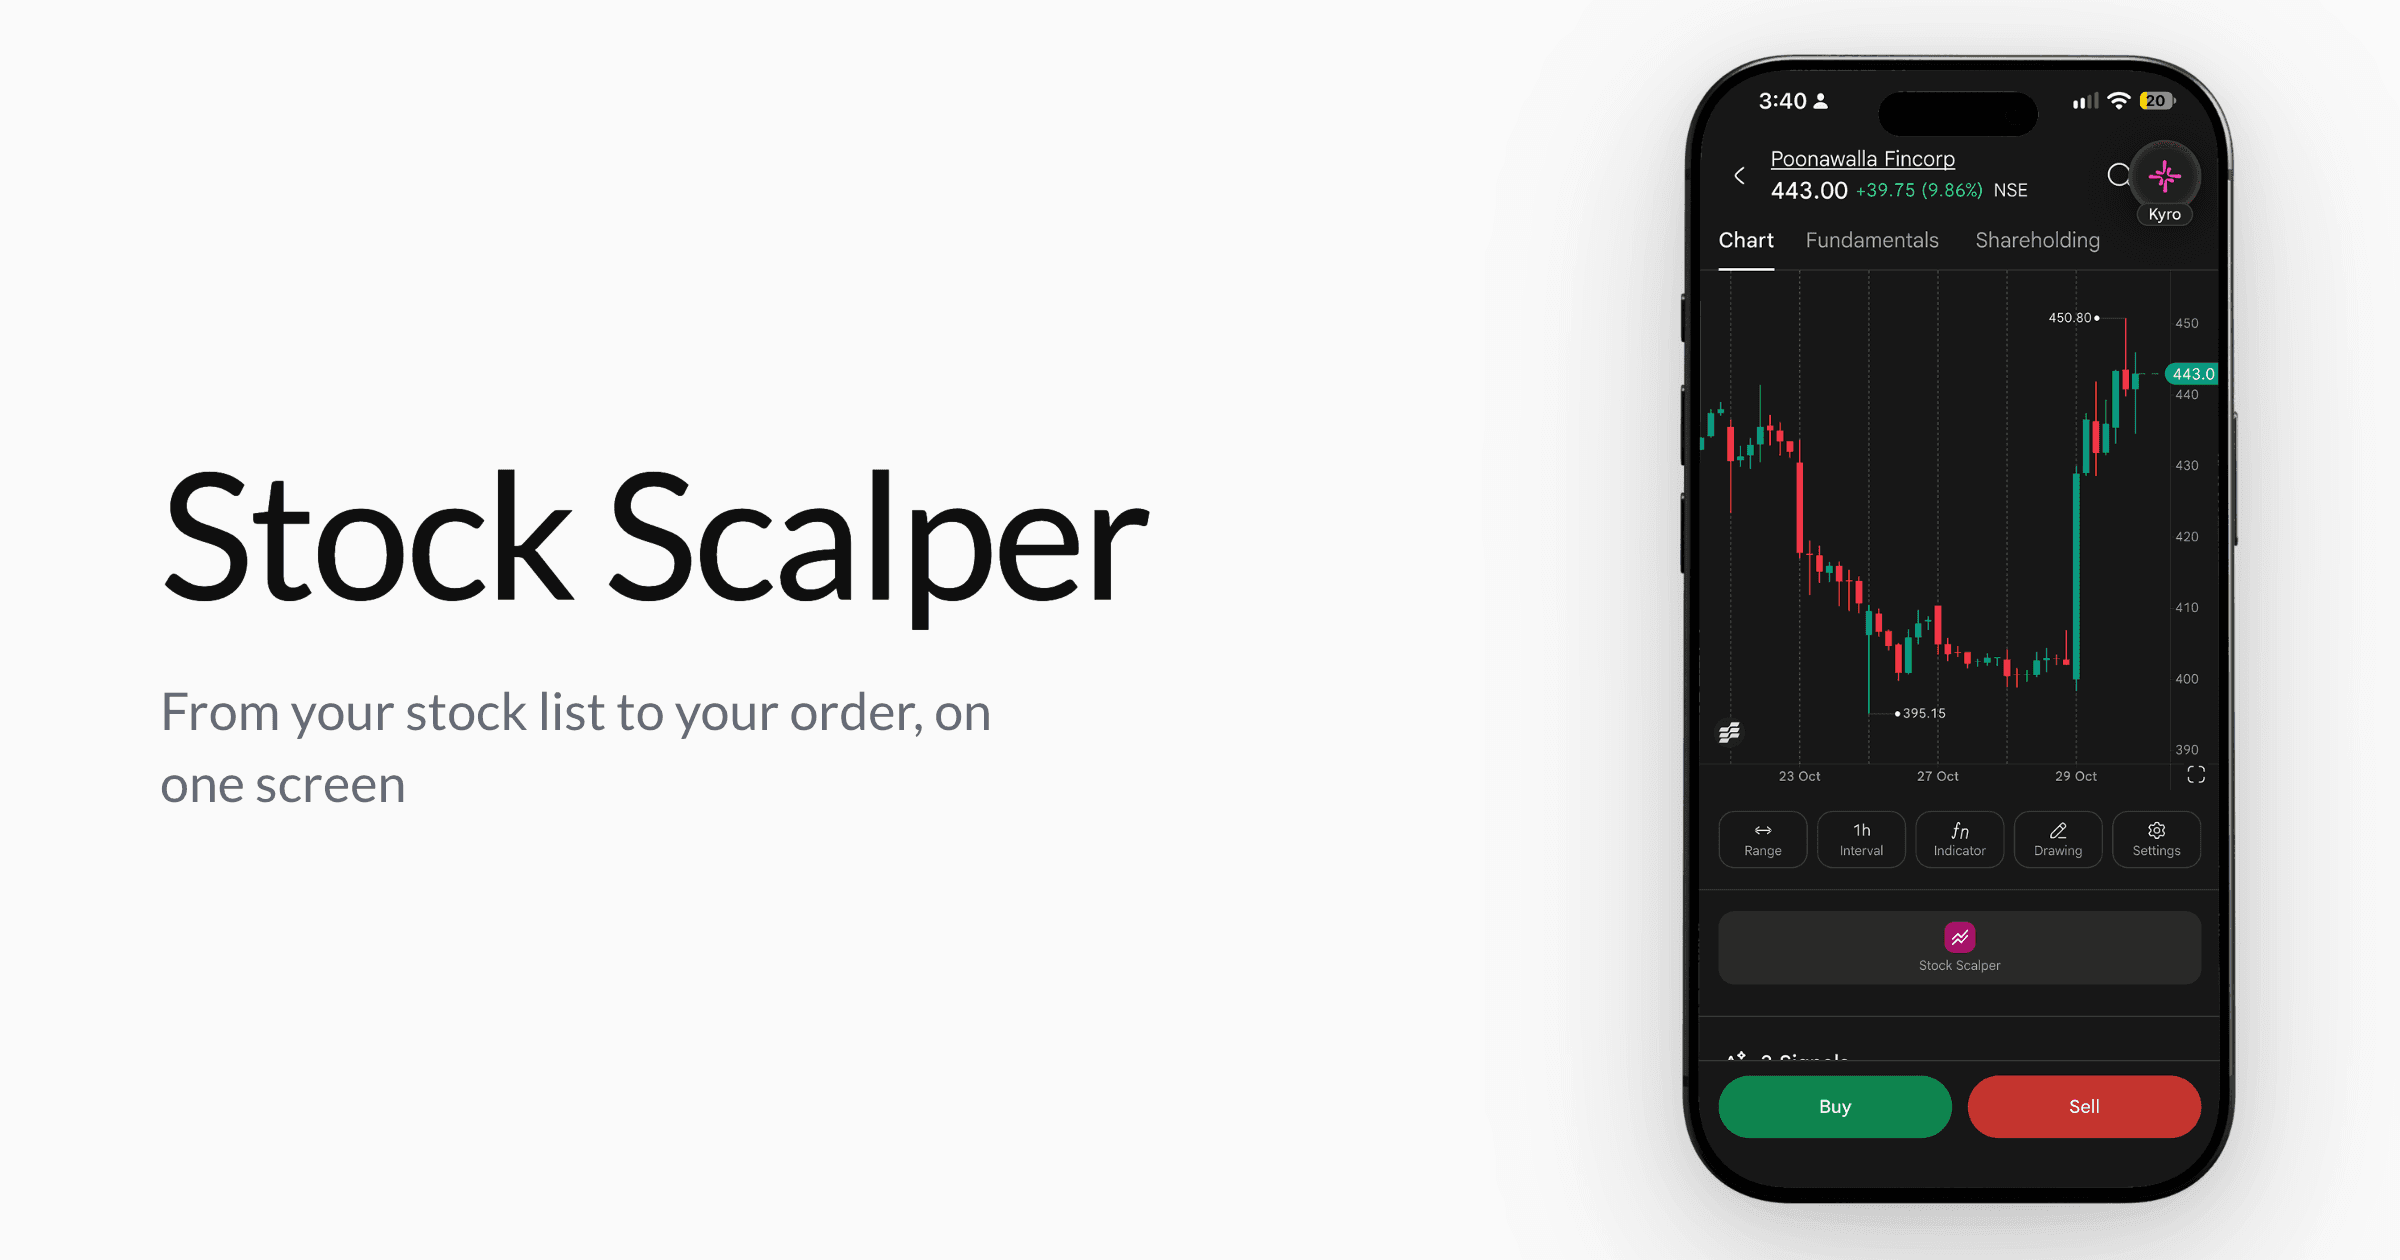
With Stock Scalper, you go from your stock list to your order on one screen in the SAHI app. Pick a stock from a scanner or your watchlist, read its live chart and place your order, without opening a stock page, then a chart, then an order form. It works for NSE and BSE stocks you trade intraday.
It is free to use, and standard brokerage and statutory charges apply to each order. Stock Scalper is available on the SAHI app for Android and iOS.
How to open it
- Trade tab: tap Trade, then Stock Scalper.
- Intraday Scanners: on Home, open Intraday Scanners and tap any stock.
- Stock page: open any stock, from your watchlist, Stock Scanners or search, and tap Stock Scalper below the chart.
The list you came from loads into the chart switcher under the chart. The first time you open Stock Scalper, a five-step guided tour walks you through the screen, in English or Hindi. You can replay it any time from the ⋮ menu.
Move through your list
The chart switcher under the chart shows every stock in the list you opened from. Swipe the chart switcher to move to the next stock. The chart reloads with your timeframe, chart type and indicators exactly as you set them.
Set your chart once. Add an indicator or change the timeframe, and it stays on every stock in your list as you swipe.
To change lists, tap the List icon next to the chart switcher and pick from My Lists (your watchlists), Intraday Scanners or Positions. To load any stock that isn’t in your list, tap the search icon.
The chart has all the timeframes and indicators you get on SAHI charts, and you can add your own intervals. Save your setups as templates, and use any custom scripts you’ve built with Custom Indicators on SAHI web.
Placing orders
The order panel at the bottom has two modes, and you can also place orders straight from the chart.
1-Tap Mkt. Tap Buy at Mkt or Sell at Mkt to send an intraday (MIS) market order at the quantity in the stepper. There is no confirmation screen, so the order goes to the exchange as soon as you tap. Your quantity is remembered for each stock. To make 1-Tap place limit orders instead, open the ⋮ menu, tap 1-Tap order defaults and choose Limit. You can then set the limit price to the best bid or offer, the LTP or the midpoint.
Limit/Trigger on Chart. A price line appears on the chart. Drag it to your level and tap Buy or Sell. Stock Scalper picks the order type from where your line sits against the LTP:
| You tap | Line vs LTP | Order placed |
|---|---|---|
| Buy | Below | Buy limit, to buy on a dip |
| Buy | Above | Buy trigger, to buy on a breakout |
| Sell | Above | Sell limit, to sell into strength |
| Sell | Below | Sell trigger, to sell on a breakdown |
Long-press the chart. Long-press any price level on the chart and tap +. You get a buy and a sell order at that price, set up as a limit or a trigger based on where the price sits against the LTP, along with Create Super Alert and Draw horizontal line.
Pending orders stay on the chart as pills. Drag a pill to modify the order, or tap × to cancel it.
The margin your quantity needs shows under the Buy and Sell buttons and updates as you change quantity.
For delivery or a one-off order, tap the expand arrow to open the expanded order form. It covers:
- Delivery (CNC) or Intraday (MIS)
- Market, Limit or Trigger orders
- Day or IOC validity
- Stop-loss and target at entry
- The required amount and charges, shown before you place
When you’re done, you come back to the same stock.
Manage your position on the chart
Your open position shows as a pill at your average price, with live P&L. Intraday positions are marked I and holdings are marked H.
To add a stop-loss or target, drag it out from the position pill. The sheet that opens lets you set:
- The quantity
- SL Market or SL Limit (or TP Market or TP Limit)
- The trigger price
- A trailing stop-loss, if you want one
It also shows the estimated loss or profit before you apply. If you set both a stop-loss and a target, the other is cancelled as soon as one executes. If you exit the position, both are cancelled. On a partial exit, they adjust to the remaining quantity.
To exit, tap the position pill and choose Exit at Mkt, or use Exit All in Positions. If you want to hold overnight, tap Convert to Delivery in Positions before auto square-off. You’ll need funds for the full value.
Everything else, over the live chart
The top panel has P&L, Positions, Orders, Funds and Super Alerts. Each opens over the chart, which keeps moving behind it.
- P&L: shows your Total P&L and your Stock Scalper P&L separately, each split into realised and unrealised. You can also set P&L Protect from here.
- Funds: shows your available balance. Tap Add funds to pay by UPI and come straight back to the chart.
- Super Alerts: long-press any level on the chart, tap +, and set a price or candle alert. You’ll get it by email and app notification.
Good to know
- Mobile only: Stock Scalper is on the SAHI app only.
- Not every stock allows intraday: stocks under surveillance measures can be delivery-only. For those, use the expanded order form.
- Gross P&L: P&L on screen is before brokerage and taxes. Your contract note has the net figure.
- Auto square-off: open intraday positions are squared off at 3:25 PM, or 3:10 PM for stocks in CAS.
Intraday Scanners
Intraday Scanners are live scans that pick out stocks showing unusual price or volume action during market hours. They refresh every 5 minutes, so a stock can enter or drop off a scan as conditions change.
Three scanners are live. Each has a Bullish view for stocks moving up and a Bearish view for stocks moving down, and shows a chart for each stock so you can read the move at a glance. Tap the ⓘ next to a scanner’s name to see how it works.
Price Volume Breakout
- Bullish: stocks up 2.5% or more intraday, with the volume, VWAP, range position and 15-minute trend already behind the move. Sorted by intraday change, biggest gainers first.
- Bearish: stocks down 2.5% or more intraday, with the volume, VWAP, range position and 15-minute trend already behind the move. Sorted by intraday change, biggest losers first.
Early Mover
- Bullish: stocks up 1 to 3% intraday on 2x relative volume, whose latest 5-minute candle traded 2x its usual volume for that time of day. Sorted by intraday change, biggest gainers first.
- Bearish: stocks down 1 to 3% intraday on 2x relative volume, whose latest 5-minute candle traded 2x its usual volume for that time of day. Sorted by intraday change, biggest losers first.
Each stock stays listed for an hour after it last qualified.
Opening Range Breakout
- Bullish: stocks trading above the 9:15 to 9:30 opening range, after the first 5-minute close beyond it broke out on confirming volume and a trending 15-minute ADX. Sorted by intraday change, biggest gainers first.
- Bearish: stocks trading below the 9:15 to 9:30 opening range, after the first 5-minute close beyond it broke out on confirming volume and a trending 15-minute ADX. Sorted by intraday change, biggest losers first.
You’ll find Intraday Scanners on your Stock Home. Tap View All to open the full screen, where you can filter by index, sector, market cap, price change and relative volume. Tap any stock to open it in Stock Scalper with that scanner’s list loaded in the chart switcher.
Investments in securities market are subject to market risks. Read all related documents carefully before investing. Stocks shown are for illustration only and are not recommendations.
FAQs

Recent blogs

Jio Platforms IPO: Everything Investors Need to Know Before Investing
/Posted 1 month ago
Add Sahi as a Preferred Source on Google
Click the link, confirm the box next to sahi.com is checked — ignore any other results.