
Tata Steel Q1 FY27 Revenue Rises 14%; Seeks Fresh UK Funding for Port Talbot
Tata Steel seeks additional UK government support as delays to the Port Talbot EAF project push commissioning to late 2028 or early 2029.

Tata Steel has approached the UK government for additional funding as delays to its Port Talbot electric arc furnace project push the expected commissioning timeline to late 2028 or early 2029 and raise overall project costs.*
Tata Steel has sought additional financial support from the UK government for its delayed Port Talbot transformation project, according to a 19 September 2026 report. The development puts renewed focus on the financial burden of the company's UK operations and the execution of its transition to electric arc furnace-based steelmaking.
The development comes after Tata Steel reported stronger year-on-year consolidated operating performance in Q1 FY27. However, its UK operations remained a relatively weak part of the broader business, making the Port Talbot project an important issue for investors to monitor.
Tata Steel Approaches UK Government for Additional Port Talbot Funding
On 19 September 2026, Tata Steel had approached the UK's Department for Business, Innovation, Science and Technology to discuss an additional multimillion-pound support package for Port Talbot. The precise amount has not been disclosed, although industry sources indicated that the request could run into hundreds of millions of pounds.
The request comes on top of the £500 million government grant awarded in 2023 as part of Tata Steel's £1.25 billion investment plan for the Port Talbot site.
The project involves replacing traditional blast-furnace steelmaking with an electric arc furnace, or EAF, as part of the site's transition towards lower-emission production.
The original plan was for the new EAF to become operational by early 2028. However, delays in securing the required grid connection have pushed the expected commissioning timeline to late 2028 or early 2029.
Tata Steel is understood to be facing higher project costs because of the delay, along with lost sales opportunities while the new furnace remains unavailable. This has increased the financial importance of completing the project on time.
Port Talbot Delay Adds Pressure to Tata Steel's UK Operations
The Port Talbot development is significant because the UK business has already faced structural challenges.
The site's final blast furnace was shut down in 2024, ending traditional blast-furnace steelmaking at Port Talbot. The transition has also resulted in around 2,500 job losses, while the broader investment was originally intended to preserve around 5,000 steelmaking jobs across the UK.
Tata Steel has also faced pressure from cheaper imported steel. Sky News reported that the company had previously raised concerns about the viability of its UK operations, while union leaders have highlighted competitive pressure from imports from India, Vietnam and South Korea.
For Tata Steel, the challenge is therefore not simply completing the EAF project. The company also needs the UK business to become financially sustainable while managing the transition from traditional steelmaking to a lower-emission production model.
The additional funding request could reduce some of the immediate financial pressure if approved, but it also highlights the rising cost and complexity of the Port Talbot transition.
Q1 FY27 Results Show Stronger Group Performance Despite UK Challenges
Tata Steel's latest financial results provide important context for the current development.
The company reported its Q1 FY27 consolidated results on 30 July 2026. Revenue from operations increased 14.34% YoY to ₹60,794.29 crore, while EBITDA increased 24.73% YoY to ₹9,264.34 crore.
However, the improvement was driven mainly by the company's Indian operations. Tata Steel India revenue increased 18.97% YoY to ₹36,896.55 crore, while Neelachal Ispat Nigam Ltd revenue rose 84.79% to ₹1,712.24 crore.
In comparison, Tata Steel UK revenue increased only 0.32% YoY to ₹6,115.30 crore.
|
Metric |
Q1 FY27 |
Q4 FY26 |
QoQ % |
Q1 FY26 |
YoY % |
|---|---|---|---|---|---|
|
Revenue from Operations (₹ Cr) |
60,794.29 |
63,270.13 |
-3.91% |
53,178.12 |
+14.34% |
|
Total Income (₹ Cr) |
61,026.97 |
63,518.60 |
-3.92% |
53,466.79 |
+14.14% |
|
EBITDA (₹ Cr) |
9,264.34 |
9,828.66 |
-5.74% |
7,427.54 |
+24.73% |
|
EBITDA Margin |
15.24% |
15.53% |
-29 bps |
13.97% |
+127 bps |
|
PAT — Owners (₹ Cr) |
2,318.35 |
2,925.74 |
-20.76% |
2,077.68 |
+11.58% |
|
EPS — Diluted (₹) |
1.86 |
2.34 |
-20.51% |
1.67 |
+11.38% |
Source: Tata Steel Q1 FY27 Consolidated Financial Results, 30 July 2026
India Growth Provides a Cushion as Port Talbot Requires More Investment
The Q1 FY27 numbers underline an important distinction in Tata Steel's business.
The consolidated company delivered healthy yearly growth, but the latest Port Talbot development shows that the UK operations continue to require significant investment and external support.
Tata Steel's India business generated substantially stronger growth during Q1 FY27. Tata Steel India revenue increased nearly 19% YoY, while the UK business remained broadly flat.
At the consolidated level, EBITDA rose 24.73% YoY to ₹9,264.34 crore, although it declined 5.74% sequentially. EBITDA margin stood at 15.24%, compared with 13.97% a year earlier.
PAT attributable to owners increased 11.58% YoY to ₹2,318.35 crore but declined 20.76% from Q4 FY26. The company also reported a ₹345 crore one-time exceptional loss during the quarter.
This means Tata Steel has a stronger earnings base than a year ago, but the Port Talbot funding requirement remains an issue because project delays could increase the financial burden on the group.
READ THIS ALSO: UPL Outlook Revised to Stable as Restructuring and Seeds Expansion Progress
Tata Steel Share Price Today
Tata Steel shares are trading at ₹188.22, up 0.11%.
The stock has delivered 3.48% YTD returns and 9.19% returns over the past one year.
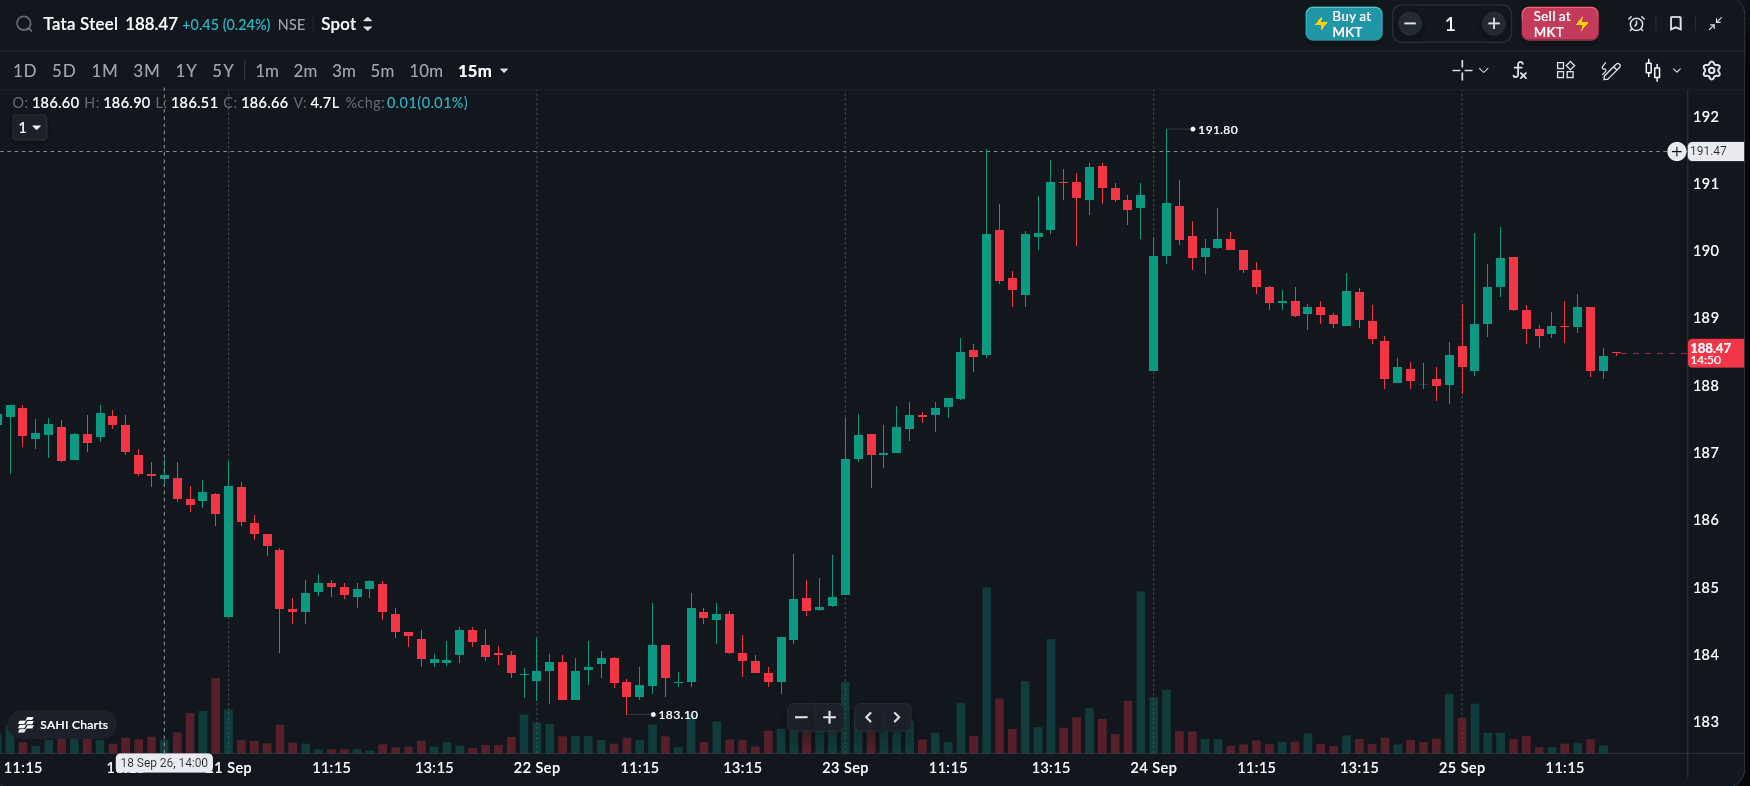
As of 25 September 2026,12:00PM
What Investors Should Watch Next
The immediate focus is whether Tata Steel secures additional UK government support and how much funding is ultimately provided.
Investors should also track the revised commissioning schedule for the Port Talbot EAF. The move from an expected early-2028 commissioning to late 2028 or early 2029 increases the period before the new facility can contribute to the UK business.
The cost of the project is another key variable. Higher construction expenses and lost sales during the delay could increase the overall investment requirement.
At the same time, Tata Steel's Indian operations remain critical to the consolidated earnings outlook. The strong Q1 FY27 growth in India provides some support, but investors will need to assess whether operating performance can remain strong enough to offset continued pressure from the UK business.
Final Takeaway
Tata Steel's latest challenge is centred on the delayed Port Talbot EAF project, where higher costs have prompted the company to seek additional UK government support. While strong India operations provide earnings support, investors should track funding, project timelines and UK profitability alongside consolidated financial performance.
All topics
Click the link, confirm the box next to sahi.com is checked — ignore any other results.