
UPL Q1 FY27 Revenue Rises 10%; CRISIL Revises Rating Outlook to Stable
UPL receives a Stable credit outlook from CRISIL as it advances group restructuring, expands its seeds business and works to improve profitability.

UPL received a positive credit-rating development in September, with CRISIL revising its long-term rating outlook to Stable from Negative while reaffirming the rating at CRISIL AA+. The company is also progressing with group restructuring, seed expansion and its broader portfolio strategy.
CRISIL revised UPL Limited's outlook on its long-term bank facilities to Stable from Negative on 2 September 2026, while reaffirming the CRISIL AA+ rating. The agency also reaffirmed the company's short-term rating at CRISIL A1+ and its ₹1,100 Cr commercial paper programme at CRISIL A1+.
The rating action comes as UPL continues to work through its business restructuring and focuses on improving earnings recovery. The company has also made progress in its seed business and portfolio reshaping, while recent management changes have added another layer for investors to monitor.
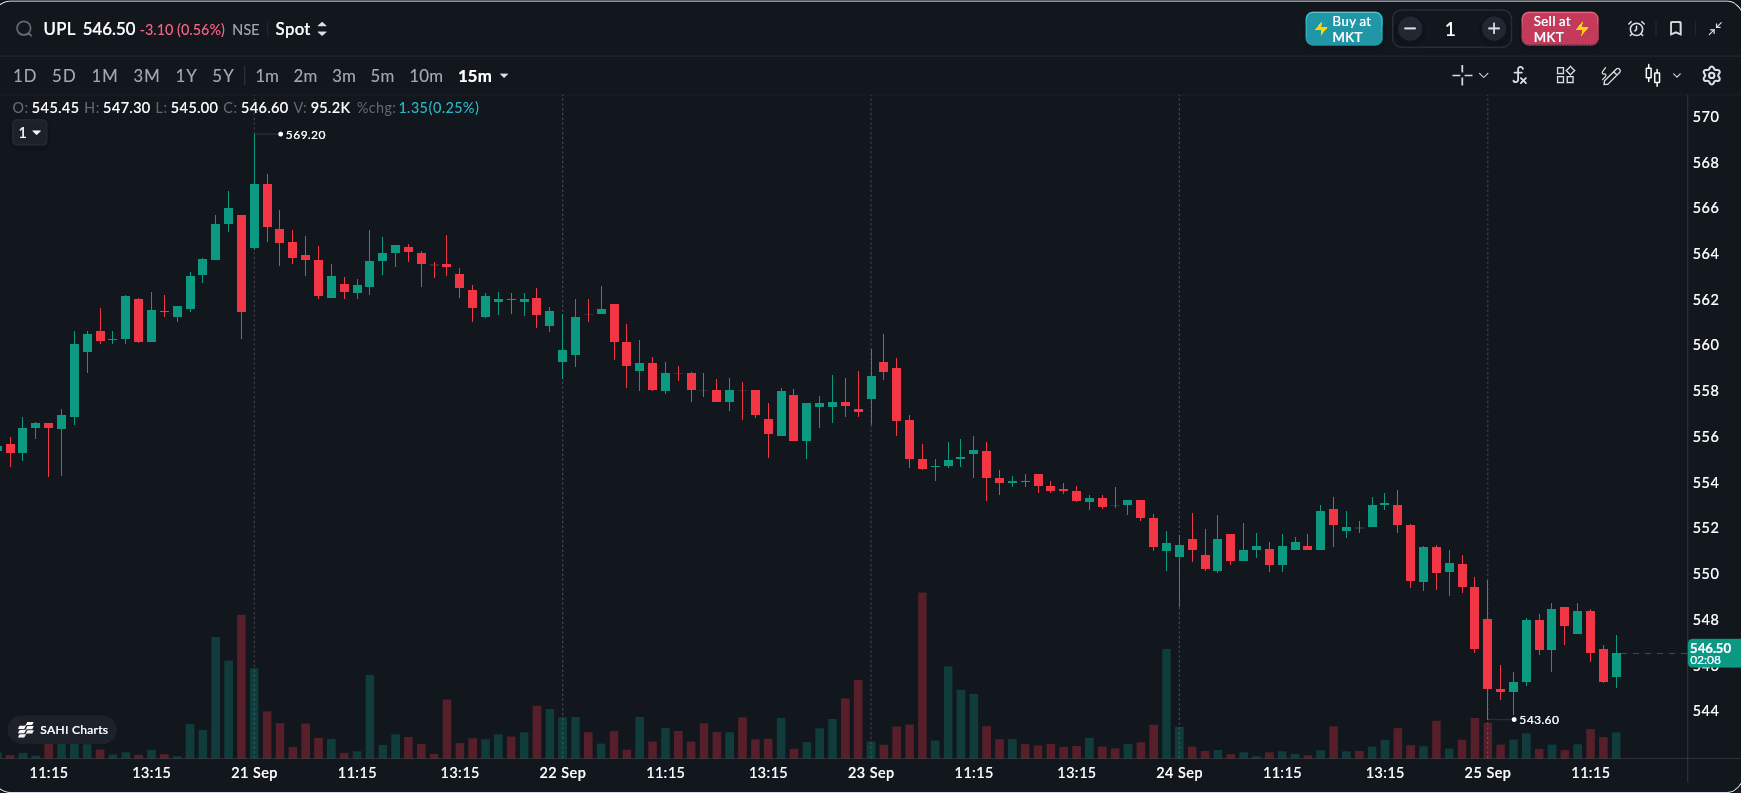
As of 25 Sep, 11:55 PM
UPL shares were at ₹546.80, down ₹2.80 or 0.51%. The stock has delivered -32.08% YTD returns and -18.25% over one year.
CRISIL moves UPL outlook to Stable from Negative
CRISIL reaffirmed UPL's long-term bank facility rating at CRISIL AA+ but revised the outlook to Stable from Negative. It also reaffirmed the CRISIL A1+ rating on short-term bank facilities and the ₹1,100 Cr commercial paper programme.
The revision indicates an improvement in CRISIL's assessment of the company's credit profile compared with its previous outlook. For investors, the development is relevant because UPL has historically operated with significant global operations and a complex group structure.
The stable outlook comes against the backdrop of UPL's ongoing efforts to improve profitability, manage its balance sheet and simplify its business structure.
UPL continues to implement its group restructuring
UPL has been progressing with a composite restructuring scheme covering several businesses and subsidiaries. Regulatory and exchange-related processes have continued during 2026, with BSE and NSE observation letters received in July for the proposed scheme.
The restructuring is intended to create more focused business platforms within the wider UPL group. The company's broader structure includes crop protection, seeds, specialty chemicals and other agricultural solutions businesses.
The group has previously outlined a strategy of creating more focused platforms, including its crop protection, Advanta seeds and specialty chemicals businesses. This remains important for investors because the restructuring could affect capital allocation, business visibility and the way different businesses are valued.
Seeds business gains further attention through Egypt acquisition
UPL's seeds business has also remained an important part of its growth strategy. In August, a UPL subsidiary announced plans to acquire the seeds business of Hytech Egypt for around $110 million, expanding Advanta's presence in the Egyptian market. The transaction is part of the company's effort to strengthen its seeds platform internationally.
Advanta operates across multiple crop categories and geographies, making seeds an increasingly important component of UPL's portfolio. The company continues to position the business around higher-value seeds and region-specific agricultural solutions.
At the same time, investors will need to assess whether acquisitions generate sufficient returns relative to the capital deployed, particularly while UPL continues to focus on improving profitability.
UPL reports revenue growth but profitability remains weak
UPL reported revenue from operations of ₹10,181 Cr in Q1 FY27, up 10.47% YoY from ₹9,216 Cr. However, EBITDA increased only 3.87% to ₹1,450 Cr, resulting in a margin decline to 14.24% from 15.15% in Q1 FY26.
The company reported a consolidated PAT loss of ₹73 Cr, although the loss narrowed from ₹176 Cr in the year-ago quarter. PAT attributable to owners stood at ₹10 Cr compared with a loss of ₹88 Cr in Q1 FY26.
|
Metric |
Q1 FY27 |
Q4 FY26 |
QoQ % |
Q1 FY26 |
YoY % |
|---|---|---|---|---|---|
|
Revenue from Operations (₹ Cr) |
10,181 |
18,335 |
-44.47% |
9,216 |
10.47% |
|
Total Income (₹ Cr) |
10,398 |
18,513 |
-43.83% |
9,359 |
11.10% |
|
EBITDA (₹ Cr) |
1,450 |
3,558 |
-59.25% |
1,396 |
3.87% |
|
EBITDA Margin |
14.24% |
19.41% |
-5.16 ppt |
15.15% |
-0.91 ppt |
|
PAT (₹ Cr) |
-73 |
1,294 |
-105.64% |
-176 |
-58.52% |
|
PAT Margin |
-0.72% |
7.06% |
-7.77 ppt |
-1.91% |
+1.19 ppt |
|
PAT (Owners) (₹ Cr) |
10 |
1,061 |
-99.06% |
-88 |
Turnaround |
|
EPS (₹) |
0.12 |
12.57 |
-99.05% |
1.94 |
-93.81% |
Source: Company Filing
READ THIS: Manipal Health Enterprises Redeems ₹5,310 Cr NCDs Using IPO Proceeds
Seeds and non-agro businesses delivered stronger growth
UPL's Crop Protection business remained its largest segment, generating revenue of ₹7,659 Cr, up 5.70% YoY.
The stronger growth came from Seeds & Post Harvest, where revenue increased 24.56% YoY to ₹1,750 Cr. The Non-Agro business also recorded 32.71% growth to ₹848 Cr.
|
Segment |
Q1 FY27 (₹ Cr) |
Q4 FY26 (₹ Cr) |
QoQ % |
Q1 FY26 (₹ Cr) |
YoY % |
|---|---|---|---|---|---|
|
Crop Protection |
7,659 |
15,422 |
-50.34% |
7,246 |
5.70% |
|
Seeds & Post Harvest |
1,750 |
2,187 |
-19.98% |
1,405 |
24.56% |
|
Non-Agro |
848 |
774 |
9.56% |
639 |
32.71% |
|
Less: Inter Segment Revenue |
76 |
48 |
— |
74 |
— |
|
Total Revenue from Operations |
10,181 |
18,335 |
-44.47% |
9,216 |
10.47% |
Source: Company Filing
Management changes add another factor for investors
UPL also disclosed a management change in August, with Toshan Tamhane stepping down as Group Chief Operating Officer with effect from 31 August 2026. The development comes while the company is implementing its restructuring programme and focusing on improving operational performance.
For investors, the combination of restructuring, portfolio changes and management transition makes execution a key factor to watch alongside the company's financial recovery.
Final Takeaway
UPL's September credit-rating outlook upgrade to Stable is a constructive balance-sheet signal, but it does not remove the company's profitability challenge. Revenue growth remains healthy, while margins and earnings need improvement. The restructuring, seeds expansion and management transition will determine whether UPL can turn growth into more consistent shareholder returns.
All topics
Click the link, confirm the box next to sahi.com is checked — ignore any other results.