
Rounding Bottom: Meaning, Formation, and How to Trade
Learn what a rounding bottom pattern is, how it forms, real chart examples, the difference between a rounding bottom and cup and handle pattern, and how traders use it to identify bullish breakout opportunities.
A rounding bottom pattern indicates that selling pressure is fading and buyers are gradually taking control. It helps traders identify potential bullish breakouts, estimate price targets, manage risk with stop-losses, and understand when the pattern acts as a reversal or continuation signal.
The rounding bottom chart pattern suggests a bullish reversal after a prolonged downward market movement, creating a bowl shape. This happens when the volume and the price rise simultaneously, signalling the increase in the investors’ buying intent.
A round bottom pattern forms in 3 stages: decline, consolidation, and recovery. The stock first falls, then moves in a range as buyers and sellers reach a balance. As buying interest increases, the price climbs back towards its earlier high. A breakout above the neckline confirms the pattern and may signal a new uptrend.
This may sound difficult, let's understand the rounding bottom meaning with an example
Real Examples of Rounding Bottom Pattern
Below are examples to understand what is Rounding Bottom Pattern. Let's take Sun Pharmaceuticals and Karur Vysya Bank to examine this pattern in detail.
Case Study 1: Sun Pharmaceuticals
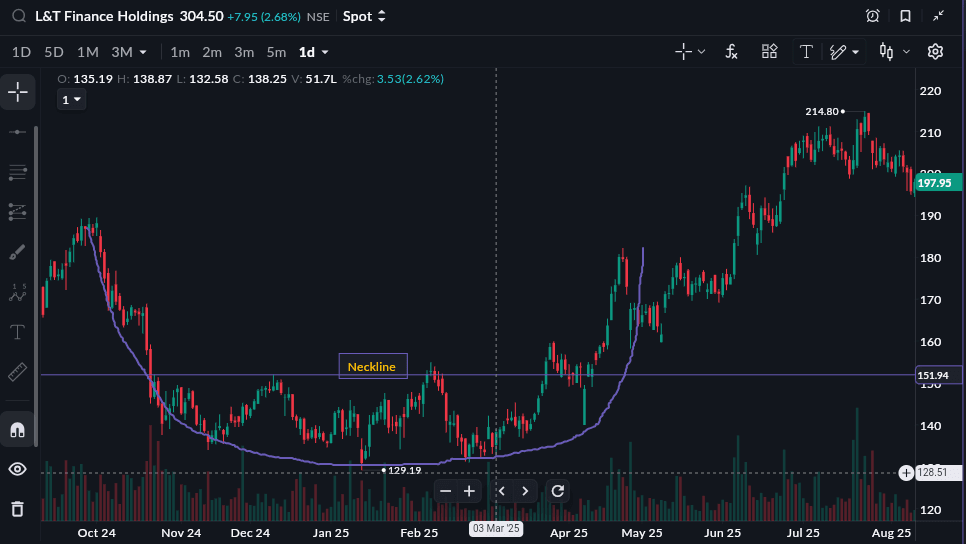
Take a look at the daily chart above. Sun Pharma made its high around October 2024 and then stayed under pressure for the next few months. Instead of falling further, the stock started moving in a narrow range and slowly formed a rounding bottom.
Around June 2025, it finally broke above the resistance, confirming the pattern. After the breakout, the stock came back to retest the same level, found support there, and then resumed its upward move. You can clearly see this breakout, retest and rally in the chart above.
Case Study 2: L&T Finance
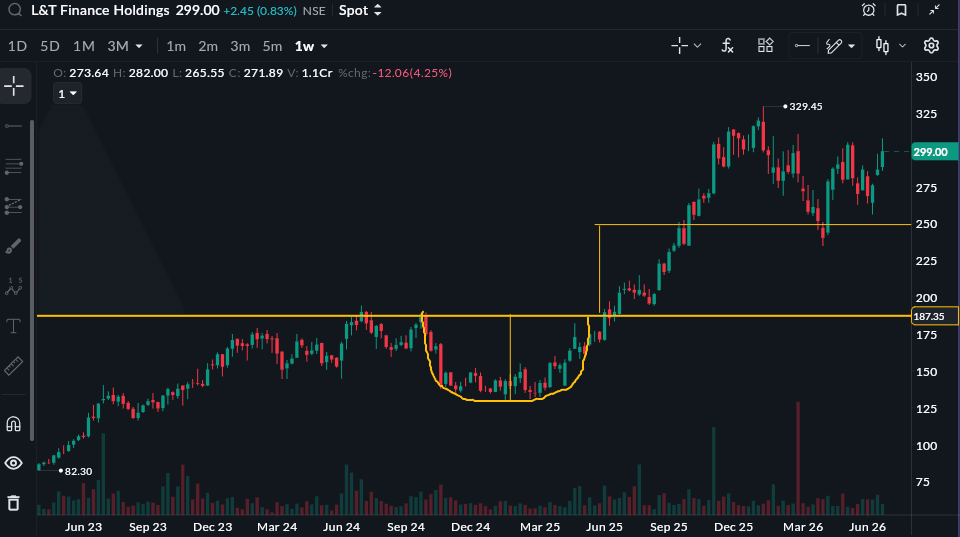
As of 25 June 2026
Take a look at the chart above. L&T Finance remained under pressure from September 2024 to March 2025. After that, selling eased and the stock slowly started recovering, forming a rounding bottom pattern. By September 2025, the stock reached its previous high and finally broke above the resistance after almost a year. Once the breakout happened, buying momentum picked up with higher trading volumes, and the stock moved higher, as you can clearly see in the chart.
How Round Bottom Pattern Formed?
Now you know what is rounding bottom but the formation of round-bottom pattern can be divided into 4 phases, which we will have a look at in detail:
-
Downward Trend: The pattern starts after a prolonged fall in the stock price. Selling pressure remains high, and the stock continues to make lower lows. As the price drops further, buyers gradually begin showing interest at lower levels.
-
Bottom Formation: After the decline, the stock stops falling and starts moving in a narrow range. At this stage, buyers and sellers are almost evenly matched, creating the rounded bottom part of the pattern. This indicates that selling pressure is fading and the stock is finding support.
-
Gradual Recovery: As buying interest increases, the stock slowly starts moving higher. The rise is gradual rather than sharp, showing buyers are steadily gaining control of the trend.
-
Breakout Above Resistance: The stock eventually reaches its earlier high, where resistance is formed. Once the price breaks above this resistance with strong volume, the round bottom pattern gets confirmed. As you can see in many chart examples, a breakout is followed by a strong upward move.
Read this also: How Much Should You Invest Every Month to Build ₹1 Crore in 5 yr
Rounding Bottom as a Reversal and Continuation Pattern
Rounding Bottom is a well-known reversal pattern. However, it is also a continuation pattern as well. Understanding how the rounding bottom can be used both as a reversal and a continuation pattern can help in making better trading decisions.
We will examine the round-bottom pattern from the perspectives of both reversal and continuation mechanisms.
Rounding Bottom as a Reversal Pattern
A rounding bottom pattern is a bullish reversal pattern that forms after a prolonged decline. The stock price first falls, then spends some time moving in a range before gradually starting to recover. This creates a rounded "U" shape on the chart.
As buying interest increases, the stock slowly moves back towards its earlier high. Once it breaks above the resistance level with strength, the pattern gets confirmed and may signal the start of a new uptrend.
Difference Between Rounding Bottom and Cup and Handle Pattern?
A rounding bottom is known as a reversal pattern, but in some cases, it can also act as a continuation pattern. Here, the stock remains in an uptrend, takes a pause, and moves within a rounded formation before resuming its upward journey.
During this phase, the price consolidates and forms a "U" shape, allowing the stock to absorb selling pressure and build fresh buying momentum. Once the price breaks above the neckline resistance, the uptrend continues.
Traders also compare this pattern with the Cup and Handle pattern because both have a similar rounded "U" shape. However, there are some differences between the two, which are explained in the table below.
|
Criteria |
Round Bottom Pattern |
Cup and Handle Pattern |
|
Shape |
‘U’ shape curve like a saucer |
‘U’ shape curve with a downward slope that looks like a handle |
|
Trend Signals |
Downtrend for a long period |
A small pause before the beginning of the bullish period |
|
Breakout Direction |
Upward and above the neckline resistance line |
Upward and above the neckline resistance line |
|
Trader Signals |
Signals the beginning of the bullish phase |
Indicates a renewed bullish phase after a brief pause |
Read this also: Triangle Pattern: Meaning, Formation, Types, and How to Trade
How to Trade Rounding Bottom Candlestick Pattern?
Once you understand the rounding bottom pattern's meaning, you can use it for trading effectively. This is how you can strategise better when using this pattern:
-
Entry Point: Most traders may prefer buying when the stock price touches just above the neckline resistance and when the volume is high. A higher volume suggests a spike in demand. However, the other approach is to wait for the price to fall slightly after the initial spike and then buy when it rises.
-
Stop-loss Placement: Placing a stop-loss limits risk and prevents loss. A stop-loss just below the most recent dip, under the older neckline, or deep into the ‘U’ pattern are the three safe spots to consider.
-
Locking Your Profit Target: Use the measured-move method to determine the profit level at which you can exit. Measure the depth of the ‘U’ pattern and add the difference to the breakout amount to determine your profit target.
For example, if the neckline breakout price was ₹500 and the lowest point price was ₹400, then the pattern depth is ₹100. Your profit target would then be ₹500 + ₹100 = ₹600, the target profit price at which you can exit.
Common Mistakes Traders Make Using Rounding Bottom Pattern
There are certain mistakes that traders can avoid while using the round bottom pattern:
-
Misidentifying the round-bottom pattern can cause severe losses.
-
Ignoring volume change may result in you prematurely entering and exiting the trade.
-
Patience is the key as the pattern formation takes time. Inaccurate timing of entering and exiting the trade may cause you to miss your profit targets.
Conclusion
Rounding-bottom pattern can provides trading opportunities, and it is important to stay patient and keep an eye on volume changes to determine the correct time to enter and exit the trade with profits. Use stop-loss to manage your risks and ensure you navigate any market movement efficiently.