
Triangle Pattern: Meaning, Formation, Types, and How to Trade
Learn what a triangle chart pattern is, how ascending, descending and symmetrical triangle patterns form, real chart examples, breakout strategies, common mistakes and how traders use them in technical analysis.
Triangle chart patterns are widely used to identify trend continuation and breakout opportunities. Ascending, descending, and symmetrical triangles each indicate different market conditions and, when combined with volume confirmation and risk management, can improve trading accuracy and decision-making.
As the name suggests, a triangle chart pattern is a consolidation formation on the chart that resembles a triangle. It forms when two prominent trendlines converge towards each other over time as the stock’s prices move within a progressively narrowing range.
As the gap narrows, the market enters a period of indecision before choosing its next direction. Usually, a breakout occurs right after the market consolidation.
Triangle patterns often continue the existing trend, but they can also reverse. It's best to wait for a confirmed breakout before trading.
Real Examples of Triangle Chart Patterns
Now you know the triangle pattern meaning, but understanding different triangle patterns on the chart with real examples helps identify them correctly. Let’s look into some real examples of triangle pattern formations:
Federal Bank: Daily Ascending Triangle Breakout
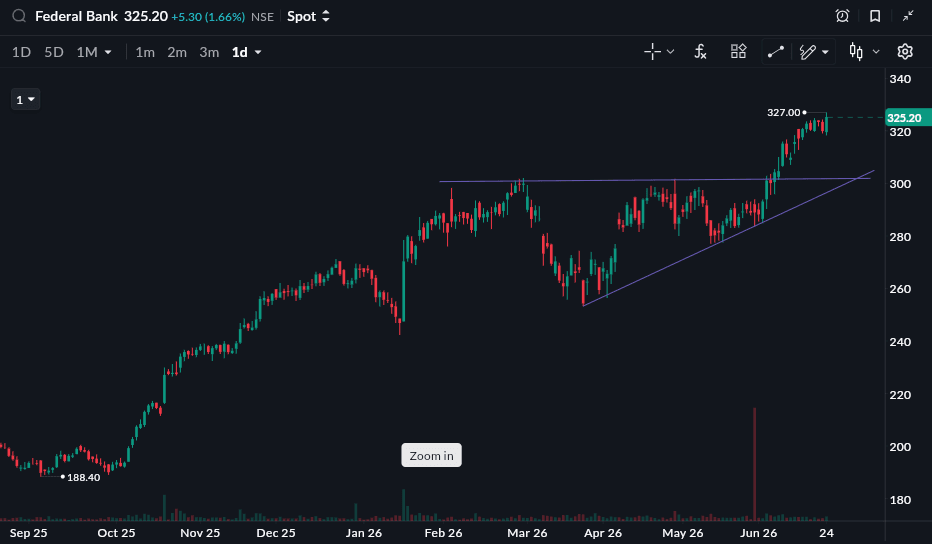
As of 24 June 2026
This chart is an example of an ascending triangle pattern and is meant for educational purposes only, not as an investment recommendation. Here, the price kept making higher lows while facing resistance at a fixed level. As the pattern developed, buying pressure increased, and once the stock broke above the resistance, it saw a strong rally, as shown in the chart.
IZMO: Weekly Symmetrical Triangle Breakout
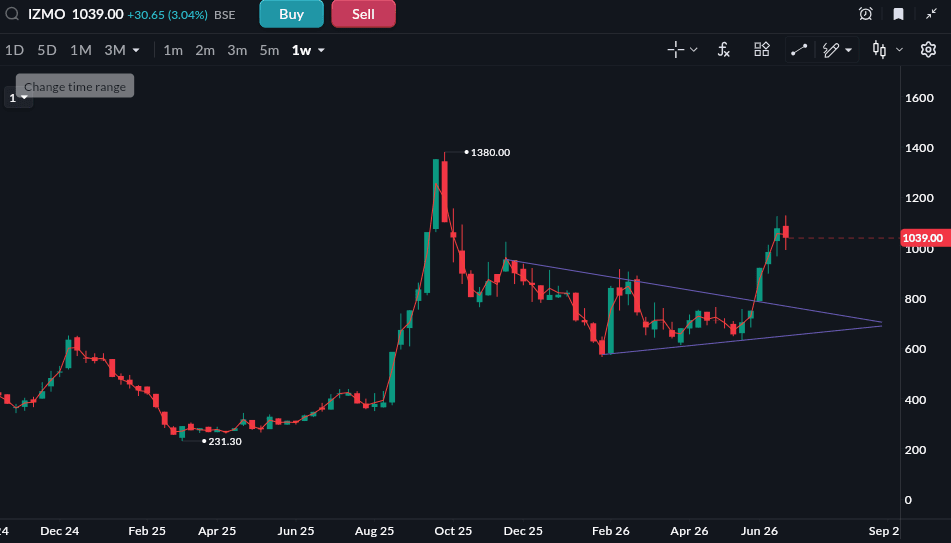
As of 24 June 2026
This chart shows a symmetrical triangle pattern and is meant for educational purposes only, not as an investment recommendation. Here, the price moved within a narrowing range as buyers and sellers gradually came closer together.
After months of consolidation, the stock broke above the upper trendline, leading to a strong upward move. As you can see in the chart, the breakout was followed by a sharp rally.
Why Do Triangle Chart Patterns Form?
Triangle chart patterns represent a market tension between buyers and sellers. When a triangle pattern forms, it means neither buyers nor sellers have enough strength to set a prominent price trend. So, the stock’s price moves within a narrow range, and fluctuations become smaller.
As the pattern nears its apex (the point where the trendlines meet), market tension intensifies. Eventually, a breakout takes place as one side gains control of the price trend.
READ THIS ALSO: VWAP Scalping Strategy for Nifty & Bank Nifty
Types of Triangle Chart Patterns
Triangle chart patterns are classified into 3 categories: ascending triangle, descending triangle, and symmetrical triangle. Let’s understand each in detail
1. Ascending Triangle Chart Pattern
An ascending triangle chart pattern represents a bullish trend. An ascending triangle includes a horizontal resistance line and an upward-moving support line. It forms when buyers keep pushing prices higher and higher, and sellers attempt to defend resistance. Ultimately, buying pressure becomes so overwhelming that a bullish, upside breakout occurs.
As of 24 June 2026
How Does This Pattern Form?
It forms when
-
The resistance stays fixed at a particular price level.
-
Buyers enter earlier during every price decline.
-
Higher lows cause price compressions against resistance.
How to Trade Ascending Triangle Charts?
-
It’s ideal to enter after a confirmed breakout above resistance.
-
You should look for increased trading volume.
-
To find the target, measure the triangle's height and add it to the breakout price. If the stock breaks below the triangle, subtract the same height from the breakdown price.
-
For example, if the triangle height is ₹100 and the breakout is at ₹500, the target will be around ₹600.
-
You can place a stop-loss below the most recent swing low.
2. Descending Triangle Chart Pattern
Opposite to an ascending triangle pattern, a descending triangle pattern represents a bearish trend. It includes a horizontal support line and a downward-moving resistance line.
This pattern forms when sellers become aggressive, and buyers fail to defend support. Repeated formations of lower highs are common in this pattern.
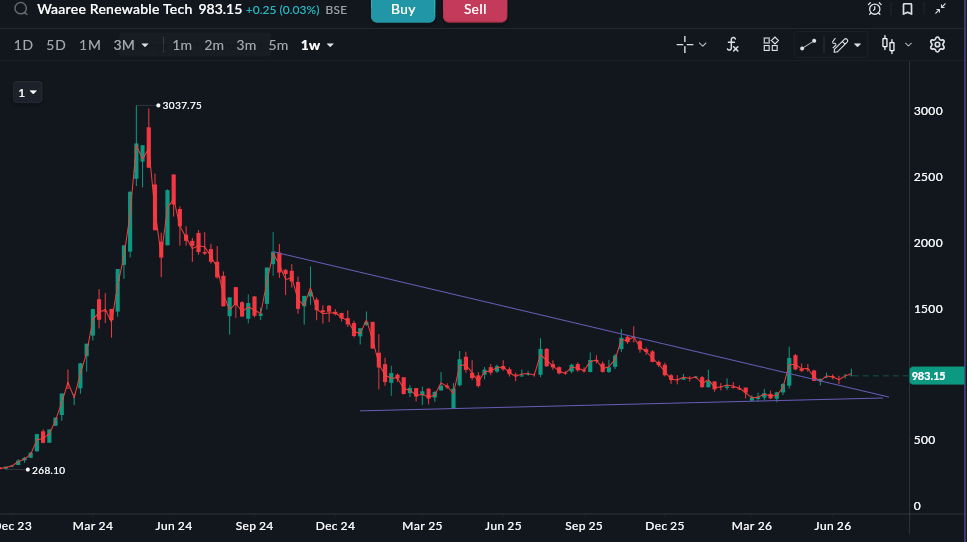
As of 24 June 2026
How Does the Descending Triangle Pattern Form?
-
The stock keeps finding support at nearly the same price level.
-
After every bounce, sellers push the price lower.
-
As a result, the stock continues to make lower highs.
How to Trade a Descending Triangle Pattern?
-
Wait for a confirmed breakdown below the support level.
-
Keep your stop-loss above the recent lower high.
-
Estimate the target by measuring the triangle's height and subtracting it from the breakdown price.
-
A breakdown with higher trading volume is considered a stronger signal.
3. Symmetrical Triangle Pattern
A symmetrical triangle pattern doesn’t represent either bullish or bearish trends. Rather, it presents neutral price trends, and it can break in either direction. It gets formed when prices create higher lows and lower highs.
How Does This Pattern Form?
It forms when
-
Buyers keep bidding prices higher.
-
Sellers keep on pushing prices lower.
-
Neither side has a clear, decisive advantage.
How to Trade Symmetrical Triangle Charts?
-
You should wait for breakout confirmation before entering.
-
Always trade in the direction of the breakout.
-
Remember that volume is a validation tool here.
-
Place your stop-loss on the opposite side of the breakout. For example, after an upside breakout, keep it below the lower trendline, and after a downside breakout, keep it above the upper trendline.
READ THIS ALSO: Scalping vs Intraday Trading
Understanding the Structure of a Triangle Chart Pattern
No matter which type of triangle pattern you're looking at, a few things remain the same. Understanding these will help you identify the pattern more accurately.
-
Support Line: This is the level where buyers repeatedly step in and prevent the price from falling further.
-
Resistance Line: This is the level where sellers keep stopping the price from moving higher.
-
Apex: This is the point where the support and resistance lines come close to each other.
-
Breakout: The pattern is confirmed when the price breaks above the resistance or below the support level.
-
Volume: Trading volume is usually low while the pattern is forming and often picks up during the breakout.
Common Mistakes Traders Make While Trading Triangle Chart Patterns
After knowing all about what is triangle pattern, let’s look at some of the most common mistakes repeated while trading triangle patterns and how to fix them
-
Entering too early: Don't enter a trade before the breakout is confirmed. Early entries often result in false breakouts and unnecessary losses.
-
Ignoring volume: A breakout is more reliable when it's supported by higher trading volume. Low-volume breakouts can fail quickly.
-
Trading near the apex: As the triangle reaches its end, price movement can become unpredictable. It's usually better to wait for a clear breakout.
-
Ignoring the overall market trend: Even a strong pattern can fail if the broader market is moving in the opposite direction. Always check the market trend before taking a trade.
-
Forcing a triangle pattern: Not every consolidation is a triangle. Make sure the pattern is clearly formed before making a decision.
Conclusion
When it comes to technical analysis in trading, triangle chart patterns are among the most reliable and helpful tools. These patterns help traders identify market indecision and prepare for potential breakout opportunities. Most importantly, they help traders understand market psychology, making trading effortless and less risky.
As this comprehensive guide has explained, these patterns help gain valuable insights into the market trends. However, these patterns aren’t decisive factors in isolation. They work best when you combine them with volume analysis, risk management, and trend confirmation. So, use these patterns wisely to navigate markets fast.