
Rectangle Pattern: Meaning, Formation, Types, and How to Trade It
Price often moves sideways before making its next big move. The rectangle pattern helps traders identify these consolidation phases and prepare for potential bullish or bearish breakouts.

The rectangle pattern signals a period of price consolidation before the next major move. It can appear in both uptrends and downtrends, with breakout direction, trading volume and risk management playing an important role in trading decisions.
A rectangle pattern is a chart pattern that forms when the price moves sideways between a clear support and resistance level. During this period, the price repeatedly moves between the two horizontal levels, showing that neither buyers nor sellers have full control of the market.
The pattern usually appears after an existing uptrend or downtrend and is often treated as a continuation pattern. However, it can also lead to a trend reversal in some cases.
As the pattern develops, trading volume may decline. Traders generally wait for the price to break above resistance or below support before taking a trading decision. A breakout with higher volume is usually considered a stronger confirmation of the price move.
Real Example of Rectangle Pattern
To better understand the rectangle pattern's meaning, let’s look at some real examples of rectangles.
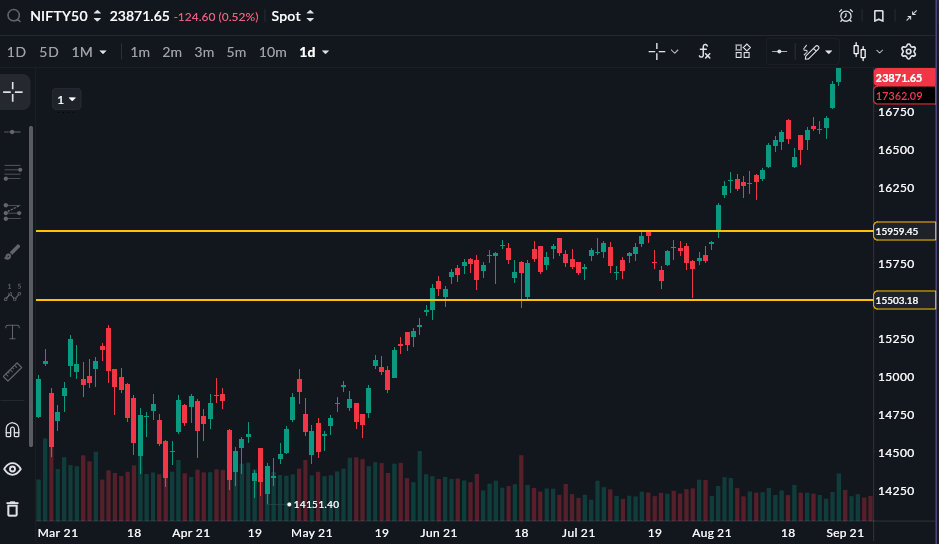
As of 23 July 2026
Why Do Rectangle Patterns Form?
When a rectangle pattern forms on the chart, it simply means that buyers and sellers are evenly matched during that time period. When the price reaches the support levels, buyers enter and push it up.
Similarly, sellers enter and bring down the price when it approaches the resistance level. So, a sideways movement becomes prominent. After a while, one side becomes stronger, gains control over the market, and the breakout happens.
What does a rectangle pattern primarily indicate before a breakout?
Types of Rectangle Patterns
There are 3 major types of rectangle patterns: bullish rectangle, bearish rectangle, and bearish rectangle. Let’s understand each in detail:
1. Bullish Rectangle
A bullish rectangle pattern generally forms during an upward market trend. After pushing the price trend up, buyers take a short break when this pattern forms. At this phase, the price moves sideways, not upwards. When buyers gain control over the trend again, the price breaks above the resistance level. An increase in trading volume also becomes prominent when this pattern forms.
2. Bearish Rectangle
Unlike bullish rectangles, a bearish rectangle forms during a downward market trend. When it forms, it indicates that sellers have paused after a sharp price decline. This is when the price moves sideways instead of going down further. After a while, the selling pressure increases and the price breaks below the support level. Trading volume increases in this case too.
3. Reversal Rectangle
Despite being continuation patterns in general, rectangles sometimes signal reversals. When the breakout happens in the opposite direction of the trend, it’s called a reversal rectangle.
READ THIS ALSO: Types of Gaps in Trading
How to Identify a Rectangle Pattern?
As already mentioned, identifying a rectangle pattern on the chart is easy. Let’s understand how you can spot this pattern-
- First, there has to be an upward or downward market trend before this pattern forms.
- Next, the price must bounce from the same support level multiple times.
- There should be repeated resistance at the same resistance level.
- Both levels should have multiple price touches. At least two price touches on both levels are mandatory. More price touches make the pattern stronger.
- The price must remain within the same range instead of creating a new trend.
- Trading volume generally becomes lower when a rectangle pattern forms.
How to Trade Rectangle Patterns?
There are some common ways to trade rectangle patterns smartly. Let’s check them out:
Entry
Traders often enter the trade using a set of strategies.
- Breakout Trading: With this strategy, traders usually wait until the price breaks above the resistance level or below the support level before entering the trade. Whether the trade is bullish or bearish depends upon the breakout direction.
- Retest Trading: Traders don’t enter the trade immediately after the breakout. They wait until the price retests the broken level.
- Range Trading: Traders trade within the rectangle before breakouts. They buy near the support level and sell near the resistance level in this trading strategy. However, this is risky because the breakout direction can flip the entire story.
Target
Setting profit targets is important while trading rectangle patterns. A smart way to do this is to measure the height of the rectangle. You just have to calculate the vertical distance between support and resistance. Then just project the distance from the breakout point to set the profit target correctly. That’s all.
Stop Loss
You should place the stop loss after considering the breakout direction properly. If the price breaks above the resistance levels, the stop loss needs to be placed below support. On the other hand, if the price breaks below support, the stop loss must be placed above the resistance level.
READ THIS ALSO: Rounding Bottom: Meaning, Formation, and How to Trade
Common Mistakes Traders Make When Trading Rectangle Patterns
Traders often make small mistakes that cause them losses when trading rectangle patterns. Let’s identify these mistakes:
- Entering before breakout confirmation is the most common mistake, and beginners should strictly avoid it.
- Many traders ignore the trading volume, and they suffer later. You must consider the trading volume.
- Trading against the overall market trend also doesn’t make sense. You should follow the market trend strictly.
- Traders often draw the support and resistance levels incorrectly when trading rectangle patterns. Make sure this doesn’t happen in your case.
- Using a stop-loss is mandatory for risk management. Traders who don’t use it often end up bearing huge losses.
For a bullish rectangle breakout, where should the stop-loss generally be placed?
Practical Tips to Trade Rectangle Consolidation Patterns
Let’s check out some proven techniques to trade rectangle patterns without worrying too much:
- Don’t rush a trade: Don’t consider trading until the price moves multiple times between the support and resistance levels.
- Wait for breakout confirmation: Don’t get overwhelmed by the price movements, and wait patiently for a breakout confirmation. This reduces the chance of a false breakout.
- Enter at the right time: You should buy when the price breaks above the resistance level. Similarly, sell when the price breaks below the support level. Patience is the key here, and it’ll be rewarding.
- Place your stop loss accurately: Placing your stop loss smartly makes risk management easier. For a bullish breakout, it’s better to place the stop loss slightly below the support level. For a bearish one, it should be placed slightly above the resistance level.
- Set profit target right: It’s important to set your profit target right, and you can do it using the measured move technique. The formula is (Price Target = Height of Rectangle + Breakout Price) for bullish breakouts and (Price Target = Breakdown Price − Height of Rectangle) for bearish breakouts.
Conclusion
Rectangle patterns are among the most useful patterns for technical analysis. This pattern represents the competition between buyers and sellers when the market is taking a pause. As already mentioned, the key to trading rectangle patterns is waiting for breakout confirmation patiently instead of guesswork.
Like any other pattern on the chart, a rectangle pattern can’t guarantee profits. Instead, it should be used as an indicative tool to plan your trades. You must use a stop-loss, follow a disciplined trading plan, and manage risk to gain decent profits.
All topics
Click the link, confirm the box next to sahi.com is checked — ignore any other results.