
Types of Gaps in Trading: Common, Breakaway, Runaway, Exhaustion & Island Reversal
Different types of gaps reveal different market signals. Understanding where they form, the trading volume behind them and what they indicate can help traders identify trend continuation, reversals and potential trading opportunities.

Gaps in trading are blank spaces on price charts caused by sudden changes in market sentiment. This article explains what trading gaps are, the five major types of gaps, how to identify them, their differences, and important points traders should remember before using gap-based trading strategies.
You log in to your trading account on a Monday morning and notice a stock has jumped 5%. Your chart shows no trading between last week's Friday close and Monday’s open. It shows a blank space.
At first glance, this blank space on a price chart may look like a glitch, but it isn't. It is called a gap, and it signals a sudden shift in market sentiment. Traders use these gaps to understand buying and selling pressure, spot potential price moves, and identify trading opportunities.
Not all gaps are the same. They are broadly divided into 5 types, and each tells a different story about the market. In this blog, let's understand the meaning of gaps, their types, and how traders use them.
What is a Gap in Trading?
Gaps appear as blank spaces on your trading charts, where a stock price may have increased from one level to another despite no trades taking place during a session.
For example, if a stock closed at ₹500 on Friday and opened at ₹550 the next Monday, the chart will show a gap on your chart and can point in either of the two directions – upward or downward.
Types of Gaps in Trading
There are 5 types of gaps in trading. Each gap can help you understand the market sentiment and decide when to trade, hold the stock, or exit it. We will have a look at the types of gaps in trading.
1. Common Gap
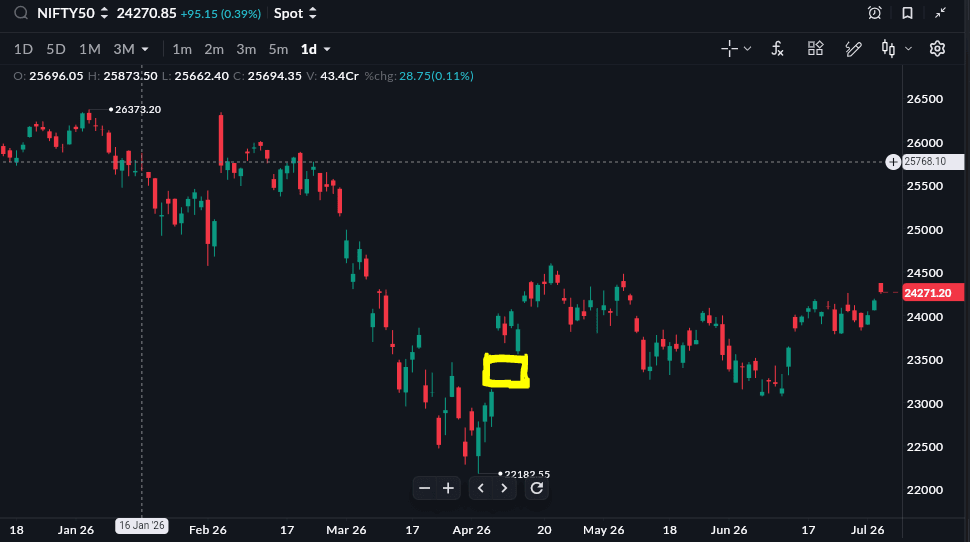
Common Gaps are the most frequently seen gaps on a price chart. They appear when a stock is trading in a sideways range and trading volume is low. As there is no major news or strong buying or selling interest, the price forms a small gap but often returns to its earlier level within a few trading sessions, filling it.
As a trader, if you notice a gap with low trading volume and no clear change in the trend, it is most likely a common gap.
2. Breakaway Gap
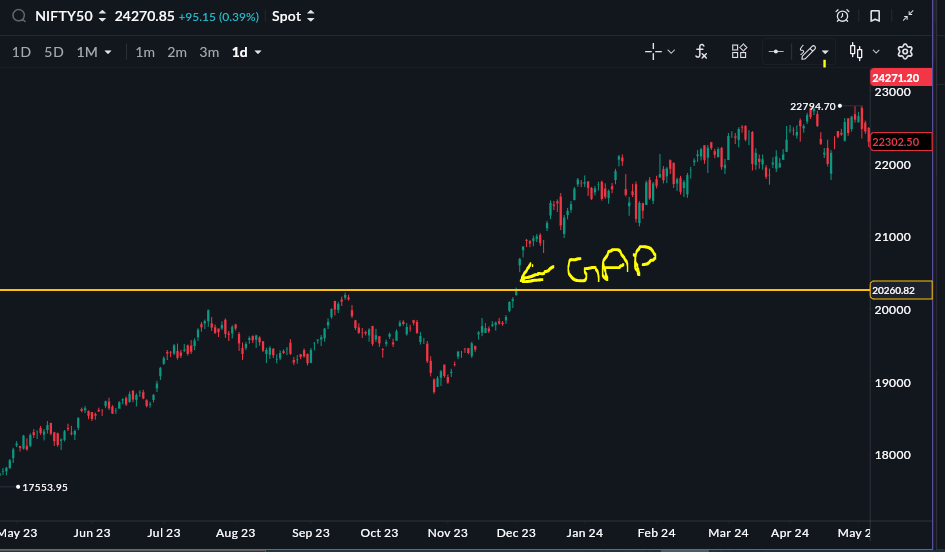
A Breakaway Gap forms when a stock breaks out of a consolidation zone with strong momentum. A consolidation zone is a price range where the stock has been trading for several days or weeks. The upper end acts as resistance, while the lower end acts as support.
This gap is backed by a sharp rise in trading volumes, showing strong conviction behind the breakout. Higher than average volume increases the chances that the new trend will continue. On the other hand, if the breakout happens on low volume, there is a higher risk of a false breakout, where the price quickly moves back into the earlier trading range.
After the breakout, the old resistance often turns into new support in an upward breakout, while the old support becomes new resistance in a downward breakout.
For traders, a breakaway gap often signals the start of a new trend, making it one of the most important gaps to watch.
Which type of gap usually signals the beginning of a new market trend?
3. Runaway Gap
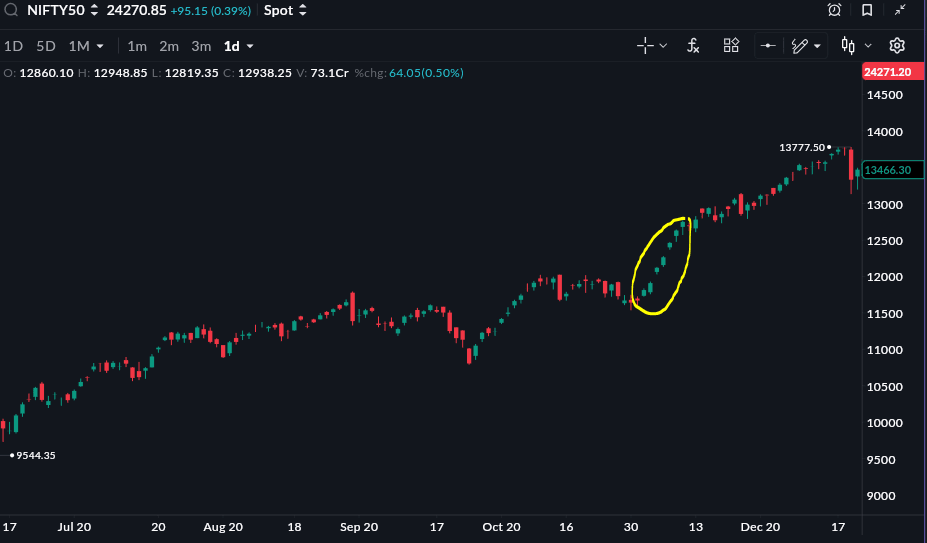
A Runaway Gap appears when a stock is already in a strong uptrend or downtrend and market participants continue to push the price in the same direction. In an uptrend, traders who missed the initial rally often jump in, leading to aggressive buying and a gap-up.
In a downtrend, panic selling can trigger a gap-down as investors rush to exit their positions. Runaway gaps are backed by high trading volumes, confirming that the existing trend is gaining strength rather than reversing.
Also known as a Measuring Gap, this gap usually appears in the middle of a strong trend. It tells traders that the current uptrend or downtrend is likely to continue, rather than end.
4. Exhaustion Gap
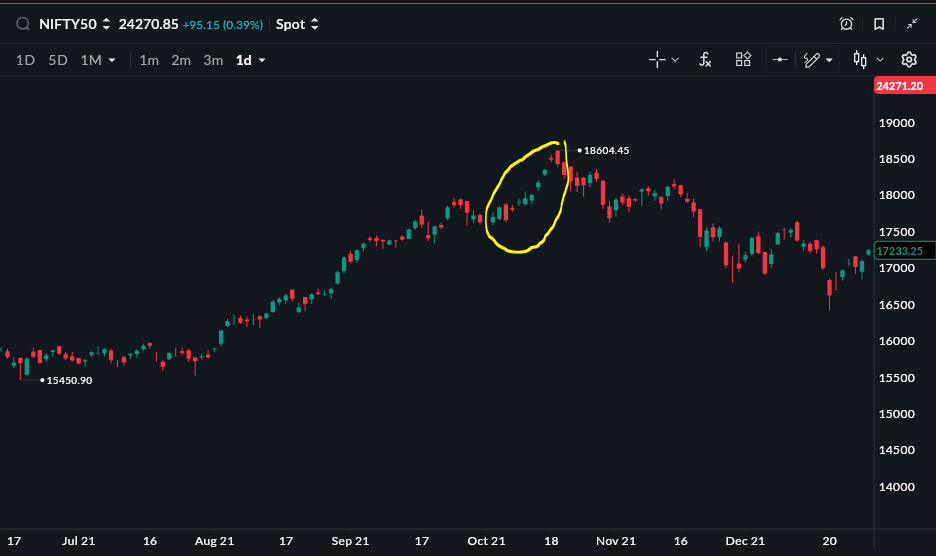
An Exhaustion Gap signals that a strong trend is coming to an end. Unlike a runaway gap, which indicates that the trend may continue, an exhaustion gap suggests that buyers or sellers are running out of strength.
This gap is often backed by very high trading volumes. In an uptrend, investors rush to buy due to fear of missing out on further gains. In a downtrend, panic selling leads to a sharp gap-down as traders exit their positions. At first glance, it may look like the trend is getting stronger, but in reality, the market is losing momentum.
One of the biggest signs of an exhaustion gap is that it gets filled quickly, as the price starts reversing soon after. For traders, this is a signal to book profits or prepare for a trend reversal, rather than chase the existing trend.
5. Island Reversal Gap
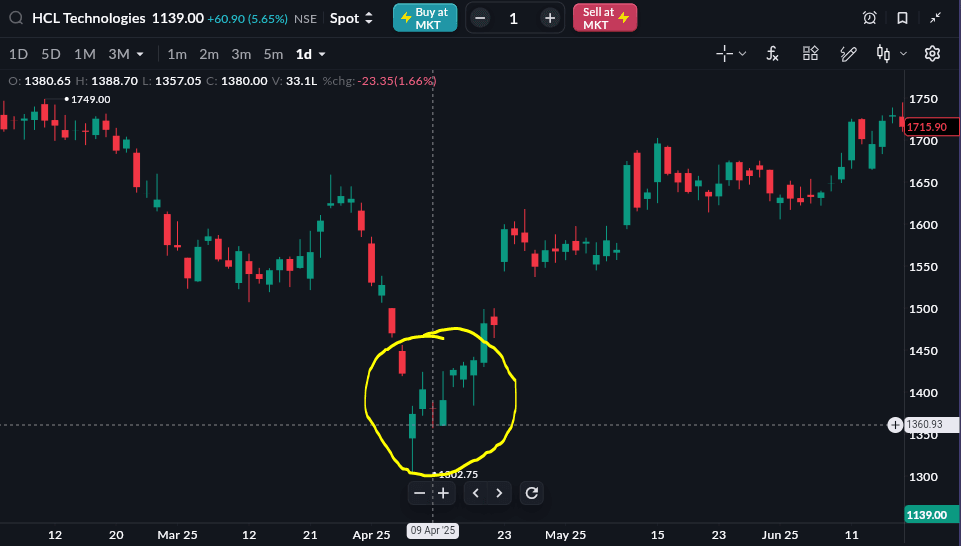
An Island Reversal Gap is a chart pattern formed when a stock creates two gaps in opposite directions, leaving a small cluster of candles isolated like an island.
The pattern begins when the stock price moves sharply and creates the first gap. It then trades within a range for a few days, forming a cluster of candles. After this, the price suddenly reverses direction and creates a second gap, leaving those candles separated from the rest of the chart.
For example, suppose a stock is in a downtrend and gaps down to ₹110. It trades around this level for a few days and then suddenly gaps up to ₹115. The candles between the gap down and gap up form the island. Since the stock reverses upwards, this pattern is called a Bullish Island Reversal.
Common Gap vs Breakaway Gap vs Runaway Gap vs Exhaustion Gap
Identifying the types of gaps can be a challenge, and misidentifying them may cause losses. Given below in the table are the differences between the gaps mentioned and how to identify them:
| Gap Types | Where It Forms on the Chart | Volume | Time Taken to Fill the Gap | Indication |
|---|---|---|---|---|
| Common | Inside the trading pattern | Low/Below Average | Within a few days | No new indication |
| Breakaway | Signals the beginning of a new trend | Extremely high | Rarely filled | Beginning of a new trend |
| Runaway | Occurs in the middle of an ongoing trend | Stays consistently above average | 60%-70% stays unfilled | Continuation of the trend |
| Exhaustion | Occurs at the end of an ongoing trend | Massive spike | 80% filled | Projects reversal ahead |
| Island Reversal | End of a trend | High volume on both ends | Gaps filled on reversal completion | Powerful reversal happens |
Which gap type is most likely to appear in the middle of an ongoing trend?
Things to Remember When Trading Gaps
Given below are certain points you must remember when trading gaps in the stock market to avoid losses:
- Always confirm the gap before trading. Misidentifying gaps can cause severe losses.
- Do keep an eye on the overall market sentiment. For example, an exhaustion gap is more correct at the end of a trend, while a breakaway gap works well during a bullish market.
- Stay cautious with penny stocks, as they often have low trading volumes and limited liquidity. Even a few large buy or sell orders can cause sharp price movements. You should trade such stocks only if you understand the risks and have a tested strategy in place.
Conclusion
Gaps in trading can be used for predicting shifts in market movement and gaining insights into trading opportunities and market sentiments.
Correctly identifying the types of gaps can help traders make better trading decisions and enjoy maximum profits. Each gap in the share market indicates different market movements, and it is necessary to understand them properly.
All topics
Click the link, confirm the box next to sahi.com is checked — ignore any other results.