
How P&G Health Share Performed after Q1 Results 2027
Procter & Gamble Health reported moderate revenue growth but strong profit growth in Q1 FY27, while its stock remained under pressure over the past year despite improved profitability.

Procter & Gamble Health Q1 Results FY2027: Procter & Gamble Health grew revenue 7% to ₹364 crore in the June 2026 quarter and reported profit after tax of ₹96 crore, up 45%. Most of that profit jump came from a one-off ₹31.8 crore gain on selling its Worli office. Profit before that exceptional item was ₹64.4 crore, slightly below the ₹66.2 crore of a year earlier.
Procter & Gamble Health, the maker of Neurobion, Seven Seas and Polybion, reported first-quarter results on 6 August 2026. Revenue from operations rose 7% to ₹364 crore from ₹339 crore in Q1 FY26, though it was 2% lower than the March quarter. Reported profit after tax was ₹96 crore against ₹66 crore, and earnings per share were ₹57.92 against ₹39.87.
The profit figure needs a footnote. During the quarter the company sold its office premises in Worli, Mumbai, for ₹33.3 crore against a carrying value of ₹1.5 crore, booking an exceptional gain of ₹31.8 crore. Profit before that item was ₹64.4 crore, marginally lower than the ₹66.2 crore earned a year earlier. The underlying business grew revenue but not profit.
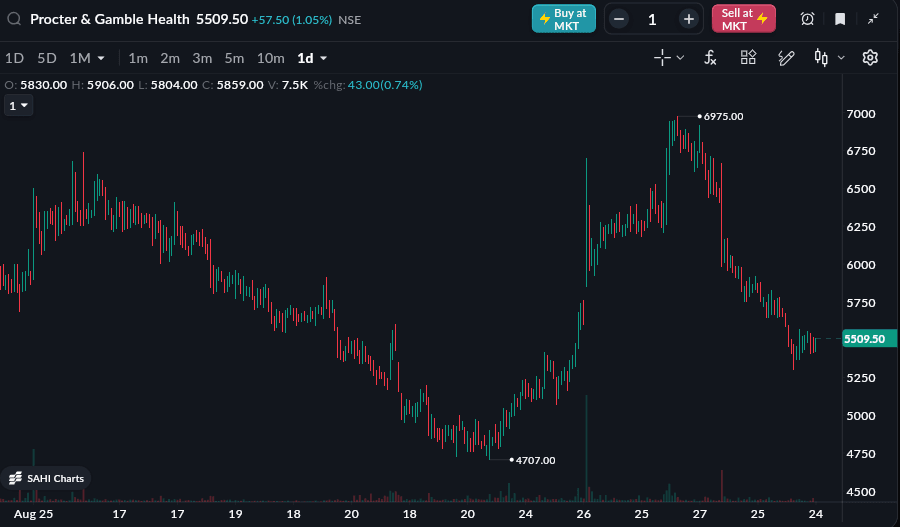
Procter & Gamble Health shares have delivered 3.72% returns year-to-date, while the stock has declined 12% over the past year, from September 24, 2025, to September 24, 2026. As the chart shows, the stock has remained in a downtrend over the past year.
As of 24th Sep, 11.10 AM
READ THIS ALSO: SBI Life Premium Growth, IRDAI Reforms and Q1 FY27 Results
Procter & Gamble Health Q1 FY27 Results Highlights
EBITDA before other income was ₹100 crore, up 10% from ₹90 crore a year earlier, and the EBITDA margin improved to 27.4% from 26.7%. Against the March quarter, however, EBITDA fell 27% and the margin dropped from 36.6%. The fourth quarter is typically the strongest for the company because of year-end trade loading, so part of the sequential decline is seasonal.
Total revenue including other income was ₹368 crore, up 7%. The reported PAT margin of 26.4% against 19.5% a year earlier is inflated by the property gain; on an underlying basis the margin was closer to 17.7%, a touch below last year.
|
Metric |
Q1 FY27 |
Q4 FY26 |
QoQ % |
Q1 FY26 |
YoY % |
|---|---|---|---|---|---|
|
Revenue from Operations (₹ Cr) |
364 |
370 |
-1.82% |
339 |
7.37% |
|
Total Revenue (₹ Cr) |
368 |
374 |
-1.83% |
343 |
7.24% |
|
EBITDA (Excl. Other Income) (₹ Cr) |
100 |
136 |
-26.54% |
90 |
10.25% |
|
EBITDA Margin |
27.38% |
36.60% |
-9.22 pp |
26.67% |
+0.72 pp |
|
PAT (₹ Cr) |
96 |
95 |
1.64% |
66 |
45.29% |
|
PAT Margin |
26.44% |
25.54% |
+0.90 pp |
19.54% |
+6.90 pp |
|
EPS (₹) |
57.92 |
56.99 |
1.63% |
39.87 |
45.27% |
Source: Company Filing
Procter & Gamble Health Financial Performance and Shareholding Pattern
The company has delivered steady long-term profit growth despite relatively modest sales growth. Sales grew at a compounded rate of 4% over 10 years, 1% over five years and 8% over three years. Profit growth has been stronger, with compounded profit growth of 20% over 10 years, 5% over five years and 19% over three years.
TTM profit growth stood at 11%. The stock delivered a 22% CAGR over 10 years, but the pace slowed to 3% over three years, while the stock declined ~13% over the last year. Return on equity remained strong at 31% over 10 years and increased to 62% in the latest year.
The shareholding pattern has remained relatively stable. Promoters have consistently held 51.82% during the period from September 2023 to June 2026. Foreign Institutional Investors (FIIs) held 7.38% in September 2023, compared with 6.33% in June 2026, while Domestic Institutional Investors (DIIs) held 12.44% in June 2026, compared with 12.30% in September 2023.
Public shareholding increased from 28.50% to 29.41% during the same period. The number of shareholders, however, declined from 57,919 in September 2023 to 49,056 in June 2026.
Procter & Gamble Health Dividend History
The company has consistently paid both interim and final dividends over the years. In 2026, it declared a final dividend of ₹45 per share with a dividend yield of 0.78%, followed by an interim dividend of ₹110 per share with a yield of 2.01%.
In 2025, the company paid a final dividend of ₹45 per share and an interim dividend of ₹80 per share. The final dividend stood at ₹60 per share in 2024, while the interim dividend was ₹50 per share.
In 2023, the company paid a final dividend of ₹50 per share and an interim dividend of ₹45 per share. Earlier, it paid a final dividend of ₹11.50 per share and an interim dividend of ₹41 per share in 2022.
Conclusion
Procter & Gamble Health grew revenue 7.37% YoY in Q1 FY27 and reported PAT up 45.29% YoY, though most of that increase came from the one-off gain on the Worli office sale. While EBITDA margin declined sequentially from Q4 FY26, it remained higher than the year-ago period.
The stock performance, however, has been weaker over the past year, despite the recent improvement in profitability. Investors tracking the stock should therefore watch the company’s revenue growth, margins, profit performance and share price trend in the coming quarters.
All topics
Click the link, confirm the box next to sahi.com is checked — ignore any other results.