
SBI Life Share Price: Premium Growth, IRDAI Reforms and Q1 FY27 Results
SBI Life continues to see strong premium and protection growth, but proposed IRDAI changes to insurance distribution and a Rajasthan GST order have added new regulatory monitorable for investors.

SBI Life Insurance maintained strong new-business momentum in August, while a September board appointment and a GST order added fresh corporate developments as proposed insurance reforms put the sector under scrutiny.
SBI Life Insurance has seen a mix of positive business trends and regulatory developments in September 2026. New business premium growth across the life insurance industry remained strong in August, while SBI Life continued to strengthen its operating and governance framework.
At the same time, the proposed changes to insurance distribution rules have emerged as an important sector-wide issue for life insurers, with potential implications for commissions, expenses and distribution economics. SBI Life also received a GST-related order from Rajasthan on September 25, against which it plans to appeal.
August Premium Growth Keeps SBI Life's Growth Story Intact
Life insurers reported a 33% YoY increase in total new business premium to ₹41,198 Cr in August 2026, according to industry data released in September. Growth was led by group and single-premium business, although retail-weighted premium growth was more moderate. SBI Life was among the insurers reporting stronger retail-oriented premium growth during the month.
The August trend is important for SBI Life because the company's Q1 performance was already supported by strong first-year premium growth. A sustained improvement in individual and regular-premium business would provide better visibility for future value creation than growth driven primarily by single-premium or group business.
SBI Life's own Q1 disclosure showed that its first-year premium increased nearly 40% YoY, while its protection business also recorded strong growth. The company subsequently reported that new business premium for the quarter stood at ₹8,908 Cr, up from ₹7,268 Cr a year earlier, with regular premium increasing 40%. Protection new business premium doubled to ₹1,958 Cr.
Board Appoints Nihar Jambusaria as Independent Director
On September 22, 2026, SBI Life's board approved the appointment of Nihar Niranjan Jambusaria as an Additional Independent Director for a three-year term.
The appointment followed a recommendation from the Board Nomination and Remuneration Committee. Jambusaria's term commenced on September 22, 2026.
The appointment is primarily a governance development rather than a direct earnings catalyst. However, board composition remains relevant for a large listed insurer as the company expands its business and navigates evolving regulatory requirements.
Earlier, on August 19, independent director Narayan K Seshadri completed his second consecutive three-year term and ceased to be an independent director of the company.
GST Order Adds a Near-Term Regulatory Monitorable
On September 25, 2026, SBI Life disclosed that it had received an order under Section 74 of the Rajasthan GST Act from the Deputy Commissioner, Circle M.I. Road, Jaipur.
The company stated that it would file an appeal before the competent authority or appellate tribunal under the applicable GST legislation.
The development is not currently a change to the company's underlying insurance growth profile, but investors should monitor the eventual outcome of the appeal and any financial liability arising from the matter.
Proposed Insurance Reforms Could Affect Distribution Economics
Another important development for SBI Life came from proposed regulatory changes covering insurance distribution. On September 24, reports highlighted proposed IRDAI reforms involving measures such as restrictions on dark patterns, lower Expense of Management limits and greater transparency around commissions.
For life insurers, distribution costs are important because the industry relies heavily on agents, bancassurance and other intermediary channels to acquire customers.
SBI Life benefits from its relationship with State Bank of India and its broader distribution network. Any changes to commission structures or expense limits could therefore influence the economics of customer acquisition.
The immediate impact remains uncertain because the proposals are still part of the regulatory process. However, investors should track the final rules rather than assume that current distribution economics will remain unchanged.
SBI Life Q1 FY27 Results Show Strong Premium Momentum
SBI Life reported Gross Premium Income of ₹21,289.65 Cr in Q1 FY27, up 19.51% YoY from ₹17,813.89 Cr. First-year premium increased 39.99% YoY to ₹4,954.93 Cr, while renewal premium rose 17.40% to ₹12,381.79 Cr.
PAT increased 21.97% YoY to ₹724.93 Cr, although it declined 9.91% QoQ from ₹804.64 Cr. AUM increased 10.01% YoY to ₹5,26,046.07 Cr, while the solvency ratio stood at 1.96x.
|
Metric |
Q1 FY27 |
Q4 FY26 |
QoQ % |
Q1 FY26 |
YoY % |
|---|---|---|---|---|---|
|
Gross Premium Income (₹ Cr) |
21,289.65 |
27,938.85 |
-23.80% |
17,813.89 |
19.51% |
|
First Year Premium (₹ Cr) |
4,954.93 |
5,092.71 |
-2.71% |
3,539.47 |
39.99% |
|
Renewal Premium (₹ Cr) |
12,381.79 |
16,713.96 |
-25.92% |
10,546.28 |
17.40% |
|
Single Premium (₹ Cr) |
3,952.93 |
6,132.18 |
-35.54% |
3,728.14 |
6.03% |
|
PAT (₹ Cr) |
724.93 |
804.64 |
-9.91% |
594.37 |
21.97% |
|
Solvency Ratio (x) |
1.96 |
1.90 |
+6 bps |
1.96 |
0 bps |
|
Total AUM (₹ Cr) |
5,26,046.07 |
4,92,053.37 |
+6.91% |
4,78,181.50 |
+10.01% |
Source: SBI Life Insurance Company Q1 FY27 Financial Results.
The numbers indicate that the business entered FY27 with healthy premium momentum, particularly in first-year and protection products. The 10% AUM growth also provides a relatively stable base for future fee and investment-related income.
READ THIS ALSO: Navin Fluorine Q2 FY27 Results on October 30; Key Projects in Focus
SBI Life Insurance Share Price Today
SBI Life Insurance share price stood at ₹1,731.00, down ₹11.00 or 0.63% on September 28, 2026. The stock has delivered -15.15% returns year-to-date and -3.76% over the one-year period.
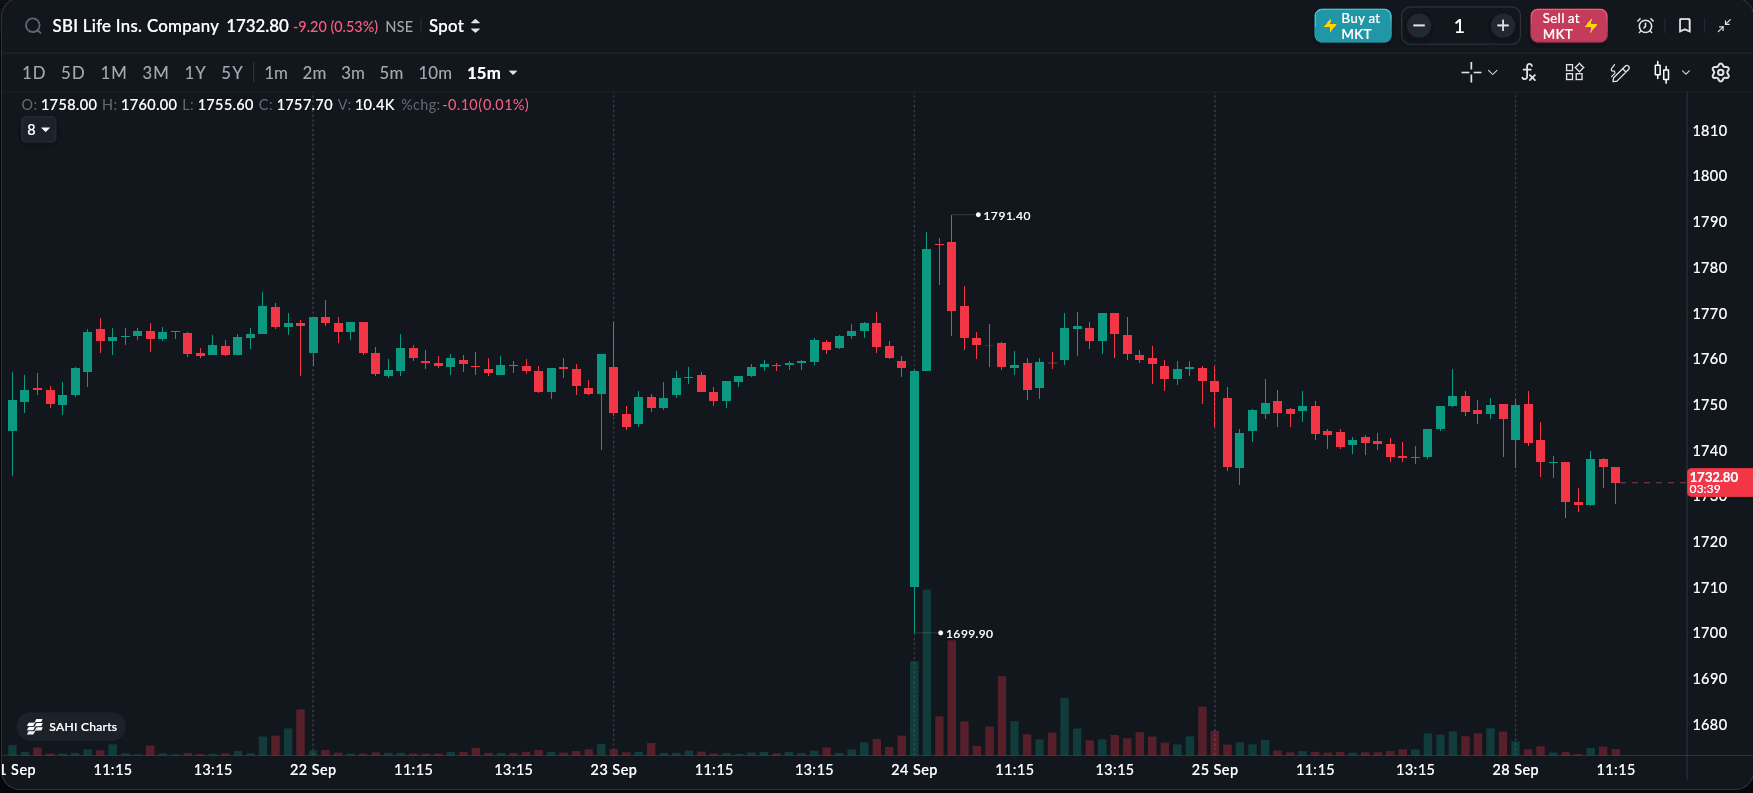
As of 28 September 2026, 11:20 AM
What Investors Should Watch Next
SBI Life's fundamental growth remains healthy, but the investment case now has two competing forces.
On one side, first-year premium, protection business, AUM and PAT are growing at healthy rates. The August industry data also suggests that demand for life insurance remains strong.
On the other hand, regulatory changes could alter distribution costs and commission structures, while the Rajasthan GST order remains an additional legal and financial monitorable.
For investors, the key indicators are regular-premium and protection growth, value of new business, margins, distribution expenses and the final shape of the proposed IRDAI reforms. If SBI Life can maintain strong individual-premium growth without a material deterioration in acquisition economics, the recent weakness in the stock would be easier to justify as a valuation and sector-regulation issue rather than a deterioration in the underlying business.
All topics
Click the link, confirm the box next to sahi.com is checked — ignore any other results.