
LG Electronics India Enters Chest Freezer Market, Q1 FY27 Profit Jumps 27%
LG Electronics India faces an OLED component tariff probe while strong Q1 growth, premium products and the ₹5,000 crore Sri City plant keep the stock in focus.

LG Electronics India faces a government probe over OLED television component imports, while expanding premium products and advancing its ₹5,000 Cr Sri City plant. Investors are weighing regulatory risks against domestic growth opportunities.
LG Electronics India share price is in focus after the company faced a government investigation over the classification of imported OLED TV components. The company is also expanding its product portfolio and strengthening its premiumisation strategy as it enters the festive season.
LG Electronics India shares were trading at ₹1,677.30 on September 24, 2026, down ₹16.90 or 1.00% on the day. The stock has delivered a 12.88% return year-to-date, while its one-year return stood flat.
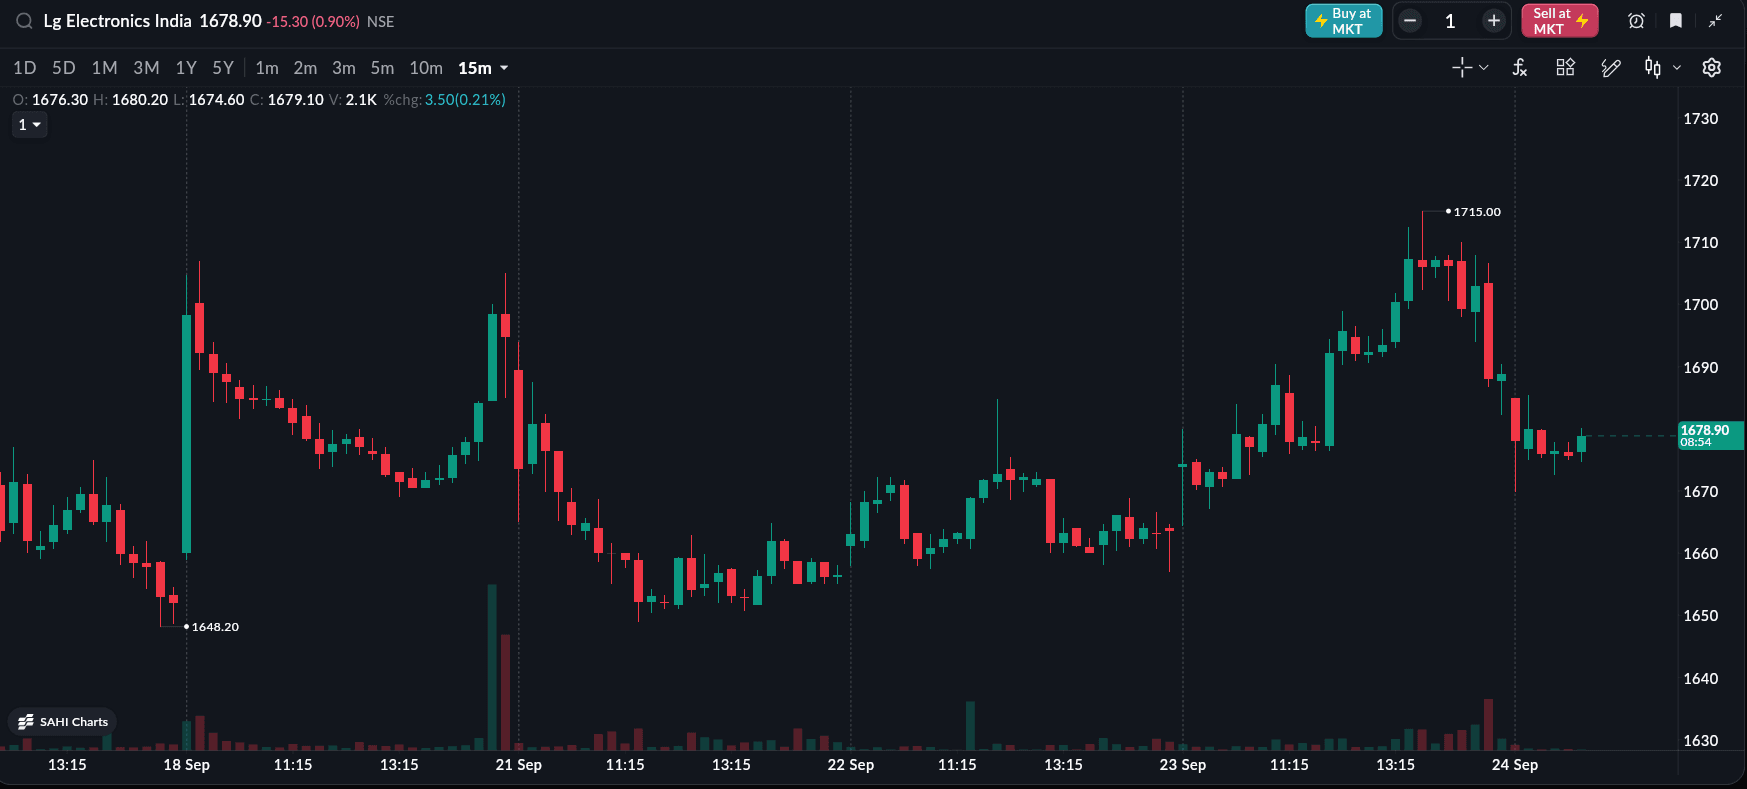
Data as of 24th Sep 26, 10:05 AM
Latest Updates on LG Electronics India Share Price
As an investor, you need to understand the latest updates on LG Electronics. Here are some key developments to know:
1. LG Enters India’s Commercial Chest Freezer Market
LG has also continued to expand its product portfolio. The company recently entered India's chest freezer segment with six Convertible Chest Freezer models aimed at retail, hotels, restaurants, cafes, dairy, pharmaceutical and food-storage businesses. The move broadens LG's refrigeration portfolio beyond its traditional consumer categories.
2. Company Launches 15 New Semi-Automatic Washing Machines
The company has also launched 15 new semi-automatic washing machine models, with capacities ranging from 8 kg to 12 kg. The new range is part of LG's effort to widen its washing-machine portfolio and address different consumer segments.
3. LG Focuses on Premium Products and E-Commerce
Another major focus is premiumisation. LG Electronics India has been increasing its exposure to higher-value products while trying to manage rising input costs. The company has also been expanding its e-commerce presence, with online channels accounting for around 15% of sales, according to Financial Express.
4. ₹5,000 Cr Sri City Manufacturing Facility
LG is simultaneously progressing with its ₹5,000 Cr manufacturing facility at Sri City, Andhra Pradesh, with air-conditioner production expected to begin by December 2026. The facility is expected to strengthen the company's domestic manufacturing capabilities and support its longer-term growth strategy.
READ THIS ALSO: UltraTech Enters Wires & Cables With ₹1,800 Cr Ultravolt Investment
How was LG Electronics India’s Q1 FY27 Results?
LG Electronics India reported strong financial performance for the quarter ended June 30, 2026. Revenue from operations increased 15.49% YoY to ₹7,233.35 Cr, compared with ₹6,262.93 Cr in Q1 FY26.
PAT increased 27.20% YoY to ₹652.87 Cr from ₹513.25 Cr, while EBITDA rose 26.25% YoY to ₹904.27 Cr.
The stronger profit growth was accompanied by an improvement in operating margins. EBITDA margin increased to 12.50% from 11.40%, while PAT margin improved to 9.00% from 8.20%.
|
Metric |
Q1 FY27 |
Q4 FY26 |
QoQ % |
Q1 FY26 |
YoY % |
|---|---|---|---|---|---|
|
Revenue from Operations (₹ Cr) |
7,233.35 |
8,053.55 |
-10.20% |
6,262.93 |
15.50% |
|
Total Revenue (₹ Cr) |
7,328.08 |
8,154.61 |
-10.10% |
6,337.35 |
15.60% |
|
EBITDA (₹ Cr) |
904.27 |
945.35 |
-4.30% |
716.27 |
26.20% |
|
EBITDA Margin |
12.50% |
11.70% |
+0.80 ppt |
11.40% |
+1.10 ppt |
|
PAT (₹ Cr) |
652.87 |
692.73 |
-5.80% |
513.25 |
27.20% |
|
PAT Margin |
9.00% |
8.60% |
+0.40 ppt |
8.20% |
+0.80 ppt |
|
EPS (₹) |
9.62 |
10.21 |
-5.80% |
7.56 |
27.20% |
LG Electronics India Q1 FY27 Segment Performance
Home Appliances and Air Solution division remained the largest contributor, generating ₹5,576.69 Cr of revenue, up 13.62% YoY. Home Entertainment revenue grew faster at 22.29% YoY to ₹1,656.65 Cr.
|
Segment (₹ Cr) |
Q1 FY27 |
Q4 FY26 |
QoQ % |
Q1 FY26 |
YoY % |
|---|---|---|---|---|---|
|
Home Appliances and Air Solution |
5,576.69 |
6,516.28 |
-14.42% |
4,908.23 |
13.62% |
|
Home Entertainment |
1,656.65 |
1,537.26 |
7.77% |
1,354.70 |
22.29% |
|
Total Revenue from Operations |
7,233.35 |
8,053.55 |
-10.18% |
6,262.93 |
15.49% |
What Should Investors Watch Going Forward?
LG Electronics India's immediate focus will be on maintaining premium-product growth while managing higher input costs. The company is also entering the festive period with a broader product portfolio and greater emphasis on financing-led consumer offers rather than broad-based discounts.
The Sri City manufacturing facility will be another important medium-term development, particularly as production is expected to begin by December 2026. Meanwhile, the latest tariff investigation could remain an important near-term risk for the company's premium television business.
Final Takeaway
LG Electronics India enters the next phase with strong Q1 FY27 financial momentum, expanding its premium product portfolio and adding new categories such as commercial chest freezers. However, investors will need to monitor input costs, the upcoming Sri City facility and the ongoing tariff investigation. The combination of 27.2% PAT growth, expanding margins and continued product expansion remains positive, but the latest regulatory development adds a new risk factor for the stock.
All topics
Click the link, confirm the box next to sahi.com is checked — ignore any other results.