
INDO-MIM Faces Exchange Clarification After Sharp Rally; Q1 FY27 Profit Jumps 32%
INDO-MIM remains in focus after an exchange sought clarification on its sharp stock-price movement, while strong Q1 FY27 profit growth and post-listing developments add to investor attention.

INDO-MIM remained in focus after exchanges sought clarification over its recent price movement, while the company completed its 30th AGM and continued investor engagement ahead of its next quarterly results.
INDO-MIM has remained under close market attention in September after a sharp rise in its share price since listing. The latest development came on September 23, when the exchange sought clarification from the company regarding the significant movement in its stock price.
The development comes alongside the company's 30th Annual General Meeting, analyst and investor meetings, and the closure of its trading window ahead of the September-quarter results. These developments follow a strong Q1 FY27 performance, in which revenue increased 9.4% YoY and PAT rose 31.6%.
Exchange Seeks Clarification on INDO-MIM Price Movement
On September 23, 2026, the exchange sought clarification from INDO-MIM regarding the significant movement in its share price. The company was asked to provide the relevant information so that investors have the latest available information and their interests remain protected. The company's response was awaited at the time of the disclosure.
The development followed a sharp rise in the stock during its first months of listing. INDO-MIM shares were listed on July 30, 2026, after the company's IPO was priced at ₹485 per share.
The stock subsequently moved significantly higher, making the exchange clarification an important development for investors assessing the company's post-listing performance.
On September 24, a further exchange disclosure was made under the heading "Clarification On Price Movement." This followed the exchange's September 23 request.
INDO-MIM Completes 30th Annual General Meeting
INDO-MIM held its 30th Annual General Meeting on September 22, 2026. The company subsequently submitted the proceedings and voting results to the exchanges.
The scrutiniser's report was filed on September 23, confirming the completion of the shareholder-meeting process. The company had earlier issued the AGM notice and annual report at the end of August.
The AGM followed the company's transition to the listed-market environment after its July 2026 listing. For investors, the meeting provides additional visibility into shareholder approvals and the company's post-IPO corporate-governance framework.
INDO-MIM also disclosed an analyst and institutional investor meeting schedule on September 3. Such meetings are relevant for a newly listed company as investors assess its growth plans, business outlook and use of the capital raised through the IPO.
Trading Window Closed Ahead of September-Quarter Results
INDO-MIM announced the closure of its trading window with effect from September 16, 2026 for the quarter ending September 30.
The window will remain closed until 48 hours after the declaration of the quarterly results. This puts the company's next earnings announcement on the radar as investors assess whether the strong Q1 operating performance can continue into the second quarter.
The timing is particularly relevant because INDO-MIM delivered significant sequential improvement in profitability during Q1 FY27. The September-quarter numbers will therefore provide the first indication of whether the Q1 margin expansion was sustainable.
Q1 FY27 Results Show Strong Profit Growth
INDO-MIM reported its Q1 FY27 results on August 17, 2026, for the quarter ended June 30. Consolidated revenue from operations increased 9.4% YoY to ₹1,218.74 Cr, compared with ₹1,114.09 Cr in Q1 FY26.
Total income increased to ₹1,221.94 Cr from ₹1,127.16 Cr a year earlier. EBITDA rose 24.4% YoY to ₹406.51 Cr, while EBITDA margin expanded to 33.4% from 29.3%.
PAT increased 31.6% YoY to ₹240.12 Cr from ₹182.41 Cr. Sequentially, PAT increased 72.6% from ₹139.14 Cr in Q4 FY26.
|
Metric |
Q1 FY27 |
Q4 FY26 |
QoQ % |
Q1 FY26 |
YoY % |
|---|---|---|---|---|---|
|
Revenue from Operations (₹ Cr) |
1,218.74 |
1,047.83 |
16.3% |
1,114.09 |
9.4% |
|
Total Revenue (₹ Cr) |
1,221.94 |
1,118.13 |
9.3% |
1,127.16 |
8.4% |
|
EBITDA (₹ Cr) |
406.51 |
200.52 |
102.7% |
326.70 |
24.4% |
|
EBITDA Margin |
33.4% |
19.1% |
+14.2 ppt |
29.3% |
+4.0 ppt |
|
PAT (₹ Cr) |
240.12 |
139.14 |
72.6% |
182.41 |
31.6% |
|
PAT Margin |
19.7% |
13.3% |
+6.4 ppt |
16.4% |
+3.3 ppt |
|
EPS (₹) |
4.96 |
2.88 |
72.2% |
3.78 |
31.2% |
Source: NSE filing, INDO-MIM Q1 FY27 Consolidated Financial Results.
INDO-MIM Declares ₹6.80 Per Share in Interim Dividends
INDO-MIM declared total interim dividends of ₹6.80 per equity share during Q1 FY27. This comprised a first interim dividend of ₹3.50 per share and a second interim dividend of ₹3.30 per share.
The dividend announcement adds another element to the company's post-listing shareholder-return profile. Investors will now assess whether the company's cash generation and earnings growth can support continued capital allocation alongside its expansion plans.
READ THIS: Hindustan Unilever Raises Capex to 3% as New Growth Strategy Takes Shape
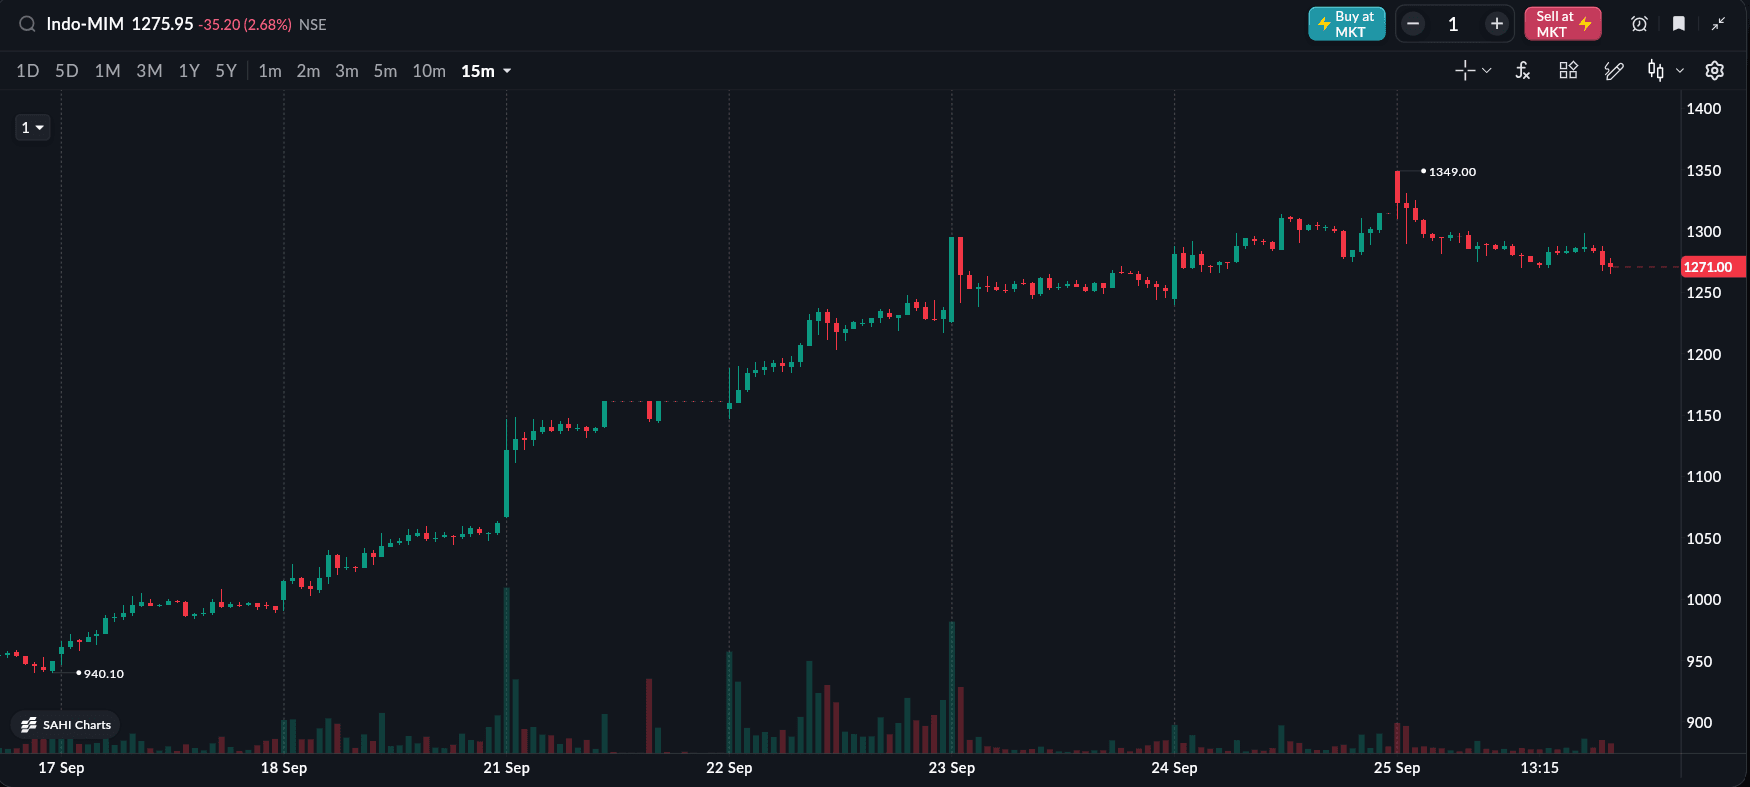
INDO-MIM Share Price Today
INDO-MIM share price is ₹1,271.00, down 3.06% as of September 25, 2026, 3:30 PM. The stock has gained 71.35% year to date.
What Investors Should Watch Next
The immediate focus is the company's response to the exchange's clarification request and the stock's behaviour following the sharp post-listing gains.
The next major fundamental trigger will be Q2 FY27 results. Investors will need to assess whether the 33.4% Q1 EBITDA margin can be sustained and whether revenue growth accelerates from the 9.4% YoY recorded in the June quarter.
The company's investor meetings will also be important for understanding its growth priorities and the outlook for its precision-engineering components business.
The market will also track insider transactions. NSE disclosures show that designated persons sold shares in August, although such transactions should be assessed separately from the broader company's operating performance.
Final Takeaway
INDO-MIM has entered a closely watched phase after its July listing and sharp share-price appreciation. The September exchange clarification, completed AGM and investor interactions have added new corporate developments around the stock.
Q1 FY27 provides a strong operating base, with PAT rising 31.6% and EBITDA margin expanding to 33.4%. However, the next test is whether that profitability can continue as the company moves through FY27. For investors, the exchange clarification, Q2 results, margin sustainability and management's post-listing growth plans are the key developments to monitor.
All topics
Click the link, confirm the box next to sahi.com is checked — ignore any other results.