
Hindustan Unilever Raises Capex to 3% as New Growth Strategy Takes Shape
Hindustan Unilever raises its capex target to around 3% of sales as it focuses on premiumisation, rural demand, quick commerce and new consumer categories.

Hindustan Unilever has raised its planned capex intensity to about 3% of sales and outlined a broader growth strategy focused on premiumisation, new categories, rural demand and quick commerce.
Hindustan Unilever has entered the second half of FY27 with a sharper focus on growth after outlining a new medium-term strategy in September. The company plans to increase capital expenditure, expand premium brands and enter additional high-growth categories as competition and changing consumer behaviour reshape the FMCG market.
At its Capital Markets Day on September 4, 2026, HUL outlined its “Winning in New India” strategy. The company plans to raise capex to around 3% of turnover from about 2% over the previous five years, while maintaining a focus on volume-led growth, premiumisation and stronger execution.
HUL Raises Capex and Expands Growth Priorities
HUL plans to increase capital expenditure to approximately 3% of turnover over the next five years, compared with around 2% in the previous five years. Based on FY26 turnover of ₹63,763 Cr, the company indicated that this would imply an illustrative increase in annual capex from around ₹1,275 Cr to approximately ₹1,913 Cr.
More than 75% of future capex is expected to be directed towards growth and savings initiatives. The company is also targeting significant cost savings through better product mix, operating leverage and technology-led efficiency.
HUL has widened its medium-term EBITDA margin framework to 22%-24%, compared with the earlier 22.5%-23.5% range. The company reported an EBITDA margin of 23.6% in FY26.
Premiumisation and New Categories Become Key Growth Drivers
HUL's new strategy is built around three broad growth pools: consumption and premiumisation, market development and new categories.
The company sees significant headroom in India's FMCG market, particularly as consumers shift towards higher-value products and formats. Home Care remains a major opportunity, with premium detergents and liquid formats offering scope for higher realisation.
HUL is also looking beyond its traditional categories. The company is evaluating opportunities in areas such as male grooming, masstige skincare, fragrances, healthy snacking, protein, hydration and ready-to-drink products. Bolt-on acquisitions and extensions of existing brands are also part of the longer-term portfolio strategy.
Rural consumption is another focus area. HUL estimates that consumption opportunities in rural markets are expanding faster than in urban markets, creating scope for additional distribution and category penetration.
HUL Steps Up Brand Initiatives Across Key Consumer Categories
HUL's September developments have extended beyond its Capital Markets Day.
On September 22, the company highlighted its work around skin-barrier care through a Vaseline initiative. On September 17, HUL also published an update around Vaseline and its brand positioning.
On September 10, HUL disclosed that the Delhi High Court had restrained Beco from continuing an advertising campaign involving Surf Excel and Vim. The development relates to competitive advertising around two of HUL's established home-care brands.
Earlier in September, HUL also highlighted regenerative agriculture initiatives within its tea supply chain. These developments are smaller than the company's Capital Markets Day strategy, but they reflect continued investment across brands, categories and the broader operating platform.
Q1 FY27 Results Show Revenue Growth but Profitability Remains a Focus
HUL reported its Q1 FY27 results on July 27, 2026, with revenue from operations increasing 10.05% YoY to ₹17,341 Cr.
Total revenue increased 9.84% YoY to ₹17,529 Cr, while EBITDA rose 8.43% to ₹3,947 Cr. However, EBITDA margin declined to 22.76% from 23.10% a year earlier.
Reported PAT stood at ₹2,680 Cr. The year-on-year comparison was affected by the exceptional tax benefit in the corresponding period, while PAT before exceptional items increased during the quarter. HUL's underlying sales growth reached 10%, with underlying volume growth at 5%.
|
Metric |
Q1 FY27 |
Q4 FY26 |
QoQ % |
Q1 FY26 |
YoY % |
|---|---|---|---|---|---|
|
Revenue from Operations (₹ Cr) |
17,341 |
16,351 |
6.05% |
15,757 |
10.05% |
|
Total Revenue (₹ Cr) |
17,529 |
16,615 |
5.50% |
15,958 |
9.84% |
|
EBITDA (₹ Cr) |
3,947 |
3,841 |
2.76% |
3,640 |
8.43% |
|
EBITDA Margin |
22.76% |
23.49% |
-0.73 ppt |
23.10% |
-0.34 ppt |
|
PAT (₹ Cr) |
2,680 |
2,994 |
-10.49% |
2,768 |
-3.18% |
|
PAT Margin |
15.45% |
18.31% |
-2.86 ppt |
17.57% |
-2.11 ppt |
|
EPS (₹) |
4.66 |
4.85 |
-3.92% |
3.31 |
40.79% |
Source: Hindustan Unilever Q1 FY27 Financial Results.
Home Care Remains the Largest Business
Home Care remained HUL's largest operating segment in Q1 FY27, generating revenue of ₹6,554 Cr, up 13.45% YoY.
Beauty & Wellbeing revenue increased 12.45%, while Personal Care grew 3.31%. Foods revenue increased 6.78%, and the Others segment rose 9.09%.
|
Particulars (₹ Cr) |
Q1 FY27 |
Q4 FY26 |
QoQ % |
Q1 FY26 |
YoY % |
|---|---|---|---|---|---|
|
Home Care |
6,554 |
6,344 |
3.31% |
5,777 |
13.45% |
|
Beauty & Wellbeing |
4,083 |
3,697 |
10.44% |
3,631 |
12.45% |
|
Personal Care |
2,624 |
2,229 |
17.72% |
2,540 |
3.31% |
|
Foods |
3,480 |
3,566 |
-2.41% |
3,259 |
6.78% |
|
Others |
600 |
515 |
16.50% |
550 |
9.09% |
|
Revenue from Operations |
17,341 |
16,351 |
6.05% |
15,757 |
10.05% |
Source: Hindustan Unilever Q1 FY27 Segment Information.
READ THIS ALSO: Havells India Gets AAA Rating Reaffirmation as Q2 FY27 Results Near
Hindustan Unilever Share Price Today
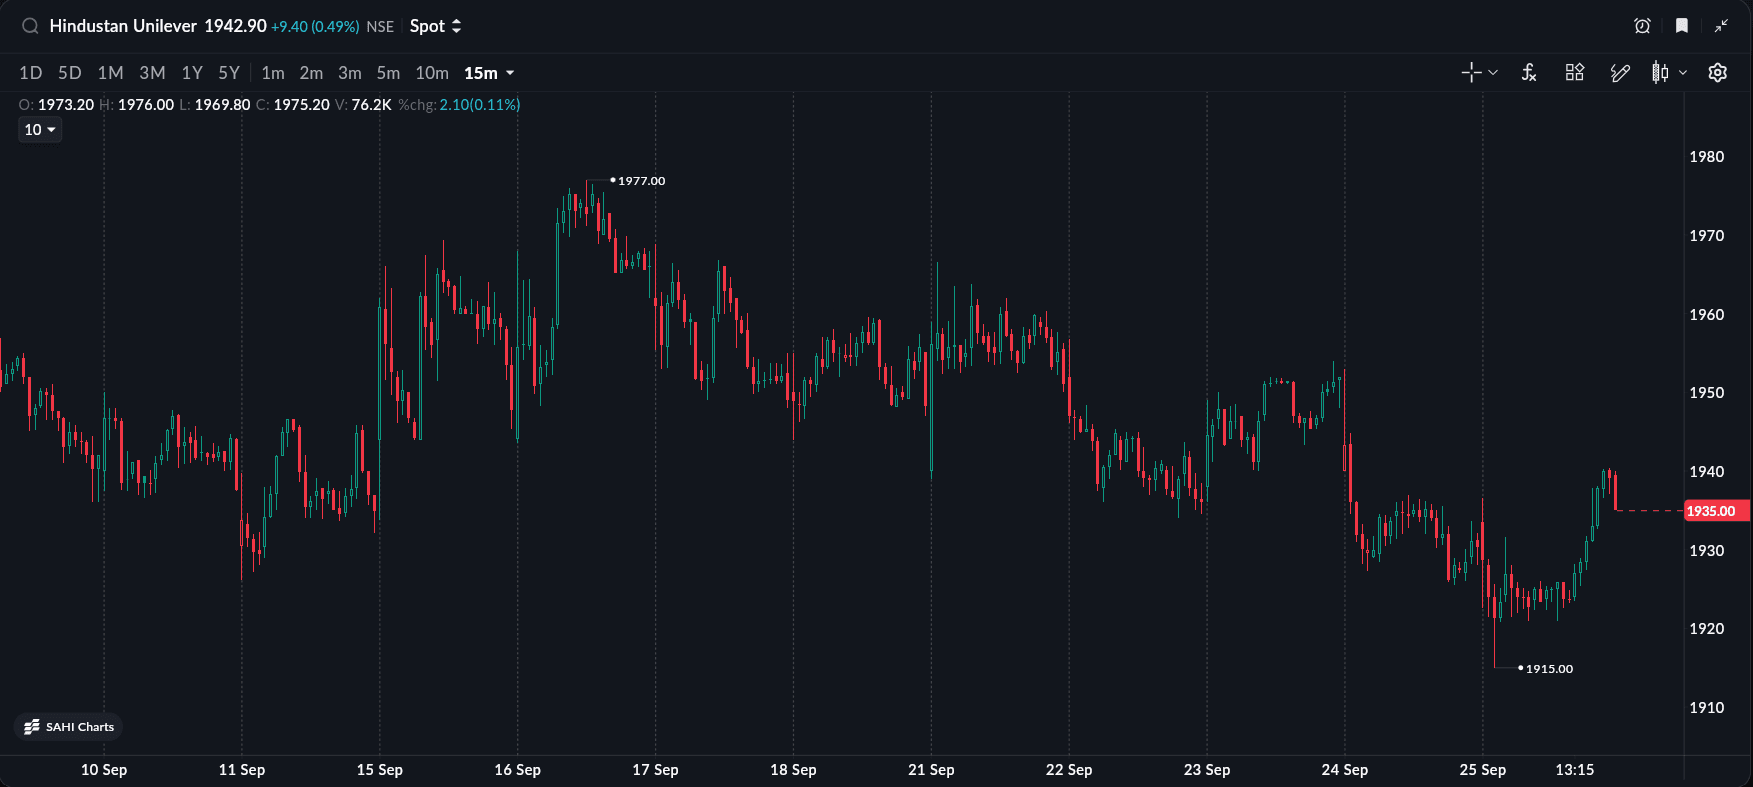
Hindustan Unilever share price is ₹1,942.90, up 0.49% as of September 25, 2026, 3:30 PM. The stock is down 16.36% year to date and has declined 23.46% over the past one year.
What Investors Should Watch Next
Investors will first watch whether the company's 10% underlying sales growth in Q1 can continue and translate into stronger volumes. Margin performance will be equally important as HUL increases investment.
The planned increase in capex also needs to generate sufficient returns. The company is targeting growth through premiumisation, rural expansion, quick commerce and new categories, but these initiatives will require higher upfront spending.
Final Takeaway
Hindustan Unilever's September strategy marks a shift towards higher investment and broader growth opportunities. The company plans to raise capex to around 3% of sales, expand premiumisation, enter new categories and strengthen its presence in rural markets and quick commerce.
Q1 FY27 already showed a stronger underlying sales trajectory, but profitability remains the key issue. With the stock down more than 16% year to date, the market now needs evidence that higher investment can produce sustained volume growth and eventually improve earnings.
All topics
Click the link, confirm the box next to sahi.com is checked — ignore any other results.