
Havells India Gets AAA Rating Reaffirmation as Q2 FY27 Results Near
Havells India enters the Q2 FY27 earnings cycle with CARE’s AAA rating reaffirmed, while investors track margin recovery, cables growth and consumer demand.

Havells India remains in focus after CARE reaffirmed its AAA and A1+ ratings on September 25, while investors assess margin pressure from Q1 and the outlook for demand, cables and consumer businesses.
Havells India has entered the second quarter of FY27 with investors focused on two competing signals: strong revenue growth but weaker profitability. Recent September disclosures have added to the company's focus ahead of the Q2 FY27 results.
On September 25, 2026, CARE reaffirmed Havells India's AAA rating for its long-term facilities and A1+ rating for its short-term facilities. The company has also disclosed several other recent developments, including investor interactions and the upcoming closure of its trading window.
CARE Reaffirms Havells India’s AAA and A1+ Ratings
On September 25, 2026, CARE reaffirmed Havells India's AAA rating for its long-term facilities and A1+ rating for its short-term facilities. The reaffirmation supports the company's credit profile as it continues to operate across cables, consumer electrical products and other businesses.
On September 23, Havells announced the closure of its trading window from October 1, 2026, until 48 hours after the board meeting that will consider the financial results for the quarter and half-year ending September 30, 2026.
Earlier, on September 15, Havells informed the exchanges about its participation in the J.P. Morgan India Conference, scheduled for September 21. Such investor interactions can provide additional visibility into demand conditions, margins and business priorities.
On September 1, CARE Analytics assigned Havells its highest corporate governance rating, CG 1, valid for one year. On August 31, shareholders also approved postal-ballot resolutions concerning the appointment of Ashish Dhawan and Shanti Ekambaram.
Q1 FY27 Revenue Growth Came With Margin Pressure
Havells India reported its Q1 FY27 results on July 17, 2026, with total income rising 18.97% YoY to ₹6,572.35 Cr. However, the increase in revenue did not translate into higher operating profit.
EBITDA declined 9.60% YoY to ₹466.16 Cr, while EBITDA margin contracted to 7.15% from 9.45% in Q1 FY26. On a sequential basis, EBITDA fell 37.26%.
PAT declined 16.64% YoY to ₹289.71 Cr from ₹347.53 Cr. Compared with Q4 FY26, PAT fell 59.95%.
|
Metric |
Q1 FY27 |
Q4 FY26 |
QoQ % |
Q1 FY26 |
YoY % |
|---|---|---|---|---|---|
|
Total Income (₹ Cr) |
6,572.35 |
7,001.45 |
-6.13% |
5,524.53 |
18.97% |
|
EBITDA (₹ Cr) |
466.16 |
743.01 |
-37.26% |
515.67 |
-9.60% |
|
EBITDA Margin |
7.15% |
11.08% |
-393 bps |
9.45% |
-230 bps |
|
Profit After Tax (₹ Cr) |
289.71 |
723.39 |
-59.95% |
347.53 |
-16.64% |
|
PAT Margin |
4.44% |
10.79% |
-635 bps |
6.37% |
-193 bps |
|
EPS (₹) |
4.63 |
11.52 |
-59.81% |
5.55 |
-16.58% |
Source: Havells India Q1 FY27 Consolidated Financial Results.
The Q1 numbers therefore highlighted a clear gap between topline growth and profitability. The key issue for the next quarter is whether Havells can recover margins while maintaining its revenue momentum.
Cables and Renewables Drive Segment Growth
Havells' segment performance remained mixed during Q1 FY27. Cables continued to be the largest contributor, with revenue of ₹2,455.62 Cr, up 27.02% YoY.
Renewables recorded the strongest percentage growth, with revenue rising 235.87% YoY to ₹314.34 Cr. Electrical Consumer Durables increased 11.88%, while Lloyd Consumer revenue grew 14.66%.
However, Switchgears declined 3.52% YoY and Lighting & Fixtures increased only 5.38%.
|
Particulars (₹ Cr) |
Q1 FY27 |
Q4 FY26 |
QoQ % |
Q1 FY26 |
YoY % |
|---|---|---|---|---|---|
|
Switchgears |
607.68 |
735.36 |
-17.36% |
629.83 |
-3.52% |
|
Cables |
2,455.62 |
2,474.13 |
-0.75% |
1,933.22 |
27.02% |
|
Lighting & Fixtures |
400.62 |
448.72 |
-10.72% |
380.15 |
5.38% |
|
Electrical Consumer Durables |
1,113.07 |
1,082.41 |
2.83% |
994.89 |
11.88% |
|
Lloyd Consumer |
1,457.44 |
1,520.50 |
-4.15% |
1,271.11 |
14.66% |
|
Renewables |
314.34 |
259.40 |
21.18% |
93.59 |
235.87% |
|
Others |
169.42 |
184.68 |
-8.26% |
152.56 |
11.05% |
|
Revenue from Operations |
6,518.19 |
6,705.20 |
-2.79% |
5,455.35 |
19.48% |
Source: Havells India Q1 FY27 Segment Information.
The segment mix shows that cables remain central to Havells' growth, while Renewables is expanding rapidly from a smaller base. The performance of Lloyd and Electrical Consumer Durables will also remain important for assessing consumer demand.
RADE THIS: Solar Industries Expands Global Mining Footprint with ₹12,951 Cr Omnia Acquisition
Havells India Share Price Today
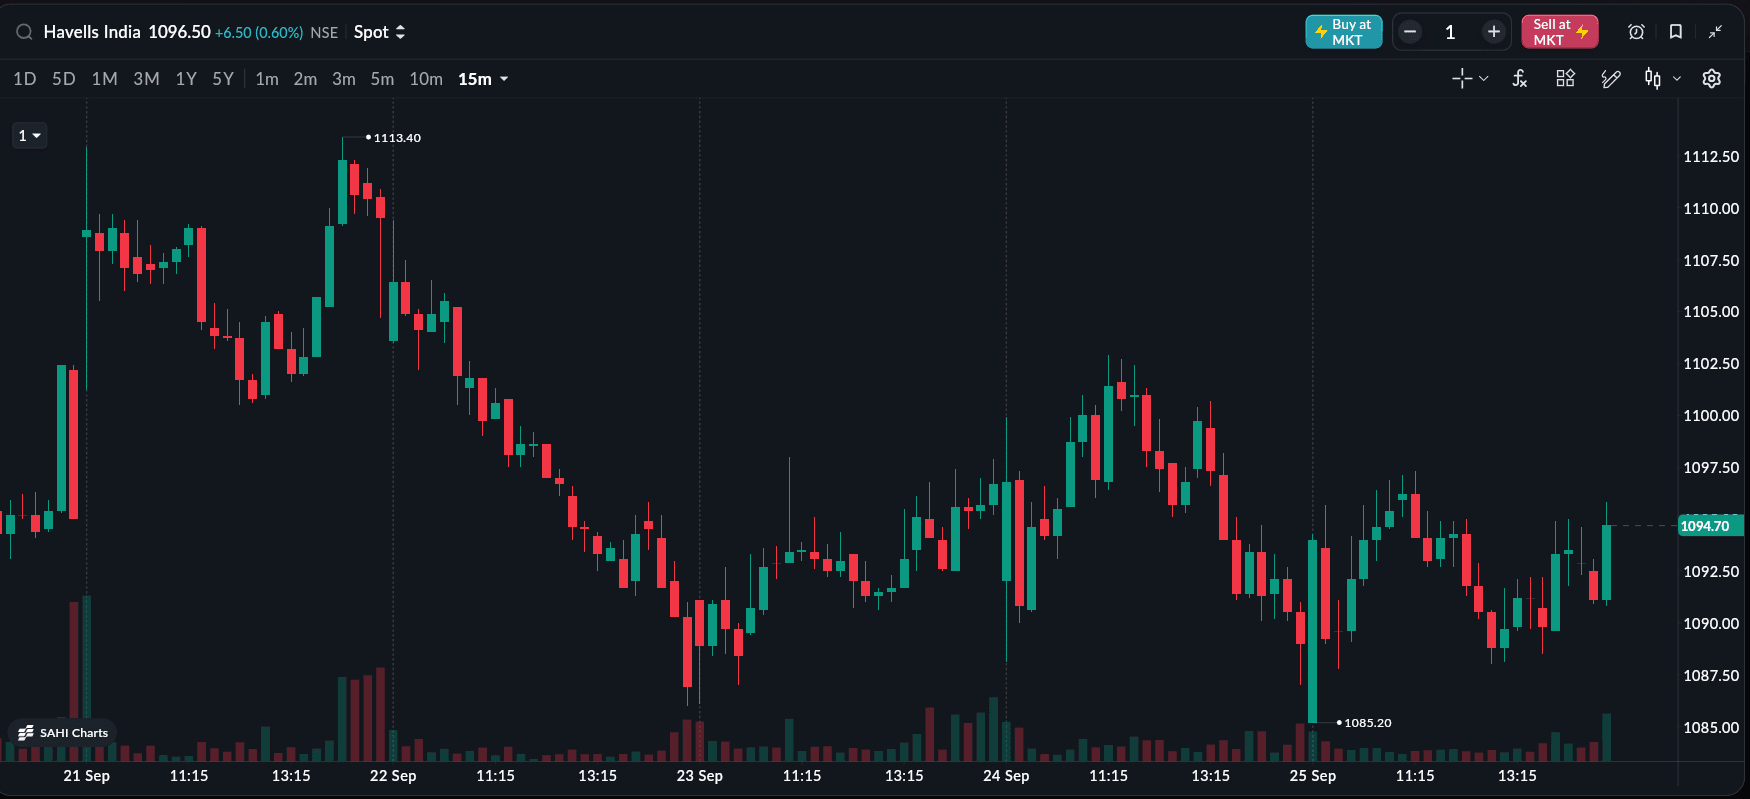
Havells India share price is ₹1,096.50, up 0.60% as of September 25, 2026, 3:30 PM. The stock is down 22.65% year to date and has declined 28.78% over the past one year.
What Investors Should Watch Next
The immediate focus is on Q2 FY27 earnings, with the trading window scheduled to close from October 1. Investors will look for evidence that the Q1 margin pressure has eased.
Cables will remain a key growth driver, while the market will assess whether Renewables can sustain its rapid expansion. Lloyd Consumer and Electrical Consumer Durables will also provide an indication of demand across Havells' consumer-facing businesses.
The September rating reaffirmation is supportive for the company's credit profile, but it does not resolve the earnings issue. Investors still need to see stronger operating profitability.
Final Takeaway
Havells India enters the Q2 FY27 earnings cycle with strong revenue growth but weaker profitability. CARE's September rating reaffirmation and the company's recent investor and governance developments provide a positive backdrop, while the Q1 results highlight the need for margin recovery. For investors, Q2 EBITDA margin, Cables growth, Renewables expansion and consumer demand will be the key factors to watch.
All topics
Click the link, confirm the box next to sahi.com is checked — ignore any other results.