
Go Digit Q1 FY27 Profit Falls 38%; Amalgamation Scheme Moves Ahead
Go Digit updates its proposed amalgamation scheme after an IRDAI advisory as CCI and NCLT milestones move the corporate restructuring process forward.

Go Digit General Insurance’s proposed amalgamation moved ahead in September, with the company updating its scheme after an IRDAI advisory. The development follows CCI approval and NCLT’s first-motion order, while Q1 FY27 results showed premium growth but weaker profitability.
Go Digit General Insurance is progressing with its proposed amalgamation with Go Digit Infoworks Services Private Limited. The corporate action has moved through several regulatory stages since July, with fresh disclosures in September providing more clarity on the process.
Go Digit Updates Amalgamation Scheme After IRDAI Advisory
On 23 September 2026, Go Digit disclosed an update to its proposed Scheme of Amalgamation with Go Digit Infoworks Services. The company said IRDAI, through an email dated 4 September 2026, advised it to prepare and submit the scheme under Section 35 of the Insurance Act, 1938.
Go Digit updated the scheme to include references to Section 35 and related rules. The company said the modification was made to comply with the advisory and did not materially change the scheme’s substance or structure.
CCI and NCLT Approvals Move the Corporate Action Forward
The September update follows two important regulatory milestones.
On 1 September 2026, Go Digit disclosed that it had received the detailed Competition Commission of India order dated 31 August 2026 approving the proposed amalgamation. The company had earlier announced CCI approval on 28 July 2026.
The scheme also received an important procedural clearance from NCLT. In an order dated 13 August 2026, uploaded on the NCLT website on the same day, the Mumbai Bench allowed Go Digit’s first-motion application relating to the amalgamation.
NCLT directed Go Digit to convene a meeting of its equity shareholders within 90 days of the order being uploaded. Shareholders will be asked to consider and approve the scheme.
The transaction has therefore progressed materially, but it would be incorrect to describe it as completed. Further regulatory and shareholder approvals remain necessary.
Proposed Amalgamation Aims to Simplify Go Digit’s Structure
Go Digit Infoworks Services is the promoter and holding company of Go Digit General Insurance. The proposed transaction would simplify this structure by amalgamating the holding company into the listed insurer.
The NCLT order records the stated rationale of reducing shareholding tiers, simplifying compliance and administrative requirements, and giving shareholders of the holding company a more direct interest in the insurance business.
Go Digit General Insurance would remain the transferee company. The scheme provides for the issue of shares to eligible shareholders of the transferor company once the transaction becomes effective.
For investors, the immediate significance is structural simplification rather than a change to the insurer’s operating model.
Giridhar Aramane Resigns as Independent Director
Go Digit reported another corporate development on 10 September 2026. Independent Director Giridhar Aramane resigned from the company’s board with effect from the close of business on the same day.
The company said the resignation followed increased responsibilities and time commitments arising from his appointment as Chairman and Managing Director of Unitech Limited. Aramane also confirmed that there were no material reasons other than those stated in his resignation letter.
READ THIS ALSO: Tata Steel Seeks More UK Funding as Port Talbot EAF Project Faces Delays
Q1 FY27 Results Show Premium Growth but Lower Profit
The recent corporate developments need to be assessed alongside Go Digit’s Q1 FY27 performance.
For the quarter ended 30 June 2026, total income increased 8.25% YoY to ₹2,359.36 Cr from ₹2,179.46 Cr. However, PAT declined 37.55% YoY to ₹86.39 Cr from ₹138.33 Cr.
The key pressure came from underwriting performance. The incurred claim ratio increased to 73.30% from 70.30% a year earlier, although it improved from 75.20% in Q4 FY26.
Net premium earned increased 7.61% YoY to ₹2,006.96 Cr. Motor insurance remained the largest contributor at ₹1,510.11 Cr, while Health Group & Corporate premium rose 36.21% YoY to ₹365.79 Cr.
|
Metric |
Q1 FY27 |
Q4 FY26 |
QoQ % |
Q1 FY26 |
YoY % |
|---|---|---|---|---|---|
|
Total Income (₹ Cr) |
2,359.36 |
3,111.71 |
-24.18% |
2,179.46 |
+8.25% |
|
PAT (₹ Cr) |
86.39 |
149.42 |
-42.18% |
138.33 |
-37.55% |
|
PAT Margin |
3.66% |
4.80% |
-114 bps |
6.35% |
-269 bps |
|
Solvency Ratio |
2.43x |
2.42x |
+0.01x |
2.27x |
+0.16x |
|
Incurred Claim Ratio |
73.30% |
75.20% |
-190 bps |
70.30% |
+300 bps |
The solvency ratio improved to 2.43x, providing a strong capital buffer above the regulatory requirement. However, the fall in PAT shows that premium growth has not yet translated into stronger earnings.
Go Digit Share Price Today
Go Digit General Insurance shares were trading at ₹252.55, up ₹2.25 or 0.90% on 25 September 2026.
The stock has delivered -27.23% YTD returns and -28.00% over the past one year.
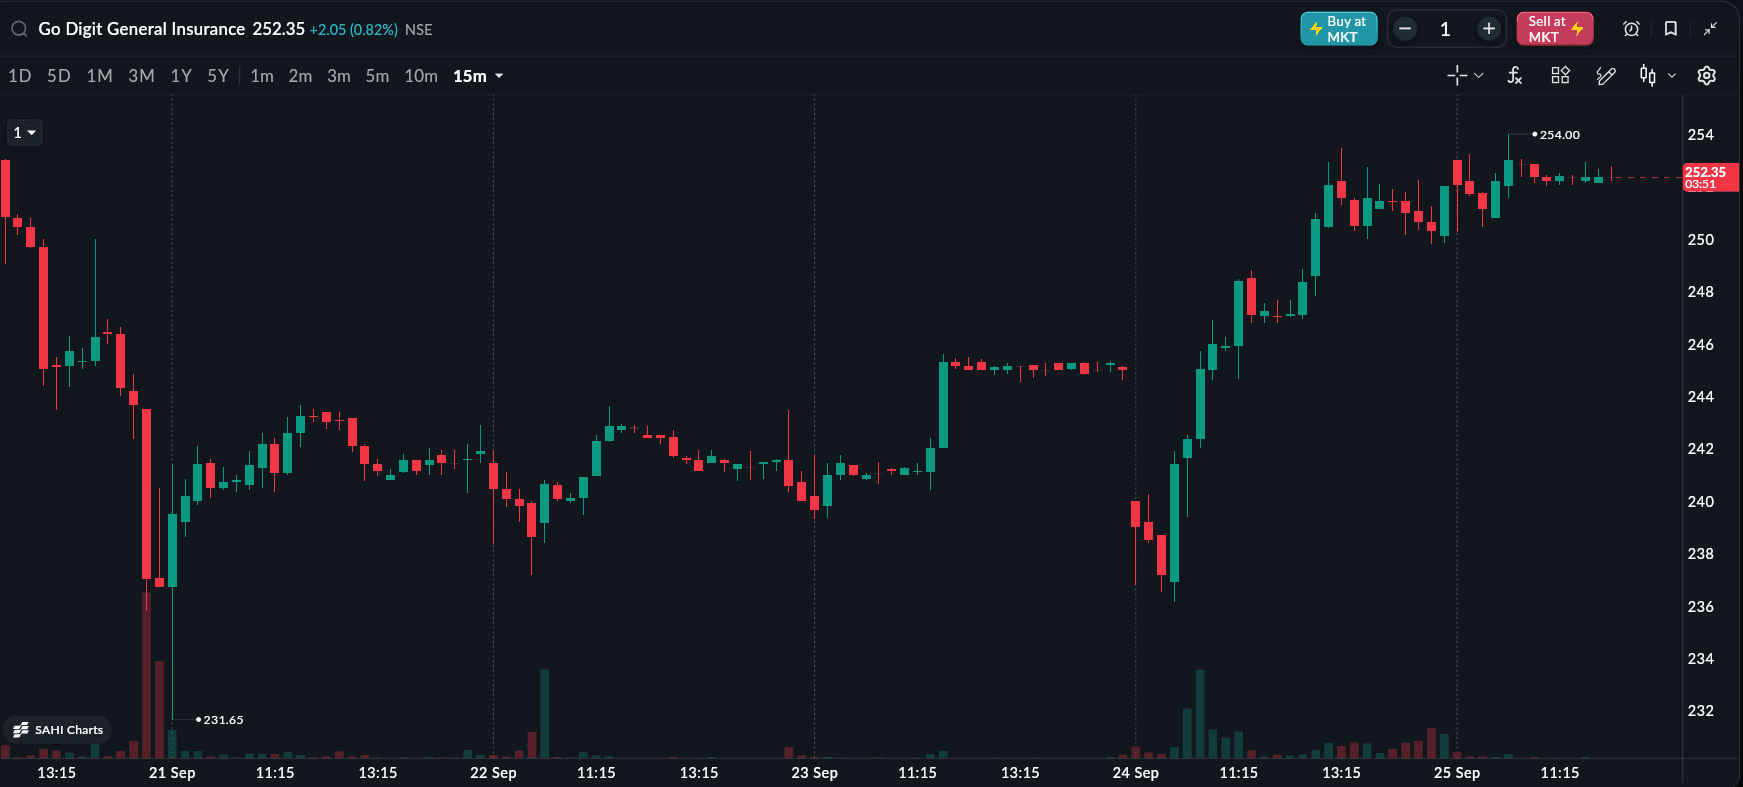
As of 25th Sep 2026, 12:15 PM
What Investors Should Watch Next
The first major factor is the progress of the amalgamation. The 23 September 2026 update confirms that the scheme has been revised following IRDAI’s 4 September advisory. The next milestones are the remaining regulatory process and shareholder approval.
The shareholder meeting is particularly important because the NCLT’s 13 August 2026 order directed the company to convene it within 90 days of the order being uploaded.
Investors should also track claims and underwriting profitability. Q1 FY27 showed a higher year-on-year incurred claim ratio and a sharp fall in PAT despite premium growth. A sustained improvement in claims performance would provide stronger evidence of earnings recovery.
Final Takeaway
Go Digit’s current story is driven by the proposed amalgamation and profitability recovery. September brought meaningful progress, with the scheme updated after IRDAI’s advisory and CCI and NCLT milestones already cleared. However, approvals remain pending, while Q1 FY27 earnings show that underwriting performance still needs improvement.
All topics
Click the link, confirm the box next to sahi.com is checked — ignore any other results.