
Ather Energy Q1 FY27 Results: Loss Narrows 71%; Konarc Launch in Focus
Ather Energy is expanding into the mass-market electric scooter segment with Konarc, while strong Q1 FY27 revenue growth and narrowing losses support its plans to scale production and retail presence.

Ather Energy is expanding into the mass-market electric scooter segment with its new Konarc model, increasing competition with TVS and Bajaj. The company reported strong Q1 FY27 revenue growth and sharply reduced losses, while capacity and retail expansion remain key focus areas.
Ather Energy is expanding beyond its premium electric scooter positioning as it targets a larger share of India’s electric two-wheeler market. The company’s new Konarc scooter, built on its EL platform, starts at ₹99,999, bringing Ather closer to the price range dominated by established players such as TVS Motor and Bajaj Auto.
Ather Energy share price closed at 0.15% higher on 24 Sep. The stock has delivered 103% returns year to date and 158% over the one year from 24 Sep 2025 to 24 Sep 2026.
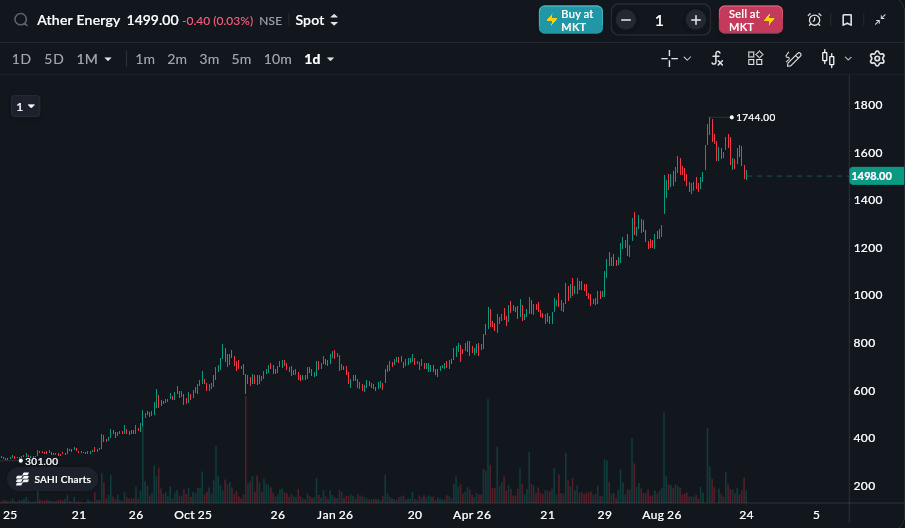
As of 24 Sep, 3:30 PM
Ather Enters the Mass-Market Electric Scooter Segment
Konarc marks a significant change in Ather’s product strategy. The company has traditionally focused on the premium end of the electric scooter market, but the new model is aimed at a wider group of buyers, including customers currently using petrol scooters.
Konarc is available with different battery and range options. The entry-level version offers a 100-km IDC range and is priced at ₹99,999, while higher variants offer ranges of 125 km and 161 km. A 200-km version is planned for Q3 2027.
Konarc Puts Ather Directly Against TVS and Bajaj
Ather’s move into the mass market brings it into more direct competition with established models such as the TVS iQube and Bajaj Chetak. The ₹99,999 starting price of the Konarc is close to the entry prices of these competing electric scooters.
According to media reports, Ather expects the new platform to help it cover around 80-90% of the electric scooter market once the different Konarc variants are available and production ramps up. The company is also using a more conventional scooter design to make the transition from petrol vehicles to EVs easier for mainstream buyers.
Demand is Rising but Production Capacity Remains a Challenge
Ather is also dealing with a supply constraint as it expands its product range. CEO Tarun Mehta said the company was seeing monthly demand of more than 50,000 units, against current supply capacity of around 35,000 units.
The company expects production capacity to increase to around 77,000 units per month after Phase I of its Aurangabad facility becomes operational. However, management expects demand to remain ahead of supply for another three to four quarters.
READ THIS: Vedanta Aluminium in Focus as Exports Rise and Stock Recovers From 52-Week Low
Ather Expands Its Retail Network
Alongside the new product strategy, Ather is expanding its retail footprint. The company currently has around 700-750 outlets and plans to increase this to around 1,800-2,000 stores over the next two years.
The wider network is important as Ather moves into lower price segments, where customers may place greater importance on availability, servicing and after-sales support. The company is also expanding its presence beyond India, with operations already in Sri Lanka and Nepal.
Competition Will Remain a Key Focus
Ather’s expansion into the mass market puts it in a more competitive segment, where TVS, Bajaj, Hero and Ola are already active. The company will need to scale production, expand its retail network and maintain cost efficiency as it targets higher volumes.
The performance of the Konarc, the ramp-up of manufacturing capacity and Ather’s ability to convert petrol scooter buyers into EV customers will be important factors to watch as the company enters its next phase of growth.
Ather Energy Q1 FY27 Results Highlights
-
Revenue from Operations stood at ₹1,216.92 crore, registering an 88.79% YoY increase from ₹644.58 crore. Compared with ₹1,174.66 crore in Q4 FY26, revenue increased 3.60% QoQ.
-
Total Revenue stood at ₹1,259.65 crore, registering an 87.19% YoY increase from ₹672.91 crore. Compared with ₹1,213.77 crore in Q4 FY26, total revenue increased 3.78% QoQ.
-
EBITDA (Excluding Other Income) stood at a loss of ₹33.28 crore, compared with a loss of ₹134.30 crore in Q1 FY26, improving 75.22% YoY. Compared with a loss of ₹69.58 crore in Q4 FY26, EBITDA loss narrowed 52.17% QoQ.
-
EBITDA Margin stood at -2.73%, compared with -20.84% in Q1 FY26 and -5.92% in Q4 FY26, improving by 18.10 percentage points YoY and 3.19 percentage points QoQ.
-
Profit After Tax (PAT) stood at a loss of ₹51.09 crore, compared with a loss of ₹178.23 crore in Q1 FY26, improving 71.33% YoY. Compared with a loss of ₹100.23 crore in Q4 FY26, net loss narrowed 49.03% QoQ.
-
PAT Margin stood at -4.20%, compared with -27.65% in Q1 FY26 and -8.53% in Q4 FY26, improving by 23.45 percentage points YoY and 4.33 percentage points QoQ.
-
EPS stood at -₹1.33, compared with -₹5.23 in Q1 FY26, improving by ₹3.90 YoY (74.57%). Compared with -₹2.62 in Q4 FY26, EPS improved by ₹1.29 QoQ (49.24%).
|
Metric |
Q1 FY27 |
Q4 FY26 |
QoQ % |
Q1 FY26 |
YoY % |
|---|---|---|---|---|---|
|
Revenue from Operations (₹ Cr) |
1,216.92 |
1,174.66 |
3.60% |
644.58 |
88.79% |
|
Total Revenue (₹ Cr) |
1,259.65 |
1,213.77 |
3.78% |
672.91 |
87.19% |
|
EBITDA (Excl. Other Income) (₹ Cr) |
-33.28 |
-69.58 |
52.17% |
-134.30 |
75.22% |
|
EBITDA Margin |
-2.73% |
-5.92% |
+3.19 ppt |
-20.84% |
+18.10 ppt |
|
PAT (₹ Cr) |
-51.09 |
-100.23 |
49.03% |
-178.23 |
71.33% |
|
PAT Margin |
-4.20% |
-8.53% |
+4.33 ppt |
-27.65% |
+23.45 ppt |
|
EPS (₹) |
-1.33 |
-2.62 |
49.24% |
-5.23 |
74.57% |
Source: Company Filing
All topics
Click the link, confirm the box next to sahi.com is checked — ignore any other results.