
Vedanta Aluminium Q1 FY27 Results: PAT Rises 205%; Exports Hit $3.5 Billion
Vedanta Aluminium delivered strong Q1 FY27 growth, while its Jharsuguda SEZ recorded $3.5 billion in exports. The stock has also recovered from its recent 52-week low.

Vedanta Aluminium Q1 Results FY2027: Vedanta Aluminium delivered strong Q1 FY27 results, with revenue rising 46% and PAT increasing 205% YoY. The company also recorded $3.5 billion in FY26 SEZ exports. Meanwhile, its stock has recovered from a recent 52-week low.
Vedanta Aluminium is in focus after its Jharsuguda-based Special Economic Zone (SEZ) emerged as India's second-largest exporter of goods from SEZs in FY26. At the same time, the company's stock has recovered from its recent 52-week low, putting its financial performance, aluminium prices and expansion plans under focus.
Vedanta Aluminium Becomes India’s Second-Largest SEZ Goods Exporter
Vedanta Aluminium's SEZ facility in Jharsuguda, Odisha, recorded exports of around $3.5 billion in FY26. This accounted for about 6% of India's total SEZ goods exports during the year, according to trade data cited by the company.
The company's exports reached customers across more than 60 countries, including US, Europe, Japan and Southeast Asia. Its export portfolio includes aluminium products such as billets, wire rods, rolled products, foundry alloys and ingots. It also exports its low-carbon aluminium range, Restora.
These products are used across sectors such as automobiles, aerospace, electrical equipment, construction and packaging. Demand is also emerging from renewable energy, electric mobility, data centres and AI infrastructure.
Vedanta Aluminium Stock Recovers From 52-Week Low
Vedanta Aluminium shares recently recovered after touching a 52-week low of ₹401.20 on September 16, 2026. On September 24, the stock closed ₹428.
The stock had touched a 52-week high of ₹538 on June 15. It was listed at ₹522 in June following the Vedanta group demerger and, despite the recent recovery, remained around 9% below its demerger level as of September 24.
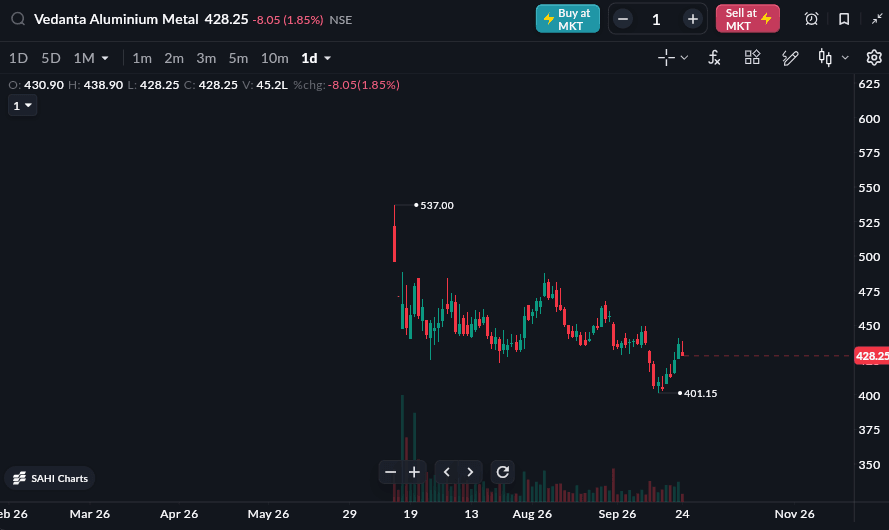
As of 24 Sep 2026
Aluminium Prices and Global Supply Remain Key Factors
Aluminium prices remain an important factor for Vedanta Aluminium's earnings outlook. Analysts say the recent recovery was supported by the company's fundamentals, while also pointing to the importance of LME aluminium prices.
According to the analyst, hedging can limit the benefit of spot price movements, while a potential global aluminium surplus by FY29 could also affect the outlook. This makes global aluminium prices, production levels and demand important factors to track alongside the company's capacity expansion.
READ THIS: ICICI Prudential AMC in Focus After RBI Approval for Bank Stakes
Vedanta Aluminium Q1 FY27 Results Highlights
-
Revenue from Operations stood at ₹21,393 crore, up 45.99% YoY from ₹14,654 crore. Compared with ₹19,124 crore in Q4 FY26, revenue increased 11.86% QoQ.
-
Total Revenue stood at ₹21,702 crore, registering a 46.02% YoY increase from ₹14,862 crore in Q1 FY26. Compared with ₹19,432 crore in Q4 FY26, total revenue increased 11.68% QoQ.
-
EBITDA (Excluding Other Income) stood at ₹10,299 crore, registering a 134.82% YoY increase from ₹4,386 crore. Compared with ₹8,352 crore in Q4 FY26, EBITDA increased 23.31% QoQ.
-
EBITDA Margin stood at 48.14%, compared with 29.93% in Q1 FY26 and 43.67% in Q4 FY26, improving by 18.21 percentage points YoY and 4.47 percentage points QoQ.
-
Profit After Tax (PAT) stood at ₹6,597 crore, compared with ₹2,162 crore in Q1 FY26, registering a 205.13% YoY increase. Compared with ₹4,958 crore in Q4 FY26, PAT increased 33.06% QoQ.
-
PAT attributable to owners stood at ₹5,629 crore, compared with ₹1,781 crore in Q1 FY26, registering a 216.06% YoY increase. Compared with ₹4,207 crore in Q4 FY26, PAT attributable to owners increased 33.80% QoQ.
-
PAT Margin stood at 30.84%, compared with 14.75% in Q1 FY26 and 25.93% in Q4 FY26, improving by 16.08 percentage points YoY and 4.91 percentage points QoQ.
-
EPS stood at ₹14.39, compared with ₹4.55 in Q1 FY26, increasing by ₹9.84 YoY. Compared with ₹10.76 in Q4 FY26, EPS increased by ₹3.63 QoQ.
|
Metric |
Q1 FY27 |
Q4 FY26 |
QoQ % |
Q1 FY26 |
YoY % |
|---|---|---|---|---|---|
|
Revenue from Operations (₹ Cr) |
21,393 |
19,124 |
11.86% |
14,654 |
45.99% |
|
Total Revenue (₹ Cr) |
21,702 |
19,432 |
11.68% |
14,862 |
46.02% |
|
EBITDA (₹ Cr) |
10,299 |
8,352 |
23.31% |
4,386 |
134.82% |
|
EBITDA Margin |
48.14% |
43.67% |
4.47% |
29.93% |
18.21% |
|
PAT (₹ Cr) |
6,597 |
4,958 |
33.06% |
2,162 |
205.13% |
|
PAT Attributable to Owners (₹ Cr) |
5,629 |
4,207 |
33.80% |
1,781 |
216.06% |
|
PAT Margin |
30.84% |
25.93% |
4.91% |
14.75% |
16.08% |
|
EPS (₹) |
14.39 |
10.76 |
33.74% |
4.55 |
216.26% |
Source: Vedanta Aluminium Q1 FY27 Financial Results.
Vedanta Aluminium Shareholding Pattern
As of June 2026, promoters held the largest stake in Vedanta Aluminium at 56.38%. DIIs held 13.90%, followed by FIIs with 12.55%. Public shareholders accounted for 16.93%, while the government and other shareholders held 0.07% and 0.16%, respectively. The company had around 21.16 lakh shareholders during the quarter.
Conclusion
Vedanta Aluminium’s Q1 FY27 performance showed strong growth in revenue, EBITDA and profit, supported by improved aluminium realizations and higher margins. Its growing export presence adds another growth driver. However, aluminium prices, global supply conditions and capacity expansion will remain important factors influencing the company’s earnings and stock performance.
The company’s ability to sustain margins, increase production and benefit from demand across key end-use industries will be important to watch in the coming quarters.
All topics
Click the link, confirm the box next to sahi.com is checked — ignore any other results.