
Tata Power Q1 Results 2027: PAT Rises 11% YoY; Revenue Grows 6%
Tata Power reported steady earnings growth in Q1 FY27, supported by higher revenue from its transmission & distribution business and improved operating performance across key segments.

Tata Power Q1 Results 2027: Tata Power reported a steady Q1 FY27 performance, with Profit After Tax (PAT) rising 10.98% YoY to ₹1,400.86 crore and revenue from operations increasing 5.63% YoY to ₹19,051.26 crore. EBITDA remained resilient during the quarter, supported by improved operating performance.
Tata Power Q1 Results FY2027: On 27 July, Tata Power reported its financial performance for the first quarter of FY27. Revenue from operations increased 5.63% year-on-year to ₹19,051.26 crore, while Profit After Tax (PAT) rose 10.98% YoY to ₹1,400.86 crore.
Tata Power Q1 FY27 Results Highlights
-
Revenue from Operations increased to ₹19,051.26 crore, up 5.63% YoY from ₹18,035.07 crore. Compared with ₹14,900.20 crore in Q4 FY26, revenue increased 27.86% QoQ.
-
Total Revenue stood at ₹19,439.65 crore in Q1 FY27, registering a 5.67% YoY increase from ₹18,396.78 crore in Q1 FY26. Compared with ₹15,455.48 crore in Q4 FY26, total revenue increased 25.78% QoQ.
-
EBITDA (Excluding Other Income) stood at ₹4,013.29 crore, registering 3.04% YoY growth from ₹4,139.01 crore. Compared with ₹2,599.19 crore in Q4 FY26, EBITDA increased 54.41% QoQ.
-
EBITDA Margin stood at 21.07%, compared with 22.95% in Q1 FY26 and 17.44% in Q4 FY26, declining by 1.88 percentage points YoY while improving by 3.62 percentage points QoQ.
-
Profit After Tax (PAT) stood at ₹1,400.86 crore, rising 10.98% YoY from ₹1,262.32 crore. Compared with ₹1,415.52 crore in Q4 FY26, PAT declined 1.04% QoQ.
-
PAT Margin stood at 7.35%, compared with 7.00% in Q1 FY26 and 9.50% in Q4 FY26, expanding by 0.35 percentage points YoY while declining by 2.15 percentage points QoQ.
-
Earnings Per Share (EPS) increased to ₹3.68 from ₹3.31 in Q1 FY26, registering 11.18% YoY growth. Compared with ₹3.12 in Q4 FY26, EPS increased 17.95% QoQ.
|
Metric |
Q1 FY27 |
Q4 FY26 |
QoQ % |
Q1 FY26 |
YoY % |
|---|---|---|---|---|---|
|
Revenue from Operations (₹ Cr) |
19,051.26 |
14,900.20 |
27.86% |
18,035.07 |
5.63% |
|
Total Revenue (₹ Cr) |
19,439.65 |
15,455.48 |
25.78% |
18,396.78 |
5.67% |
|
EBITDA (₹ Cr) |
4,013.29 |
2,599.19 |
54.41% |
4,139.01 |
3.04% |
|
EBITDA Margin |
21.07% |
17.44% |
3.62% |
22.95% |
-1.88% |
|
PAT (₹ Cr) |
1,400.86 |
1,415.52 |
-1.04% |
1,262.32 |
10.98% |
|
PAT Margin |
7.35% |
9.50% |
-2.15% |
7.00% |
0.35% |
|
EPS (₹) |
3.68 |
3.12 |
17.95% |
3.31 |
11.18% |
Source: Tata Power Q1 FY27 Financial Results.
Tata Power Q1 FY27 Segment-wise Revenue
Thermal & Hydro remained the largest growth contributor during the quarter, more than doubling on a sequential basis. Renewables recorded stable year-on-year growth, while the Transmission & Distribution business continued to contribute the largest share of revenue.
|
Particulars (₹ Cr) |
Q1 FY27 |
Q4 FY26 |
QoQ % |
Q1 FY26 |
YoY % |
|---|---|---|---|---|---|
|
Thermal & Hydro |
5,192.83 |
2,433.84 |
113.36% |
4,844.19 |
7.20% |
|
Renewables |
3,771.46 |
4,003.43 |
-5.79% |
3,625.85 |
4.02% |
|
Transmission & Distribution |
11,440.70 |
10,698.83 |
6.93% |
10,077.83 |
13.52% |
|
Others |
106.44 |
114.68 |
-7.18% |
109.05 |
-2.39% |
|
Revenue from Operations |
20,511.40 |
17,250.80 |
18.90% |
18,656.90 |
9.94% |
Source: Tata Power Q1 FY27 Financial Results.
READ THIS ALSO: Canara Bank Q1 Results 2027
TATA Power Share price Today
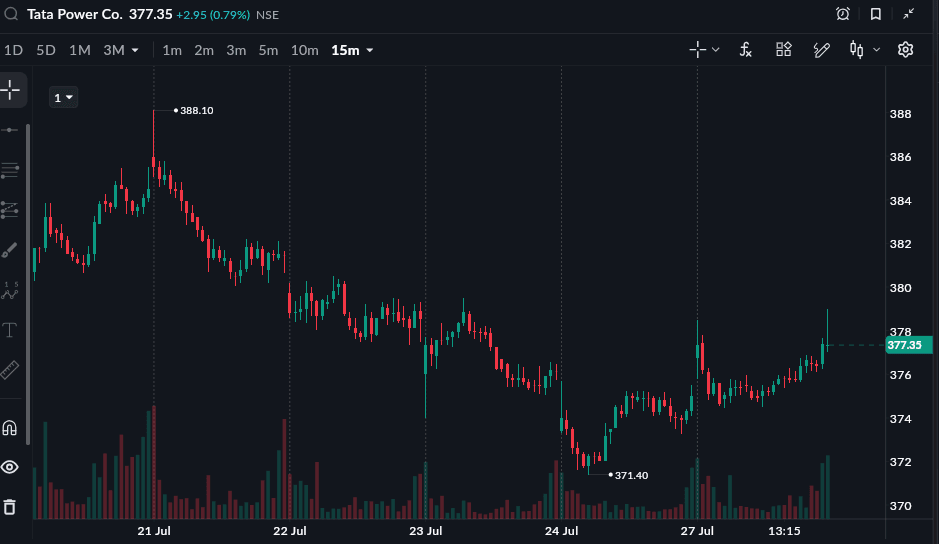
As of 27 July, 3:30 PM
Bharat Electronics share price closed at 377.35 (+0.79%) on 27 July 2026. The stock is down 0.75% year-to-date and down 4.14% in one year from 27 July 2025 to 27 July 2026
All topics
Click the link, confirm the box next to sahi.com is checked — ignore any other results.