
Tata Consumer Products Q1 FY27 Results: Revenue Grows 12% YoY, PAT Rises 28%
Tata Consumer Products reported healthy Q1 FY27 growth, driven by strong performance in its India and International businesses, while higher operating profitability supported a sharp rise in net profit.

Tata Consumer Products Q1 Results 2027: Tata Consumer Products reported healthy Q1 FY27 earnings with revenue from operations rising 11.93% YoY to ₹5,348.88 crore and PAT increasing 28.41% to ₹444.86 crore. Strong growth in the India and International businesses helped offset weakness in the non-branded segment.
Tata Consumer Products Q1 Results 2027: On 24 July, Tata Consumer Products reported a healthy performance in the first quarter of FY27, supported by steady growth across its branded businesses.
Revenue from Operations increased 11.93% year-on-year to ₹5,348.88 crore, while Profit After Tax (PAT) rose 28.41% YoY to ₹444.86 crore, despite a softer performance compared with the previous quarter.
Tata Consumer Products Q1 FY2027 Results Highlights
-
Revenue from Operations stood at ₹5,348.88 crore in Q1 FY27, registering 11.93% YoY growth from ₹4,778.91 crore in Q1 FY26. Compared with ₹5,433.62 crore in Q4 FY26, revenue declined 1.56%.
-
Total Revenue came in at ₹5,420.82 crore, up 12.46% YoY from ₹4,820.08 crore. Compared with ₹5,486.18 crore in Q4 FY26, total revenue declined 1.19%.
-
EBITDA (excluding Other Income) stood at ₹724.14 crore, compared with ₹606.94 crore in Q1 FY26, reflecting 19.31% YoY growth. Compared with ₹792.41 crore in Q4 FY26, EBITDA declined 8.62%.
-
EBITDA Margin improved to 13.54%, compared with 12.70% in Q1 FY26, expanding by 84 basis points. Compared with 14.58% in Q4 FY26, EBITDA margin contracted by 105 basis points.
-
Profit After Tax (PAT) stood at ₹444.86 crore, compared with ₹346.44 crore in Q1 FY26, reflecting 28.41% YoY growth. Compared with ₹491.22 crore in Q4 FY26, PAT declined 9.44%.
-
PAT Margin improved to 8.32%, compared with 7.25% in Q1 FY26, expanding by 107 basis points. Compared with 9.04% in Q4 FY26, PAT margin contracted by 72 basis points.
|
Metric |
Q1 FY27 |
Q4 FY26 |
QoQ % |
Q1 FY26 |
YoY % |
|---|---|---|---|---|---|
|
Revenue from Operations (₹ Cr) |
5,348.88 |
5,433.62 |
-1.56% |
4,778.91 |
11.93% |
|
Total Revenue (₹ Cr) |
5,420.82 |
5,486.18 |
-1.19% |
4,820.08 |
12.46% |
|
EBITDA (Ex. Other Income) (₹ Cr) |
724.14 |
792.41 |
-8.62% |
606.94 |
19.31% |
|
EBITDA Margin |
13.54% |
14.58% |
-105 bps |
12.70% |
+84 bps |
|
PAT (₹ Cr) |
444.86 |
491.22 |
-9.44% |
346.44 |
28.41% |
|
PAT Margin |
8.32% |
9.04% |
-72 bps |
7.25% |
+107 bps |
|
EPS (₹) |
4.31 |
4.24 |
1.65% |
3.38 |
27.51% |
Source: Tata Consumer Products Limited Q1 FY27 Financial Results.
Tata Consumer Products Segment Performance
Healthy revenue growth was primarily driven by the India and International businesses, which continued to deliver double-digit year-on-year growth. While the Non-Branded Business witnessed lower realizations and volumes, the company's core branded portfolio remained resilient, supporting overall revenue and profitability
|
Segment |
Q1 FY27 |
Q4 FY26 |
QoQ % |
Q1 FY26 |
YoY % |
|---|---|---|---|---|---|
|
India Business |
3,540.30 |
3,327.91 |
6.38% |
3,125.70 |
13.26% |
|
International Business |
1,342.80 |
1,418.09 |
-5.31% |
1,145.20 |
17.25% |
|
Non-Branded Business |
497.64 |
714.41 |
-30.34% |
535.76 |
-7.12% |
|
Other |
11.48 |
8.42 |
36.34% |
10.30 |
11.46% |
|
Less: Inter-segment Revenue |
(43.34) |
(35.21) |
23.09% |
(38.05) |
13.90% |
|
Revenue from Operations |
5,348.88 |
5,433.62 |
-1.56% |
4,778.91 |
11.93% |
Source: Tata Consumer Products Q1 FY27 Financial Results
READ THIS: SBI Life Insurance Q1 FY27 Results
TATA Consumer Products Share Price Today
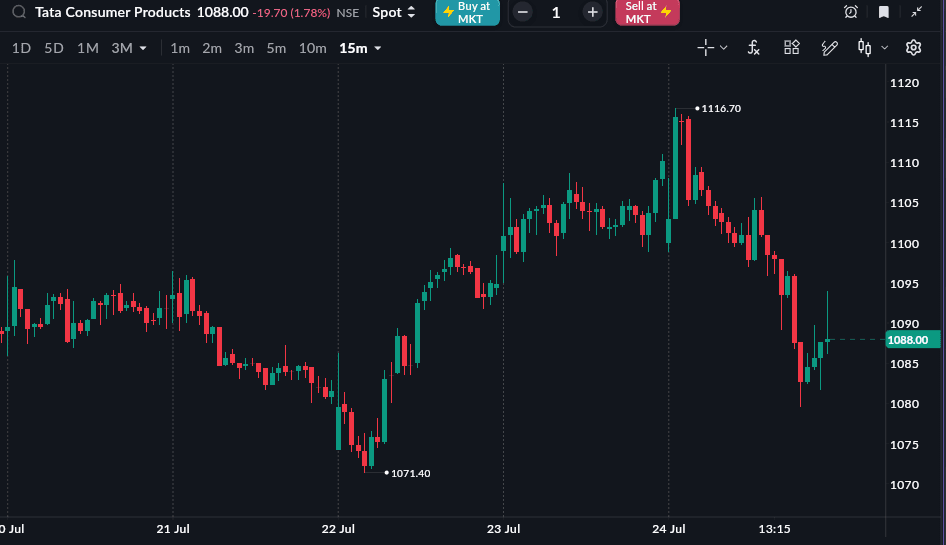
As of 24 July, 3:30 PM
Tata Consumer Products share price is trading at 1092.00 (-1.42%) on 24 July 2026. The stock is down -7.21% year-to-date and up 1.79% in one year from 24 July 2025 to 24 July 2026