
ORB Trading Strategy Explained: How Traders Use Opening Range Breakout with VWAP & EMA
Learn how the Opening Range Breakout strategy works, how to combine ORB with VWAP and 21 EMA, and why stock selection and risk management matter more than any single setup.
ORB (Opening Range Breakout) marks the high and low of the first 15–30 minutes after market open as key breakout and breakdown zones. A valid ORB breakout requires a candle close beyond the range, VWAP alignment, 21 EMA in the same direction, and above-average volume. Without these, most moves are false. Stock selection (high liquidity, active momentum, market trend alignment) and timeframe consistency matter as much as the setup itself. Booking partial profits at 1:1 and moving stop to cost is the most overlooked but most critical part of ORB risk management.
Intraday trading moves fast. In the first few minutes after the market opens, stocks often witness sharp price action, heavy volumes, and sudden directional moves. For many traders, this opening volatility creates both confusion and opportunity.
One strategy that has consistently remained popular among intraday traders is the Opening Range Breakout (ORB) strategy. When combined with indicators like VWAP and 21 EMA, ORB can help traders understand momentum, trend direction, and potential breakout zones more clearly.
Modern trading terminals now make this process easier by automatically identifying important levels on charts instead of forcing traders to mark them manually. SAHI has integrated features that visually highlight opening ranges, scanners, VWAP, and moving averages in a single workspace, making chart analysis faster and more structured.
This blog explains what ORB is, how traders use it, why stock selection matters, and how ORB is often combined with VWAP and EMA for confirmation.
What Is Opening Range Breakout (ORB)?
The Opening Range Breakout (ORB) strategy is based on one simple market observation: the first 15–30 minutes after market open often establish the day's early sentiment.
During this period, both buyers and sellers actively react to overnight news, global cues, earnings announcements, and institutional orders. As a result, prices can become highly volatile.
The ORB strategy identifies:
- The highest price reached during the opening range
- The lowest price reached during the opening range
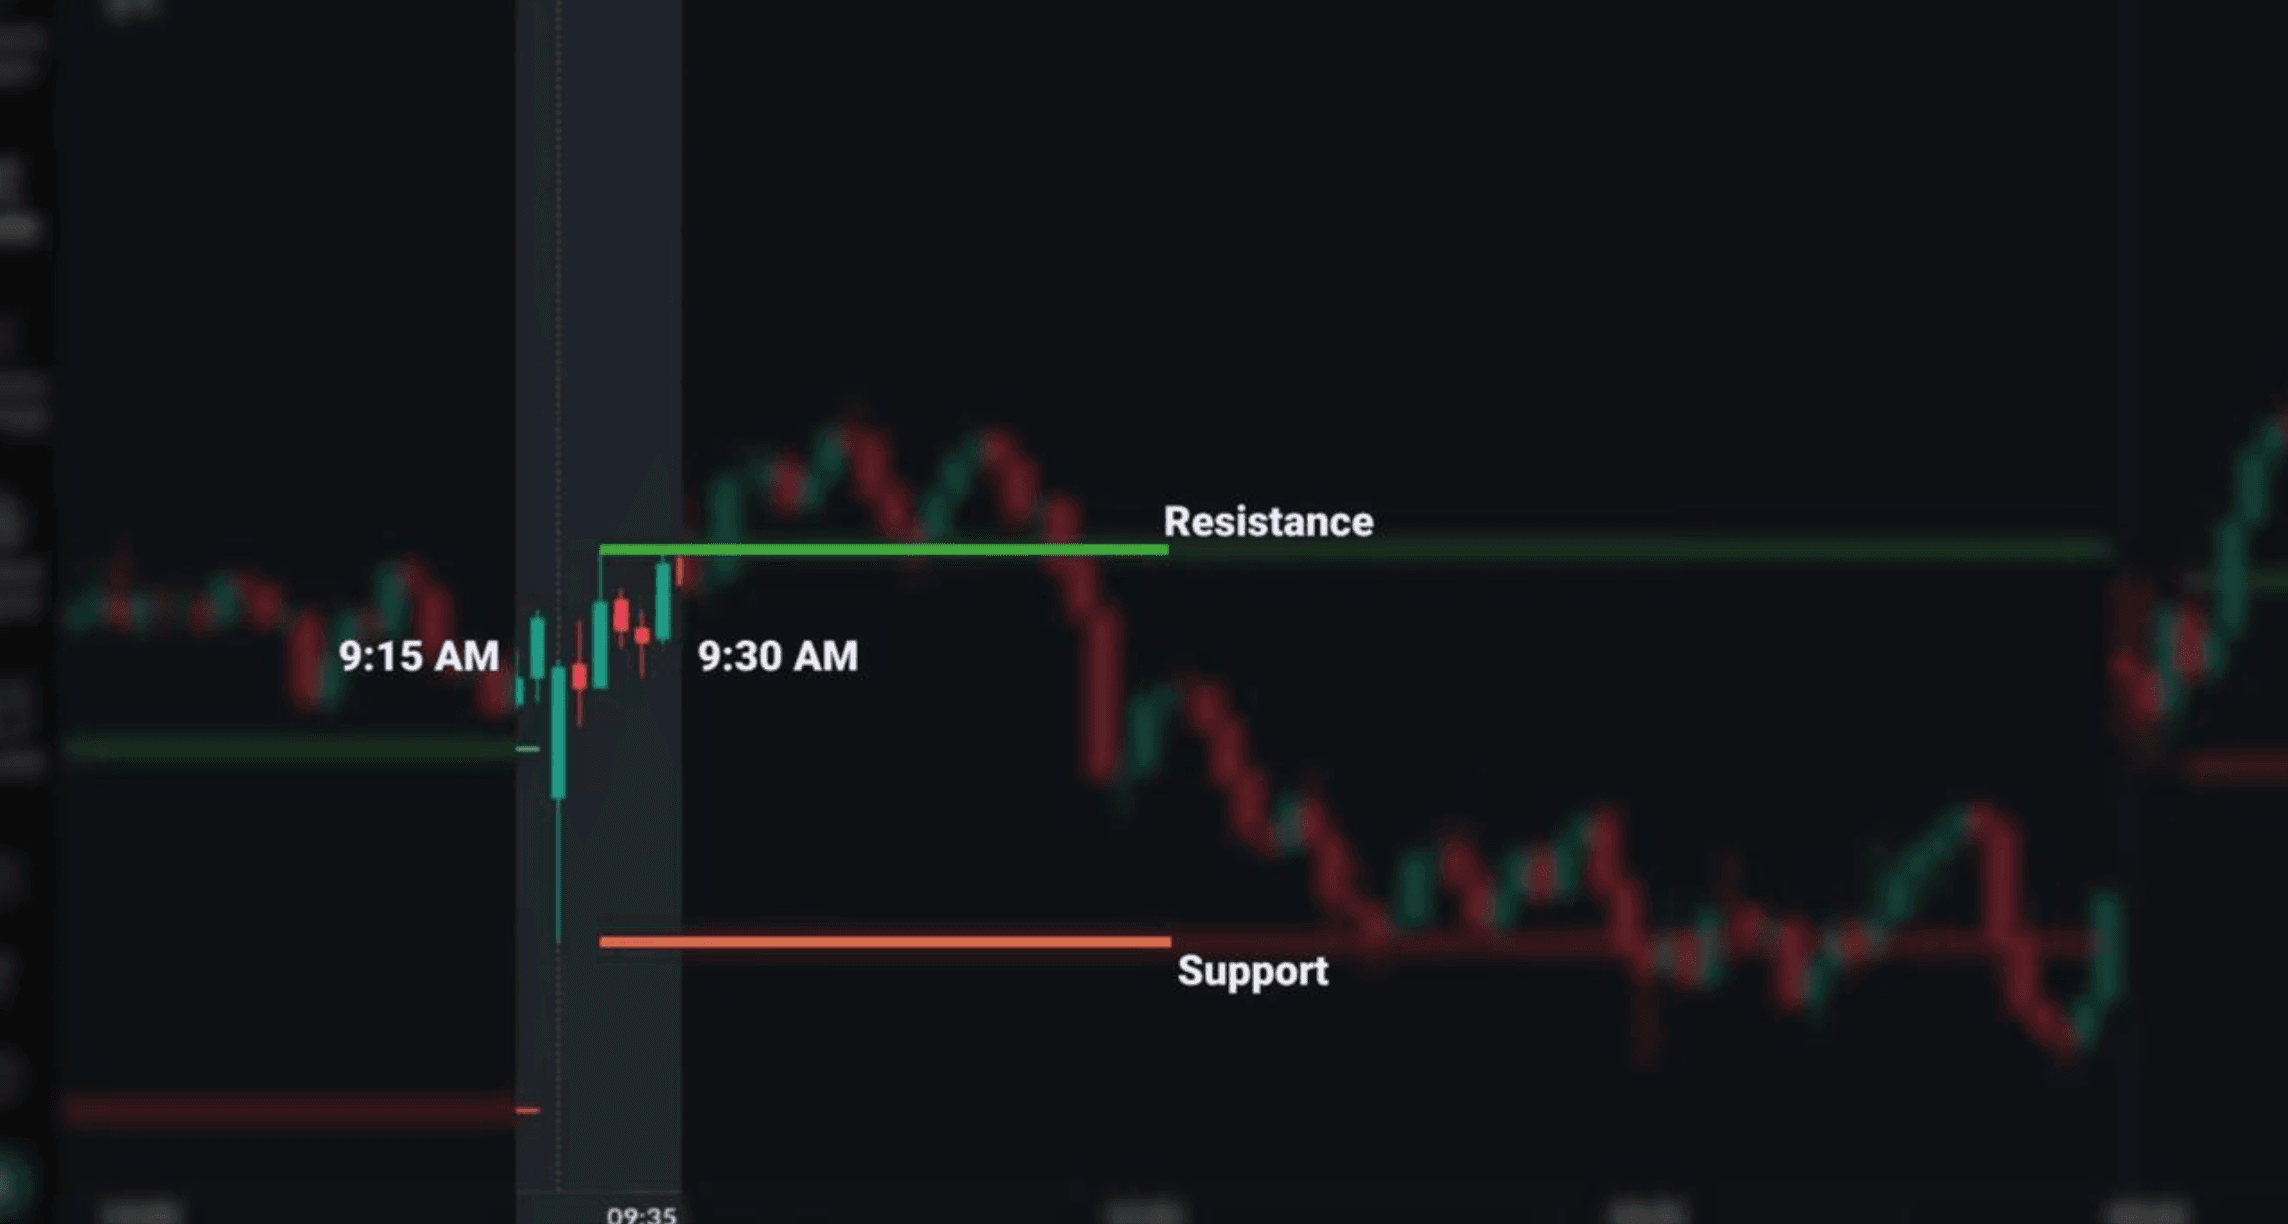
These levels then act as potential resistance zones, support zones, and breakout or breakdown areas. Typically, traders monitor the price action between 9:15 AM and 9:30 AM in the Indian stock market. Once this range is established, they look for a breakout above the high or a breakdown below the low.
Note: The ORB high and low represent the market's consensus after digesting overnight information. Institutional desks often use the 30-minute ORB specifically because it gives sufficient time for genuine order flow to settle, reducing noise from the first few minutes of reactive retail trading.
Why the First 15 Minutes Matter in Intraday Trading
The opening session of the market carries significant information. This is the period when:
- Overnight sentiment gets priced in
- Institutional orders enter the market
- Traders react to global market movements
- Volatility and liquidity are usually highest
Historical market studies show that a large portion of a stock's intraday range is often formed during the first hour. That is why many momentum-based strategies focus heavily on the opening session.
ORB traders believe that if price decisively crosses the opening range, the move can sometimes continue for a substantial part of the day. However, not every breakout sustains — this is where confirmation tools like VWAP and EMA become useful.
Also read: Support and Resistance in Trading: Key Levels and Breakouts Explained
How ORB Works on a Trading Chart
The concept itself is simple.
Step 1: Identify the opening range — typically by marking the high and low between 9:15 AM and 9:30 AM.
Step 2: Wait for price action near these levels.
Step 3: Watch for either a breakout above the opening range high or a breakdown below the opening range low.
One important detail many traders focus on is candle closing. A mere wick above or below the range is often not considered enough. Many traders prefer waiting for a proper candle close beyond the opening range to avoid false breakouts.
On SAHI Charts, these opening range levels can be automatically plotted on charts by adding the ORB indicator — reducing manual effort and helping traders quickly scan multiple stocks.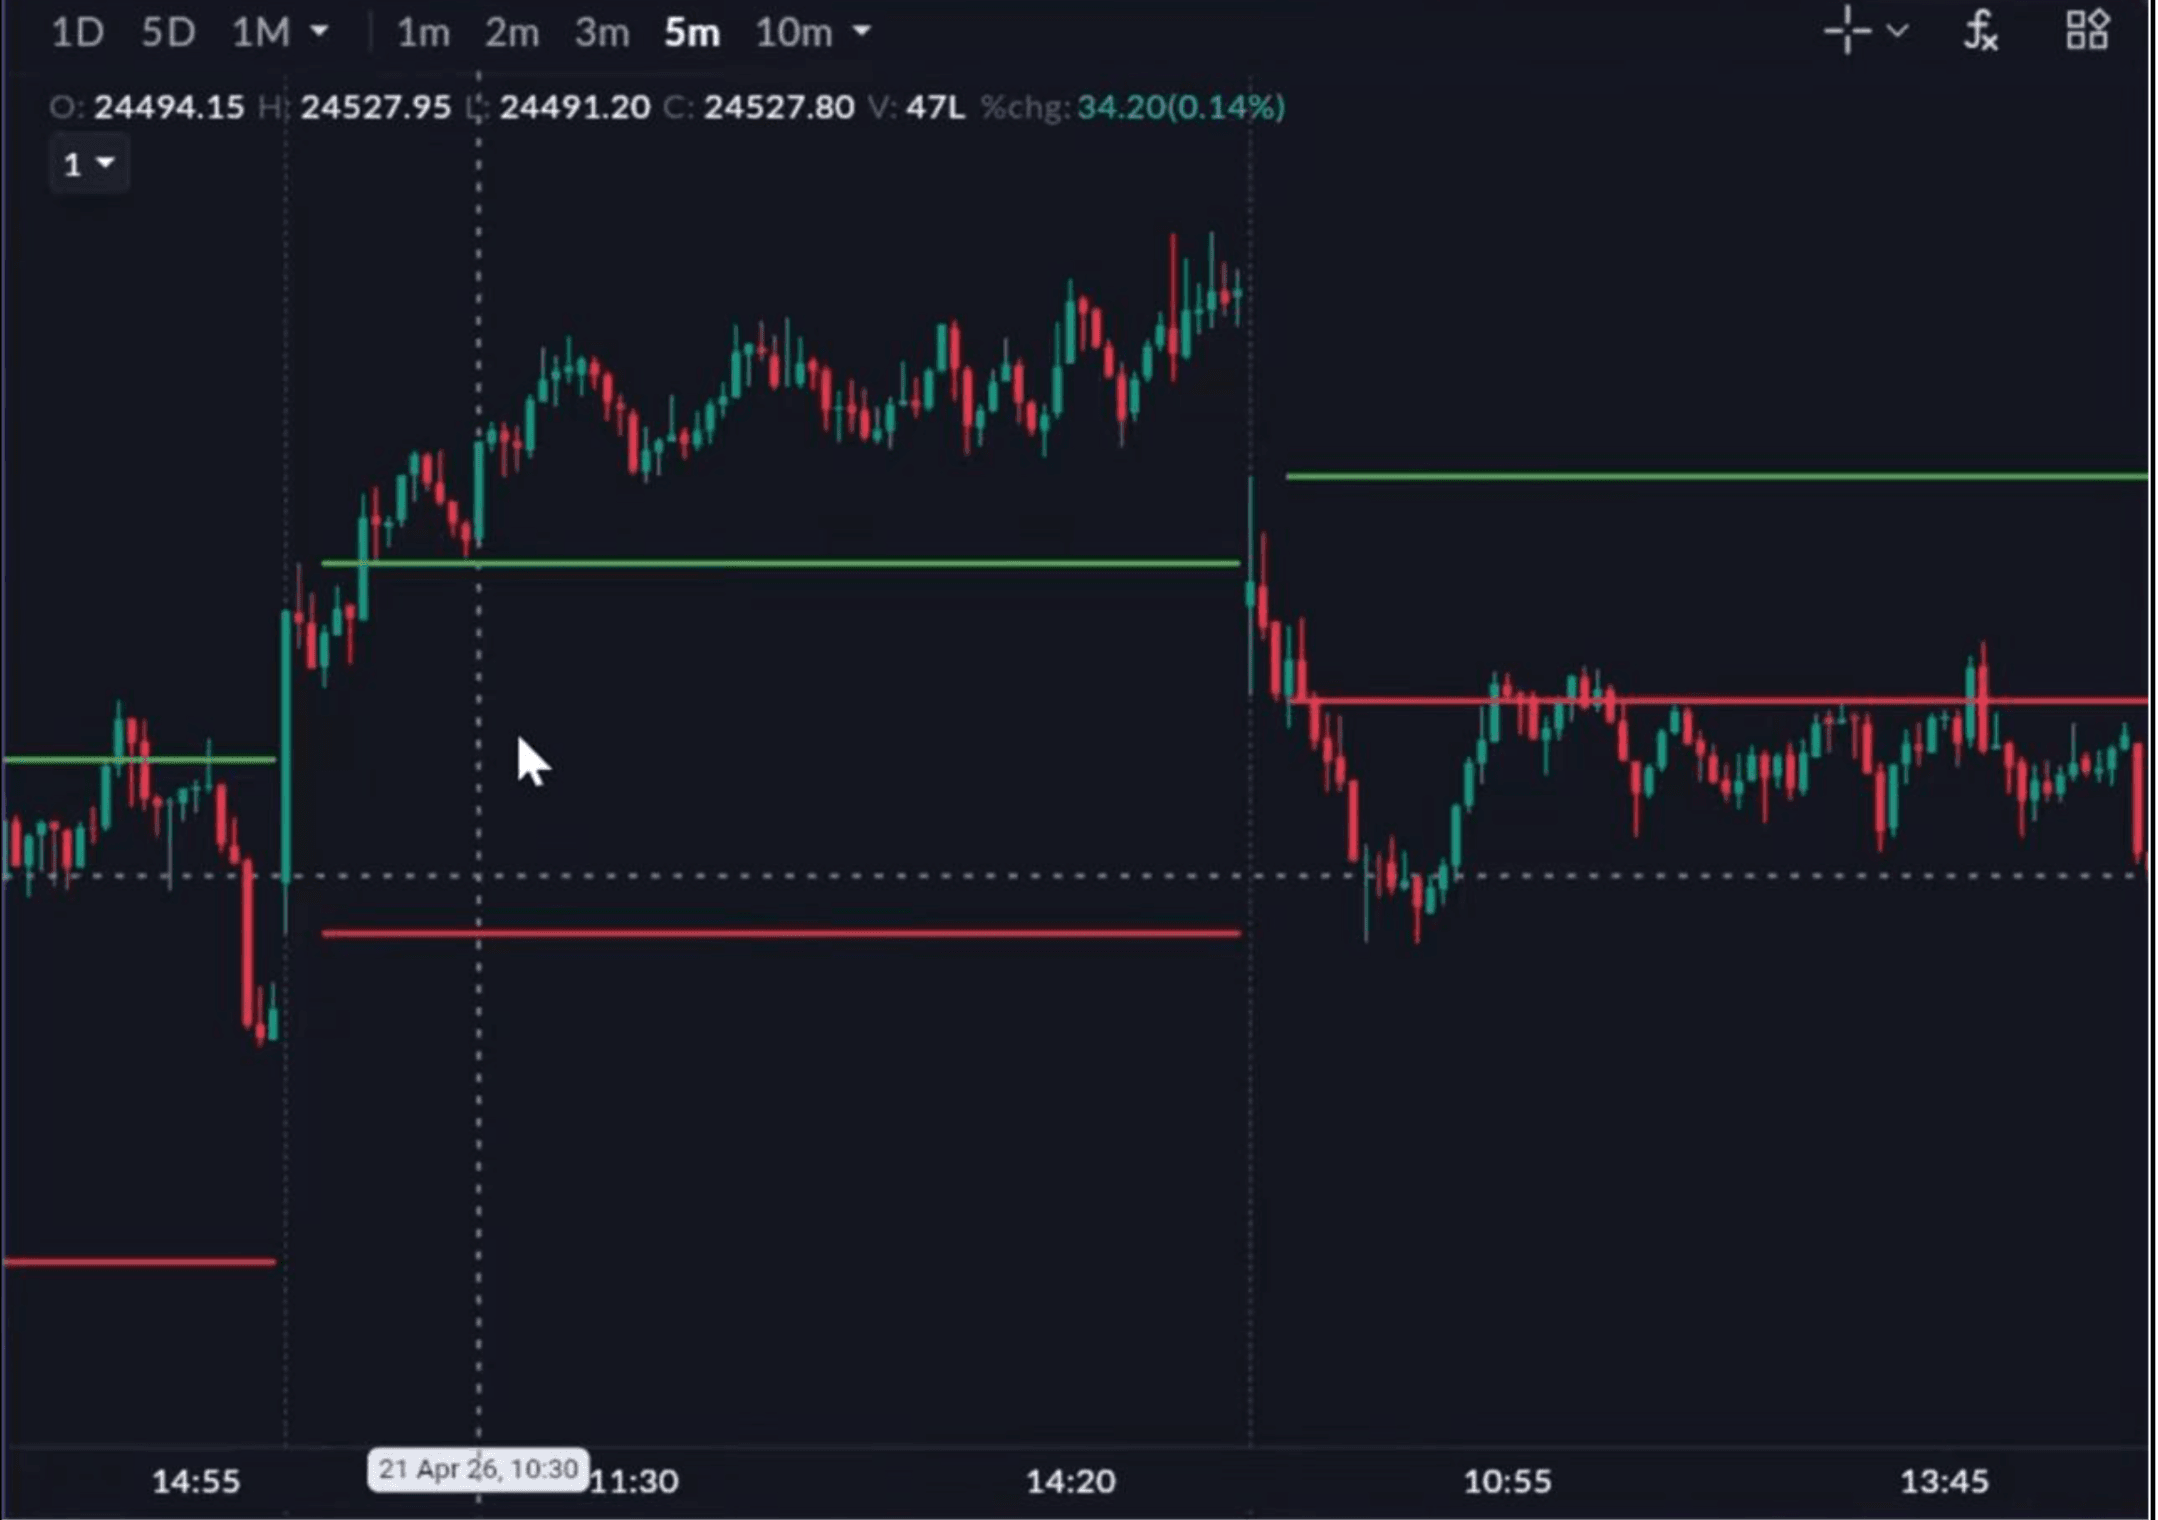
Once added, the chart displays green and red zones showing how much the market rose or fell each day between 9:15 AM and 9:30 AM, giving an instant visual reference for the opening range.
SAHI also allows traders to customise the timeframe for the opening range. Simply go to the indicator settings (fx), then click the pencil icon to adjust the input window to match your preferred ORB duration.
ORB Strategy for Scalping vs Intraday Trading
Different traders use ORB differently depending on their trading style.
1. ORB for Scalping
Scalpers generally prefer using the 5-minute timeframe because it allows them to capture quick momentum-based moves in the market. Their trading style focuses on faster entries and exits, smaller targets, and short-duration trades that take advantage of rapid price movement. Since scalping depends heavily on speed and timing, waiting for too many confirmations can sometimes result in missed opportunities.
You might also be interested in: Candlestick Charts and Common Trading Patterns
2. ORB for Intraday Trading
Intraday traders often prefer using the 15-minute or 30-minute timeframe because it helps them focus on slightly larger price moves while also allowing more confirmation before entering a trade. Compared to scalpers, intraday traders usually aim for more structured setups and try to avoid reacting to every small market fluctuation.
One important principle frequently discussed in ORB trading is maintaining consistency in timeframe selection. Randomly switching between 5-minute, 10-minute, and 15-minute charts can create confusion, lead to mixed signals, and result in inconsistent decision-making.
Key insight: The timeframe you choose for ORB should match your holding period. A 5-minute ORB trader targeting ₹2–₹3 moves operates very differently from a 30-minute ORB trader targeting ₹15–₹20. Mixing these approaches leads to stops that are too tight for the timeframe or targets that are unrealistically large for the setup.
Why Stock Selection Is Extremely Important in ORB Trading
Not every stock is ideal for ORB trading, and one of the biggest reasons traders experience failed breakouts is poor stock selection. Generally, traders look for three key things before applying an Opening Range Breakout strategy:
- High liquidity: Stocks with strong trading volumes usually offer smoother price movement, better execution, and lower slippage.
- Volatility: Stocks moving in a very narrow range may not provide meaningful breakout opportunities. Actively moving stocks are more likely to generate momentum.
- Clear trend alignment with the broader market: If Nifty is weak, traders may prefer bearish setups. Strong market sentiment may shift focus toward bullish opportunities. This helps traders avoid taking positions against the overall market trend.
Also watch the video here:
How Traders Use Open = High and Open = Low Scanners
Some traders use scanners to quickly identify stocks showing strong momentum early in the trading session. Two commonly used concepts in intraday trading are Open = High and Open = Low.
- Open = High: When a stock opens near its highest point of the day and starts moving downward — this may indicate selling pressure and possible bearish momentum.
- Open = Low: When a stock opens near its lowest point and continues moving upward — this may suggest buying strength and bullish momentum.
Advanced scanners available on SAHI Trading Terminal allow traders to filter such stocks in real time and combine them with chart analysis. However, scanners alone are usually not enough for decision-making. This is where indicators like VWAP become important, as they help traders understand whether the momentum is actually being supported by broader intraday price and volume action.
Understanding VWAP in Intraday Trading
VWAP, or Volume Weighted Average Price, is an intraday trading indicator that calculates the average price of a stock while also taking trading volume into account. Many institutional traders closely monitor VWAP because it reflects where most of the trading activity is happening during the day.
Generally, when the price trades above VWAP, it may indicate bullish intraday sentiment, while price trading below VWAP may suggest bearish sentiment. However, VWAP is rarely used in isolation. Instead, traders combine it with price action, breakout levels, volume, and moving averages to get stronger confirmation before analysing a trade setup.
What Is 21 EMA and Why Is It Used?
EMA stands for Exponential Moving Average. Unlike simple moving averages, EMA gives more importance to recent prices, making it more responsive to short-term price movement.
The 21 EMA is widely followed in intraday trading because it helps traders identify short-term trend direction, dynamic resistance, and dynamic support. When combined with VWAP, traders try to identify whether momentum and trend are aligned.
Also read: Moving Averages (SMA & EMA) Explained
ORB + VWAP + 21 EMA: A Common Intraday Setup
Many traders combine all three indicators together.
A commonly discussed bearish setup may involve:
- Nifty showing weakness
- Stock appearing in Open = High scanner
- ORB breakdown below opening range low
- Bearish candle confirmation
- 21 EMA below VWAP
Similarly, bullish setups may involve:
- Strong market sentiment
- Open = Low stocks
- Breakout above opening range high
- Price above VWAP
- 21 EMA above VWAP
The goal of these filters is not prediction but confirmation.
Note: The confluence of ORB, VWAP, and 21 EMA creates a three-layered filter. Each additional confirmation reduces the number of valid setups but increases the probability of the ones that qualify. Experienced traders prefer fewer, higher-quality entries over frequent, low-confidence ones.
Risk Management in ORB Trading
Risk management remains one of the most important aspects of intraday trading, especially while using fast-paced strategies like ORB. Many traders maintain defined stop losses, fixed risk-reward ratios, and partial profit booking to manage uncertainty in the market.
One commonly followed approach involves:
- Booking partial profits once a 1:1 risk-reward target is achieved
- Moving the stop loss to cost after partial booking
- Allowing the remaining position to continue if momentum sustains
This helps traders protect capital while still participating in potential extended moves.
Another common practice among intraday traders is avoiding excessive exposure near market closing hours. As the session approaches its end, volatility and sudden reversals can increase, which is why many traders prefer reducing or closing their positions before the final trading hour.
Also read: Trading Psychology & Risk Management: The Missing Edge in Trading
Advantages of ORB Trading
- Simplicity: The strategy is easy to understand visually.
- Structured entries: ORB provides predefined breakout levels.
- Adaptability: Can be used by scalpers, intraday traders, and momentum traders.
- Works well with other indicators: ORB can be combined with VWAP, EMA, volume analysis, and market trend filters.
Limitations of ORB Trading
- False breakouts: Price may briefly cross the range and reverse quickly.
- Sideways markets: ORB tends to struggle in low-volatility or range-bound sessions.
- Requires discipline: Random entries and inconsistent timeframe selection can negatively impact results.
- No strategy works every day: Market conditions continuously change. Even widely used setups can fail during unpredictable sessions.
How Technology Is Changing Intraday Trading
Earlier, traders had to manually mark important levels on charts — opening ranges, support and resistance zones, and moving averages. This was time-consuming and difficult to manage while tracking multiple stocks simultaneously during live market hours.
Today, trading platforms have significantly automated this workflow. SAHI integrates features such as ORB indicators, scanners, VWAP, EMA tools, and customisable chart layouts within a single interface. This allows traders to monitor multiple setups more efficiently without cluttered workflows. Instead of manually drawing levels on every chart, traders can focus more on analysing price action, momentum, and overall market structure.