
Mastering Support and Resistance Levels: A Practical Trading Guide
From spotting price floors and ceilings to the 4 golden rules — here is how to trade support and resistance with confidence.
Support is a price level where buyers step in and stop a stock from falling further. Resistance is where sellers push back and cap further rises. These levels form at prior highs/lows, round numbers, and high-volume zones. Trade them by buying near support with a stop below it, or shorting near resistance with a stop above it. A breakout above resistance (or below support) on high volume signals a trend continuation — not a reversal.
When you are trading, you would not want to sustain a loss. For this very reason, there are several strategies you can follow. One of these strategies that people follow in candlestick pattern graphs is support and resistance, or S&R.
Identifying S&R indicators will give you specific price points on a graph that might yield you a maximum profit while buying or selling. So, S&R levels can provide you with a good entry or exit point for a trade.
Keep reading ahead to learn more about S&R and master it as a strategy!
What is Support?
In terms of trading, support can refer to a price level where a downward trend of any asset slows down or reverses due to increased buying interest (demand). At this level, buyers typically outnumber sellers, preventing the price from falling further.
Support acts as a price "floor," where the asset often finds stability and may bounce upward. The support level can be a good entry point to trade in that particular asset. In simple terms, it means that you can buy the stock when the price hits support levels.
What is Resistance?
A resistance level is a price level that is generally above the current market price, where the upward trend of any asset tends to slow down or reverse due to increased selling pressure (supply). This happens due to a fall in demand for the same and a low concentration of its trade volume.
At this level, sellers usually outnumber buyers, limiting further price increases. Resistance is also called the zone. It means that when the resistance levels are hit, you can sell the stock and square off your position in the market.
Explaining Support and Resistance Trading Strategy Through an Example
Example 1: Understanding Support
Consider a price chart where a stock has been falling and is now trading around ₹150.
Now, you notice that in the past, every time the price came near ₹148 and ₹150, it stopped falling and moved back up. This tells us that buyers are consistently stepping in at this level. This creates a support area.
Imagine a scenario where the current candle is at ₹151. Plus, it forms a strong bullish candle with a recent low at ₹148. A potential trading plan could be as follows:
- Step 1: Buy the stock at ₹151.
- Step 2: Set a stop loss for the stock at ₹148, as it is just below the support level.
- Step 3: Set a target selling point at the next visible resistance zone, which can be at ₹160.
Such a standpoint often leads to better profits for traders, and the reason would be that:
You identified the ₹150 level as a support level, which meant to you that the demand was strong there. Strong demand meant buying pressure increased, which pushed the price upward.
So, when you see a price bouncing from support, you can enter near support, place a stop loss just below it, and aim for the next resistance level.
Missed your trading window due to switching tools? Plot support and resistance levels instantly on graphs, analyse smarter, and trade faster with Sahi. Download the Sahi app now and simplify your trading workflow.
Example 2: Understanding Resistance
Consider a stock that has been rising and is currently trading near ₹320. Historical price action shows that whenever the price approaches ₹330, it struggles to move higher and begins to decline. This indicates the presence of a resistance level at ₹330.
Assume that the current price is ₹318 and the stock is approaching the resistance zone. A potential trading approach could be as follows:
- Step 1: Avoid initiating new buy positions near ₹330 (resistance level).
- Step 2: If already holding the stock, consider selling or booking profits near ₹330.
- Step 3: Alternatively, aggressive traders may consider short-selling near ₹330 with a stop-loss placed above the resistance level.
This approach is based on the assumption that resistance will hold and selling pressure may increase, leading to a possible price reversal. However, market movements are uncertain, and resistance levels may sometimes be broken.
Therefore, when the price approaches a resistance level, traders may consider exiting positions, avoiding new entries, or preparing for a potential reversal.
Why are Support and Resistance Important?
Support and resistance are important because they help traders identify key price levels for entry, exit, and risk management, enabling more informed and disciplined trading decisions. These reasons are explained below:
- Find Better Entries: You can enter trades at stronger price zones, improving timing and increasing chances of success.
- Limit Losses: You can place stop-loss levels logically, helping you control risk and avoid large, unexpected losses.
- Understand Market Behaviour: You can read where buyers or sellers are likely to act, giving you an edge in decision-making.
- Catch Trend Moves: You can spot breakouts early, helping you ride new trends or avoid getting trapped.
- Plan Exits Smartly: You can set clear profit targets, ensuring you don't exit too early or hold too long.
How to Master Support and Resistance: Key Rules to Follow
Below are the 4 key rules you need to know to master the support and resistance trading strategy:
Rule 1: Multiple Rejections
The first rule that you need to keep in mind is that you can only draw support or resistance levels if there are multiple rejections. This is because a trend can only be established if it has happened more than once. This is a classic way to draw your support and resistance indicators.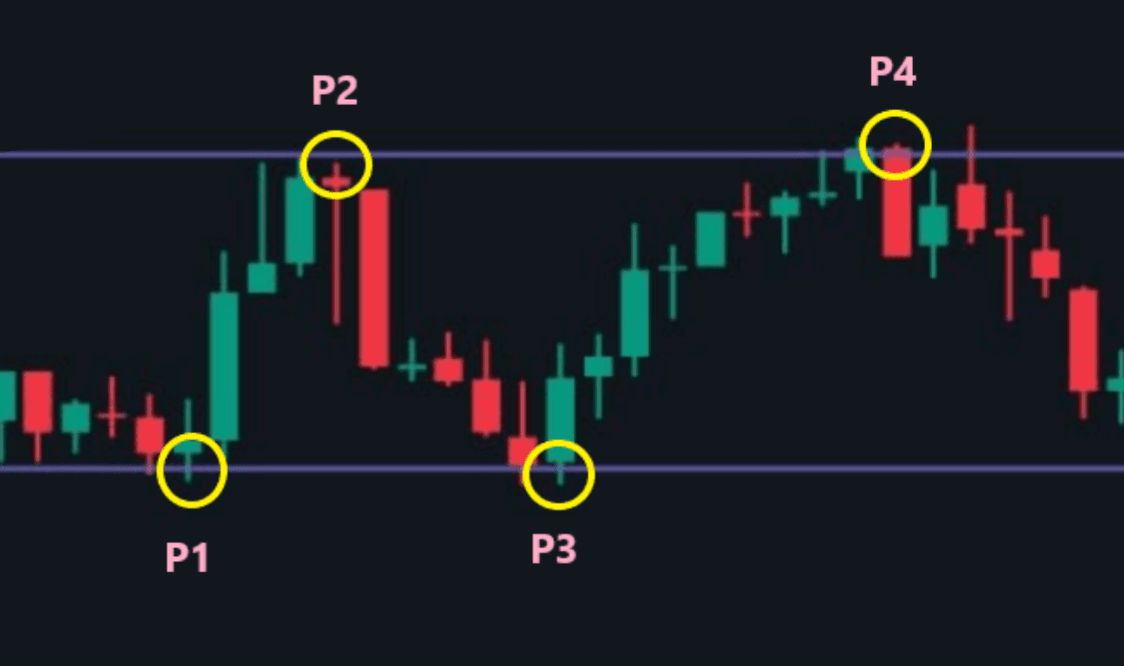
In the chart above, the candlestick chart presents a graph of a stock on a specific day. The graph has hit 2 lows from where it has recovered. These 2 points are marked as P1 and P3 in the graphs. These points make a line, which you can consider your support level. Furthermore, P2 and P4 mark the points of the graph where it shows resistance and drops. These pointers meet and make a resistance level.
Rule 2: Move Away from Swing Low/High
Now you might ask, how do I draw S&R levels if the candlestick is not moving sideways? Well, there is a solution to it as well. Let us understand it with the examples below:
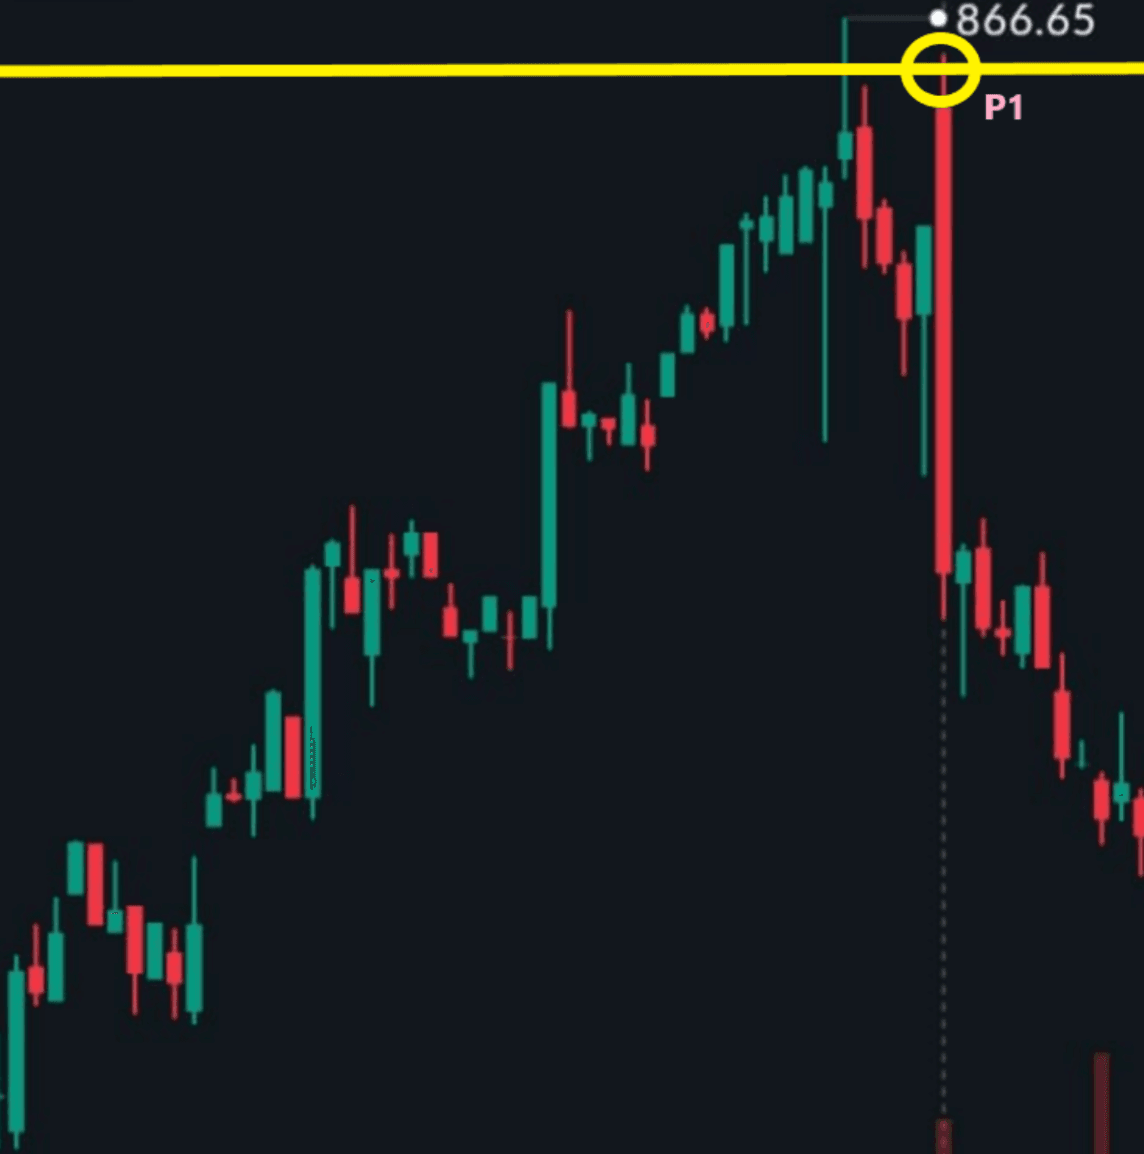
In the image above, you can see a graph that is bullish but suddenly falls sharply at point P1. In these conditions, you can draw a resistance line at P1.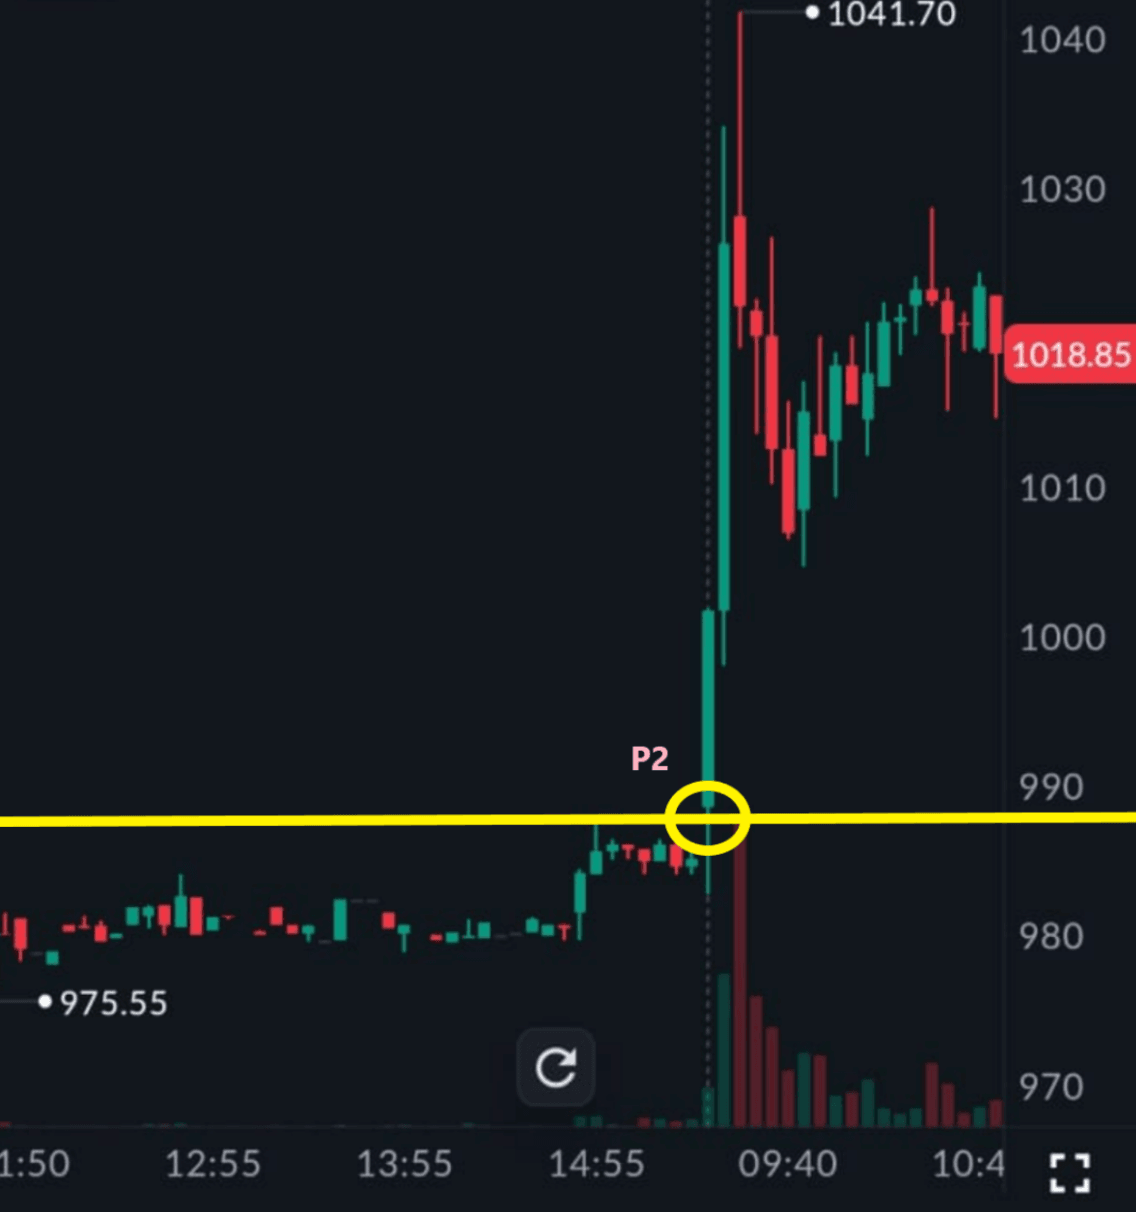
Similarly, if you have a case where you do not get multiple rejections and the price suddenly swings high, then you can draw a support level at that point. In the image above, at P2, the price of the stock suddenly went up, and we can now place a support level.
Rule 3: A Level can be Both Support and Resistance
Another rule to keep in mind is that both support and resistance levels are reversible. This means that support can become resistance and resistance can become support. Let us understand it with the help of the image below: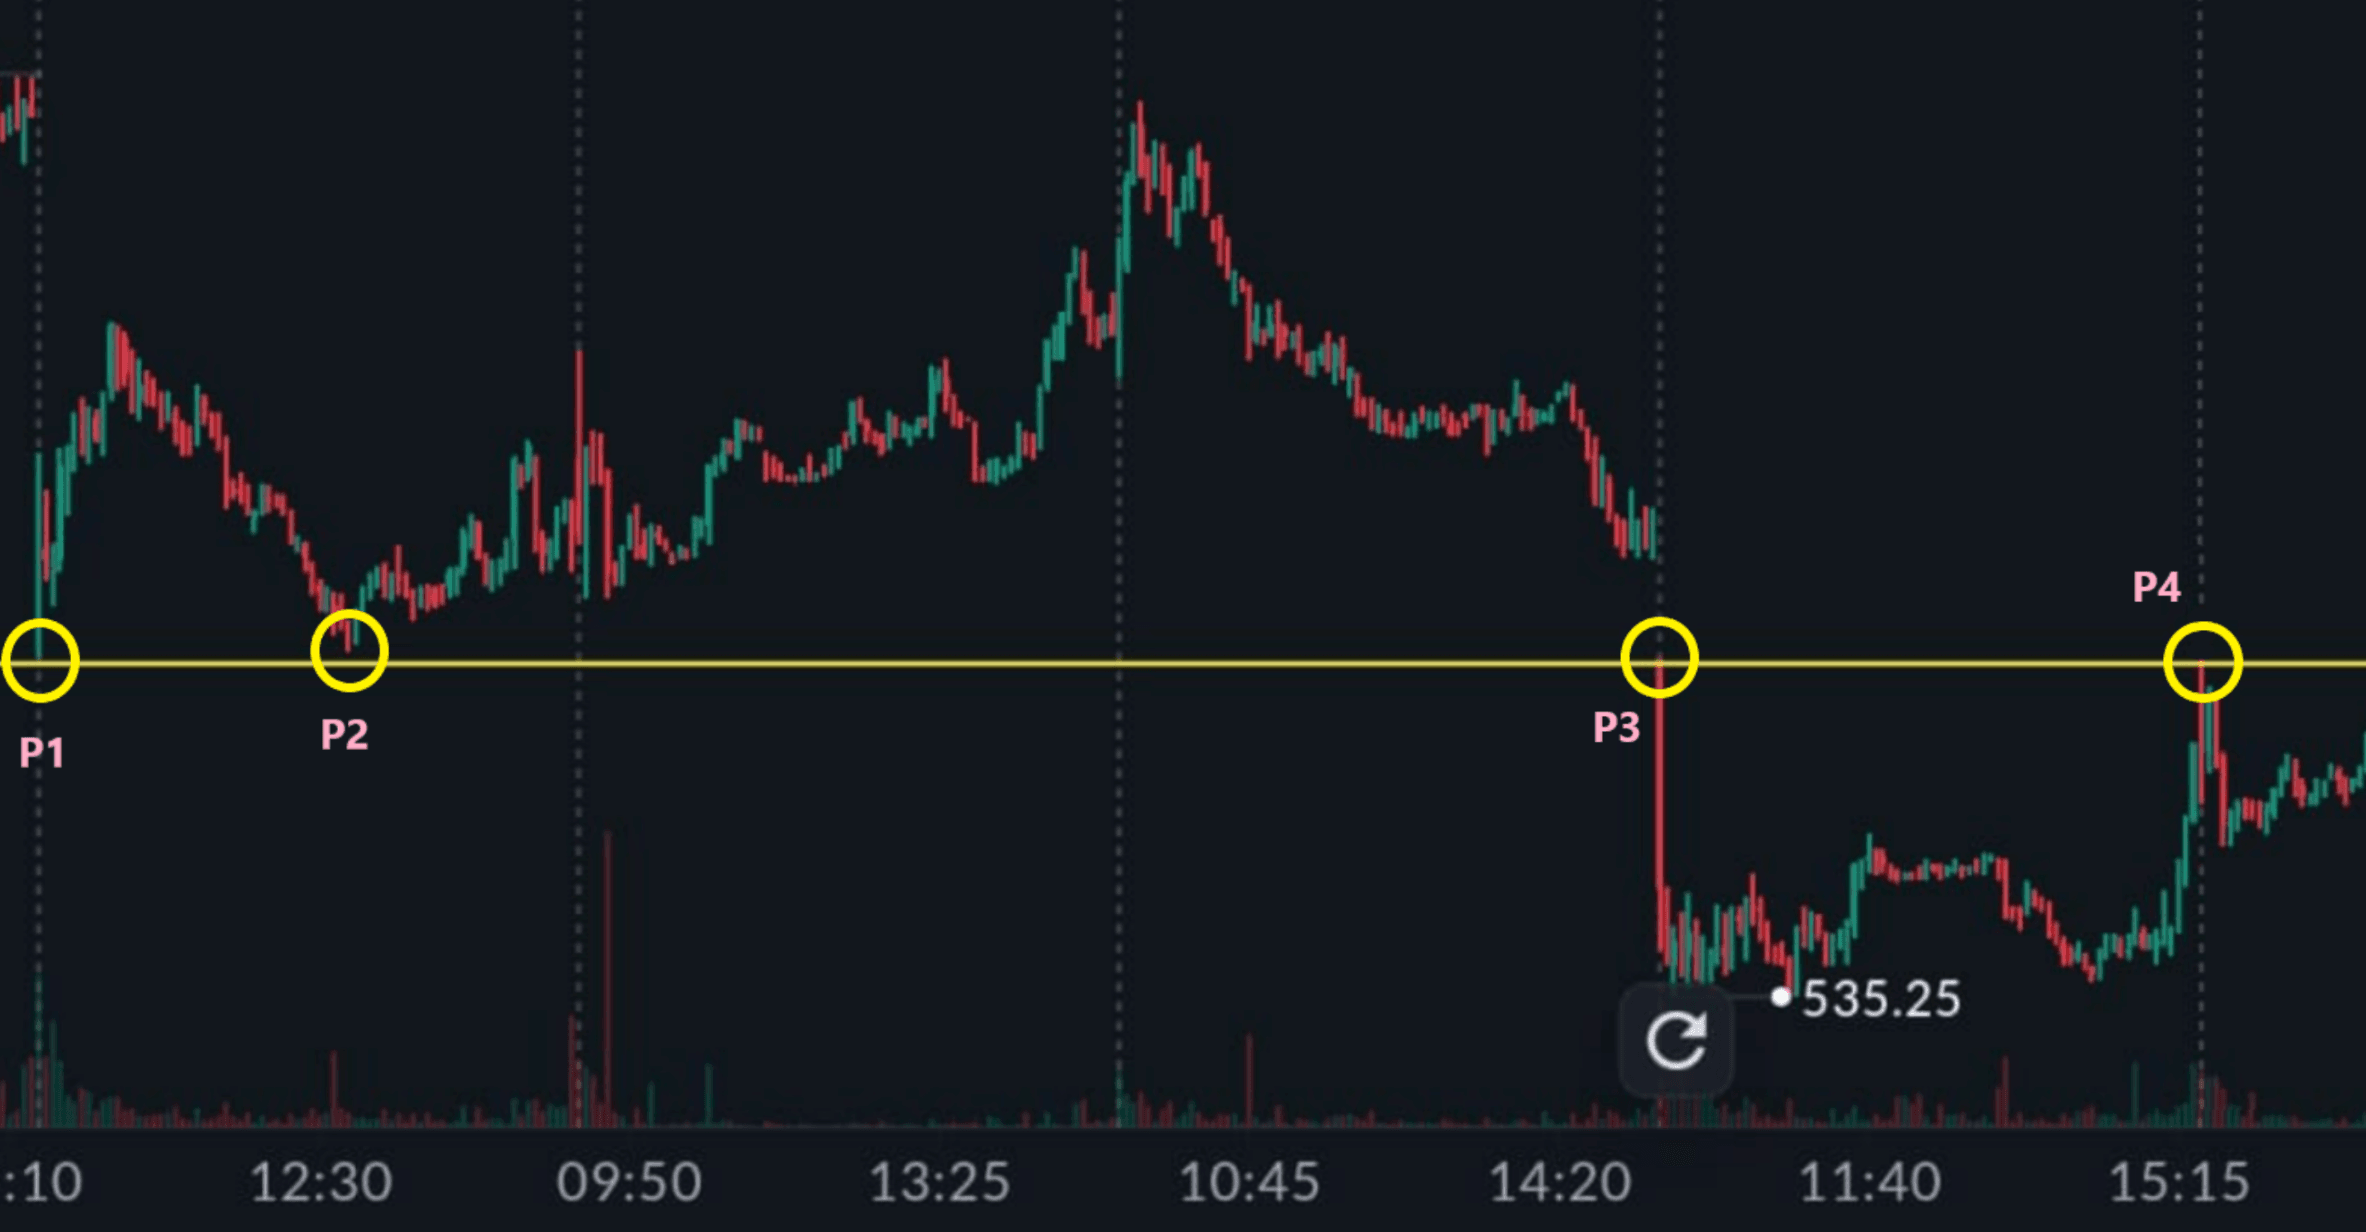
In this image, we can see that previously the lows of the stock at P1 and P2 were the support of the graph. Now at P3 and P4, these lows have become the highs of the chart, making them the new resistance level for the candlestick.
Rule 4: Levels Must be Near Current Price
In trading, the technical analysis matters, but if it is done with old data, it is obsolete. Therefore, the final rule that you need to keep in mind is that the support and resistance levels you draw should be near the current market price.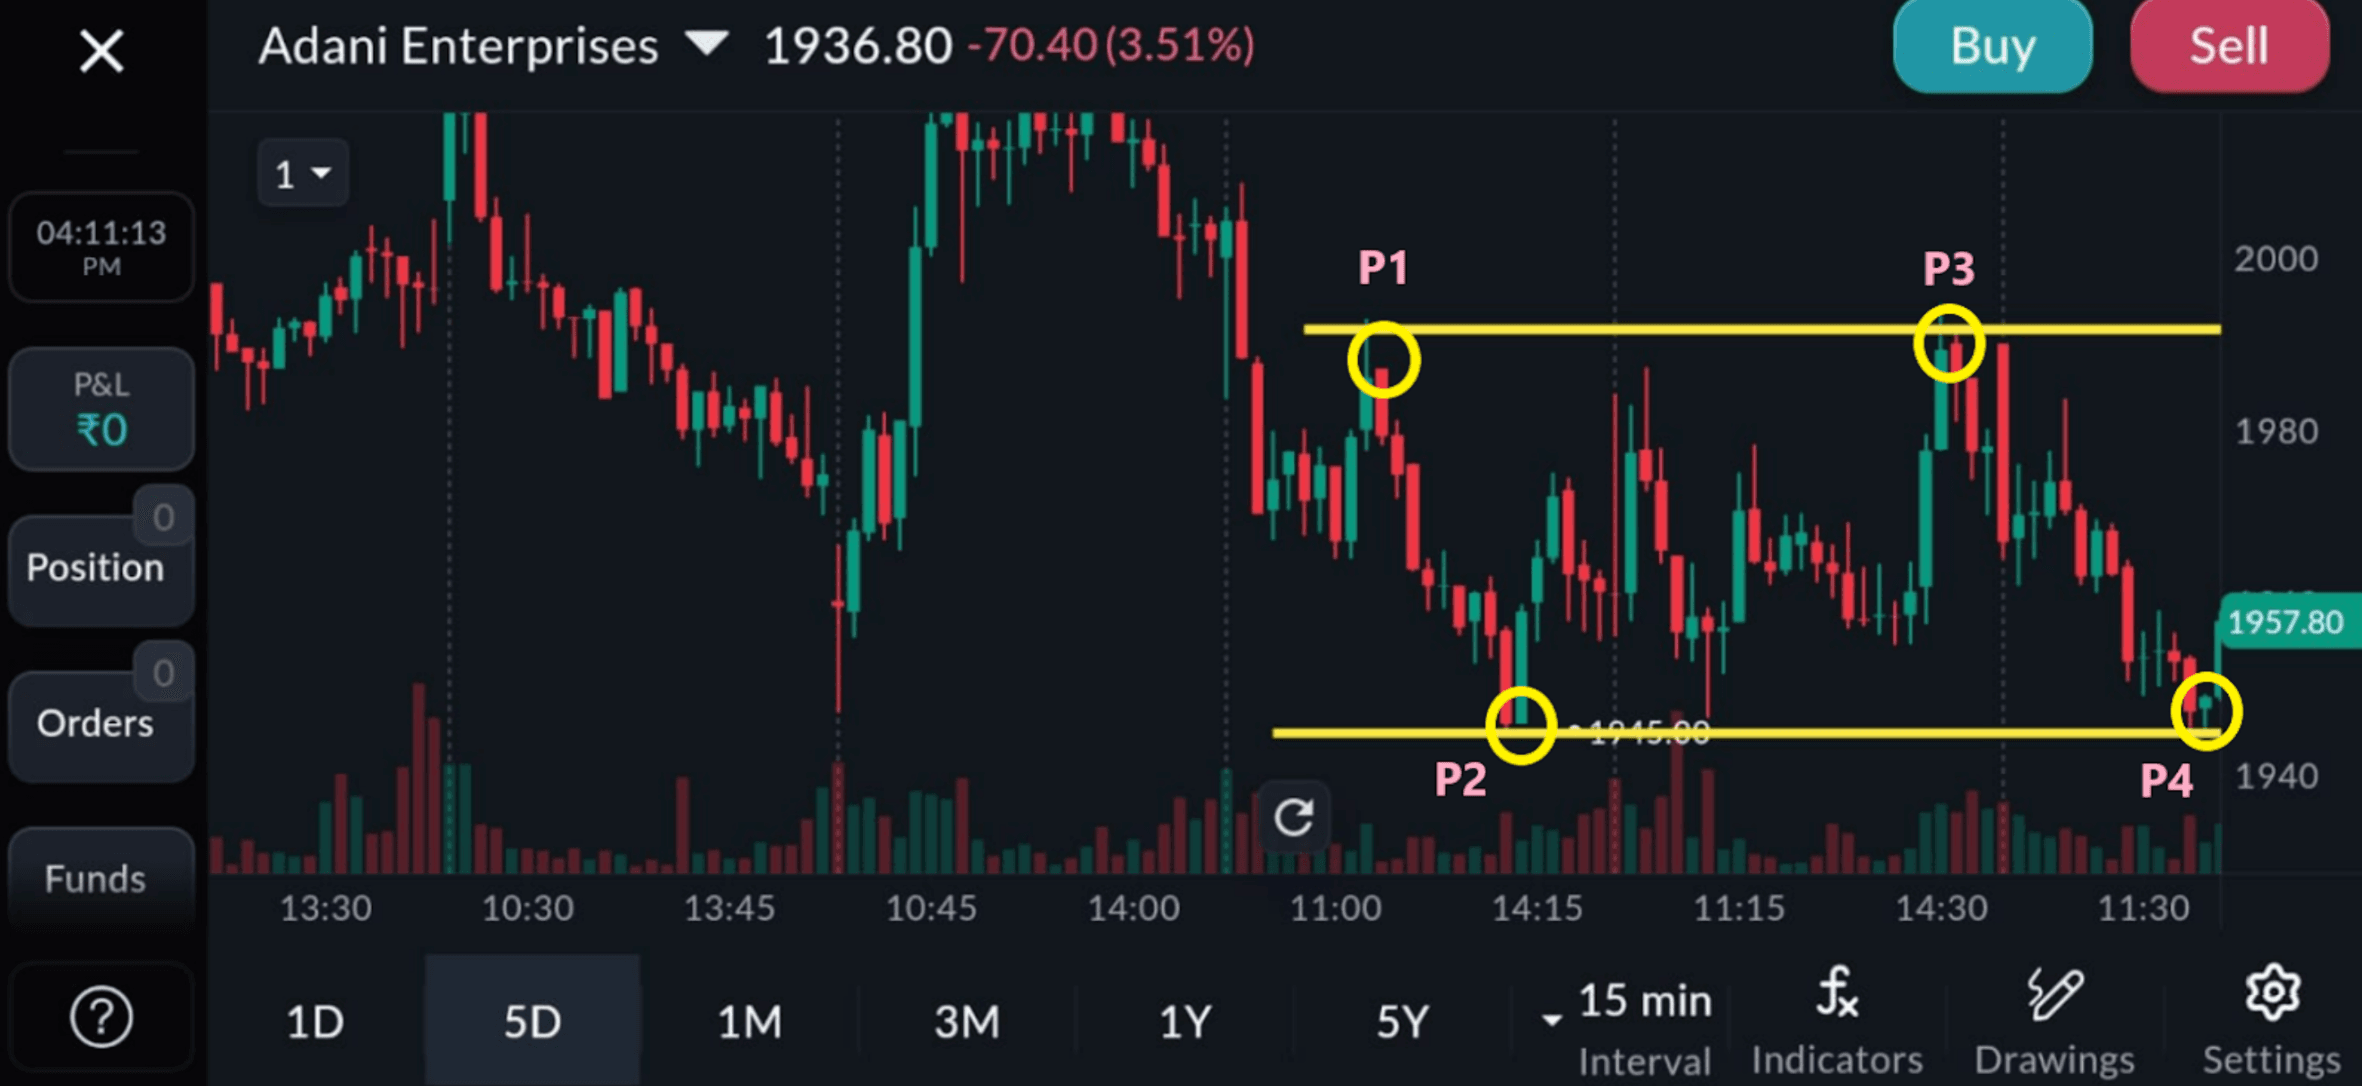
As you can see in the image above, P1 and P3 make up the resistance level. On the other hand, P2 and P4 make up the support level. They are the points derived from how the chart is behaving now.
Bottom Line
Support and resistance levels are one of the most popular trading strategies to follow while analysing candlestick graphs. It helps you in identifying the entry and exit points to a specific stock while trading. It is a part of technical analysis that helps you in maximising your profits.
Additionally, these levels assist traders in managing risk by setting logical stop-loss and target points. When used consistently with discipline and proper analysis, they can significantly improve overall trading decisions and performance.
Disclaimer: This article is for informational purposes only and does not constitute investment advice. Stock markets are subject to risks. Please consult a SEBI-registered investment advisor before making any investment decisions.