
Zen Technologies Q1 Results 2027: PAT Declines 40% YoY, Revenue Drops 10%
Zen Technologies reported lower revenue and profitability in Q1 FY27 as EBITDA declined 40% and operating margins contracted, reflecting a weaker quarterly performance.

Zen Technologies Q1 Results FY2027: Zen Technologies reported a weak Q1 FY27 performance, with revenue from operations declining 10.48% YoY to ₹141.63 crore and PAT falling 40.00% to ₹31.85 crore.
Zen Tech Q1 Results 2027: On 25 July, Zen Technologies reported its first-quarter results for FY27. Revenue from Operations dropped 10.48% year-on-year to ₹141.63 crore, while Profit After Tax (PAT) declined 40.00% YoY to ₹31.85 crore. Here is the detailed breakdown of Zen Technologies Q1 results 2027.
Zen Technologies Q1 FY2027 Results Highlights
-
Revenue from Operations stood at ₹141.63 crore in Q1 FY27, registering a 10.48% YoY decline from ₹158.21 crore in Q1 FY26. Compared with ₹178.07 crore in Q4 FY26, revenue declined 20.46%.
-
Total Revenue came in at ₹160.78 crore, down 10.68% YoY from ₹180.00 crore and down 19.92% from ₹200.77 crore in Q4 FY26.
-
EBITDA (excluding Other Income) stood at ₹38.71 crore, compared with ₹64.69 crore in Q1 FY26, reflecting a 40.16% YoY decline. Compared with ₹50.98 crore in Q4 FY26, EBITDA fell 24.07%.
-
EBITDA Margin stood at 27.33%, compared with 40.89% in Q1 FY26 and 28.63% in Q4 FY26, contracting by 1,356 basis points YoY and by 130 basis points from Q4 FY26.
-
Profit After Tax (PAT) stood at ₹31.85 crore, compared with ₹53.08 crore in Q1 FY26, reflecting a 40.00% YoY decline. Compared with ₹47.25 crore in Q4 FY26, PAT decreased 32.59%.
-
PAT Margin stood at 22.49%, compared with 33.55% in Q1 FY26 and 26.53% in Q4 FY26, contracting by 1,106 basis points YoY and by 404 basis points from Q4 FY26.
|
Metric |
Q1 FY27 |
Q4 FY26 |
QoQ % |
Q1 FY26 |
YoY % |
|---|---|---|---|---|---|
|
Revenue from Operations (₹ Cr) |
141.63 |
178.07 |
-20.46% |
158.21 |
-10.48% |
|
Total Revenue (₹ Cr) |
160.78 |
200.77 |
-19.92% |
180.00 |
-10.68% |
|
EBITDA (₹ Cr) |
38.71 |
50.98 |
-24.07% |
64.69 |
-40.16% |
|
EBITDA Margin |
27.33% |
28.63% |
-130 bps |
40.89% |
-1,356 bps |
|
PAT (₹ Cr) |
31.85 |
47.25 |
-32.59% |
53.08 |
-40.00% |
|
PAT Margin |
22.49% |
26.53% |
-404 bps |
33.55% |
-1,106 bps |
|
EPS (₹) |
3.83 |
3.51 |
9.12% |
5.31 |
-27.87% |
Source: Zen Technologies Financial Performance Results.
READ THIS: IDFC FIRST Bank Q1 Results 2027
Zen Technologies Share Price
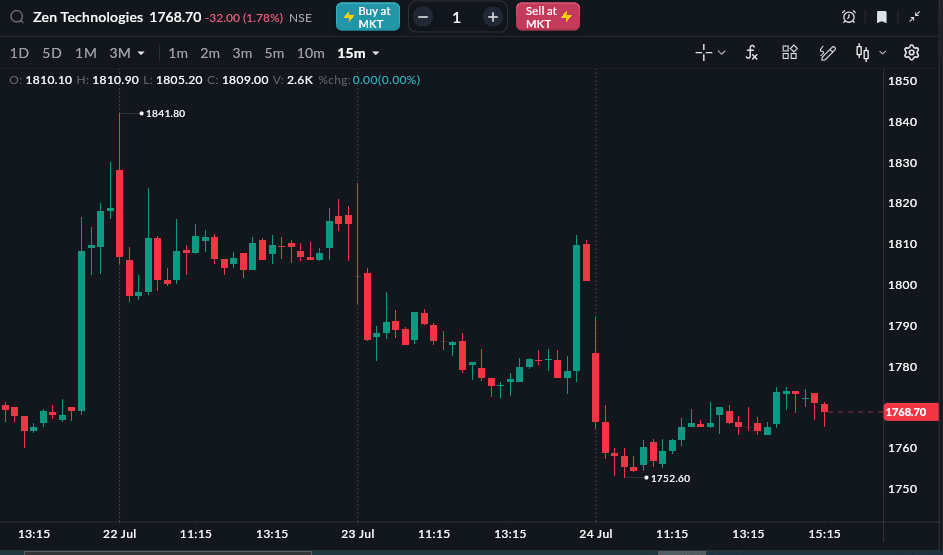
As of 24 July, 3:30 PM
Zen Tech share price closed at 1768.70 (-1.78%) on 24 July 2026. The stock is up 30.33% year-to-date and down 5.28% in one year from 24 July 2025 to 24 July 2026
All topics
Click the link, confirm the box next to sahi.com is checked — ignore any other results.