
What's New on SAHI
Here's what's new on SAHI this week — September 4, 2026.

What's New on SAHI
Here's what's new this week on SAHI.
Commodity Search
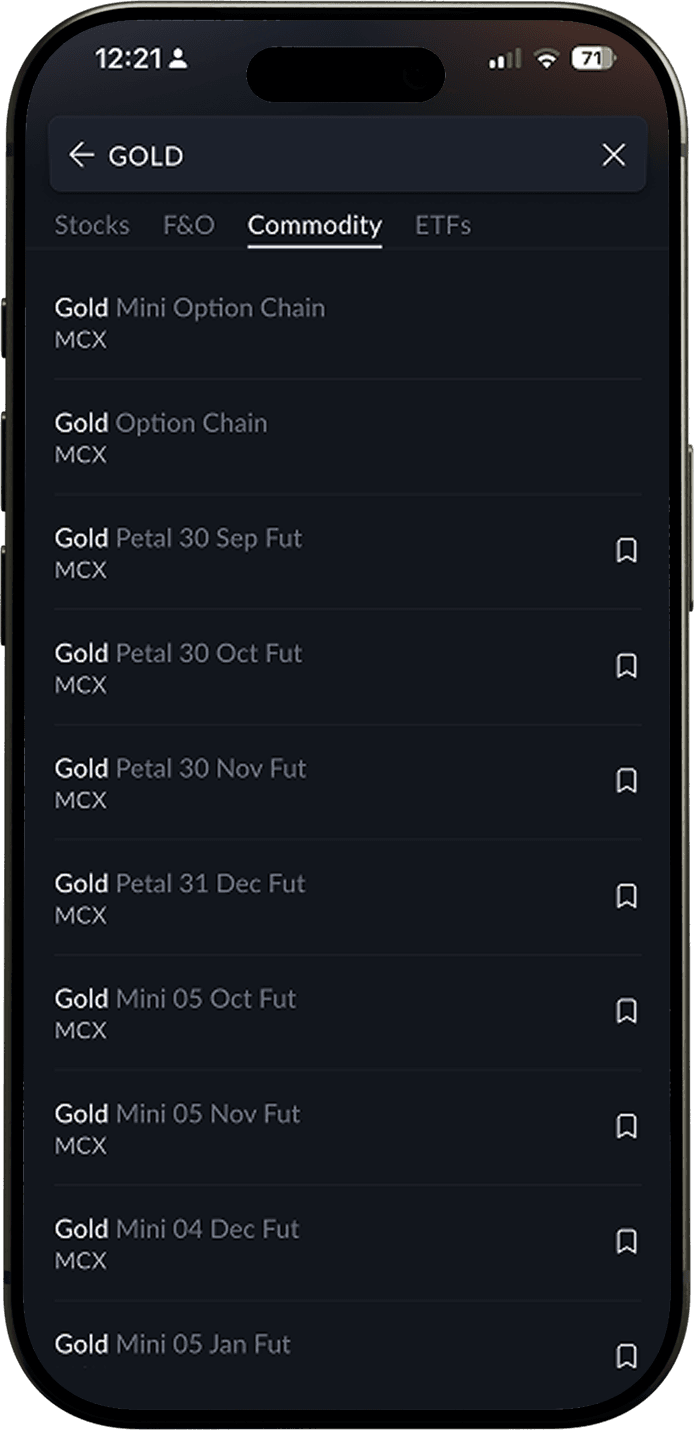
Finding the commodity you want to trade just got faster.
When you search for any commodity on SAHI, it now appears under a dedicated Commodity tab in your search results. No more scrolling through a mixed list of stocks, indices, and contracts trying to spot the one you need. The right result, in the right place, every time.
Whether you are looking for Crude Oil, Gold, Silver, Natural Gas and more, your search now takes you straight there.
3 New Indicators
Three new indicators are now live on SAHI, and they cover ground most standard indicator libraries don't. Each one is built for traders who want more than price and volume on their chart.
Candle Patterns
Reading candle formations manually takes time and leaves room for error. Candle Patterns does it for you.
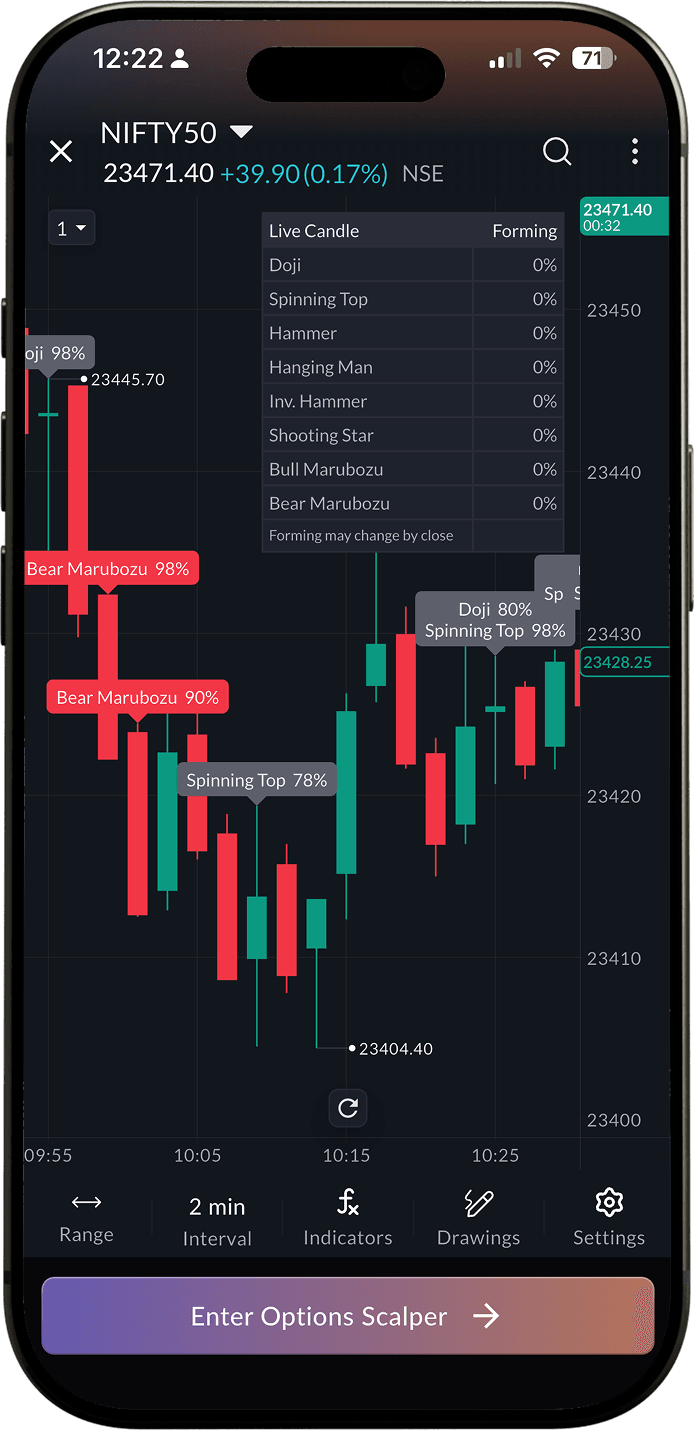
It scans your chart automatically and detects formations in real time. Doji, Hammer, Shooting Star, Marubozu, Inverted Hammer, Hanging Man, Spinning Top, Bull Marubozu, Bear Marubozu, and more. You can configure three things: the minimum probability threshold for a pattern to be flagged, the EMA length for trend context, and how many candles back you want it to scan. The result is a live, configurable pattern detection layer sitting directly on your chart, so you never miss a formation that matters.
To explore it, tap Indicators on any chart and search for Candle Patterns.
Smart Money Concept
Most retail traders look at price. Smart money looks at structure. Smart Money Concept brings institutional order flow analysis to your chart.
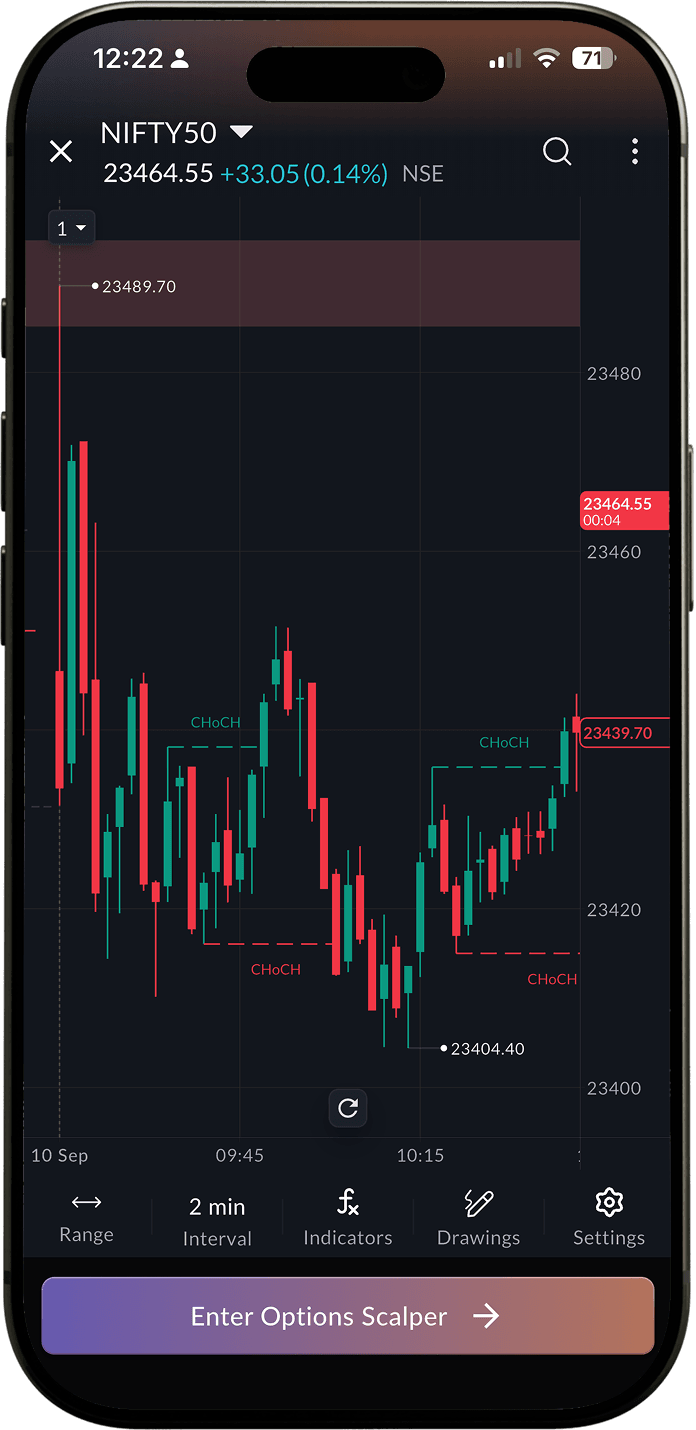
It identifies three things that matter most to traders who follow smart money. Structure breaks, which show you where the market has shifted its direction and where a new move may be beginning. Order blocks, which are the price zones where large institutional orders were placed and where price tends to react when it returns to those levels. And fair value gaps, which are imbalances in price delivery that the market often moves to fill.
Together, these give you a map of where large players are likely positioned, not just where price has been. Tap Indicators on any chart and search for Smart Money Concept.
Liquidity Sweeps
Every trader with a stop loss is a source of liquidity. Liquidity Sweeps shows you where that liquidity is sitting and where it has already been taken.
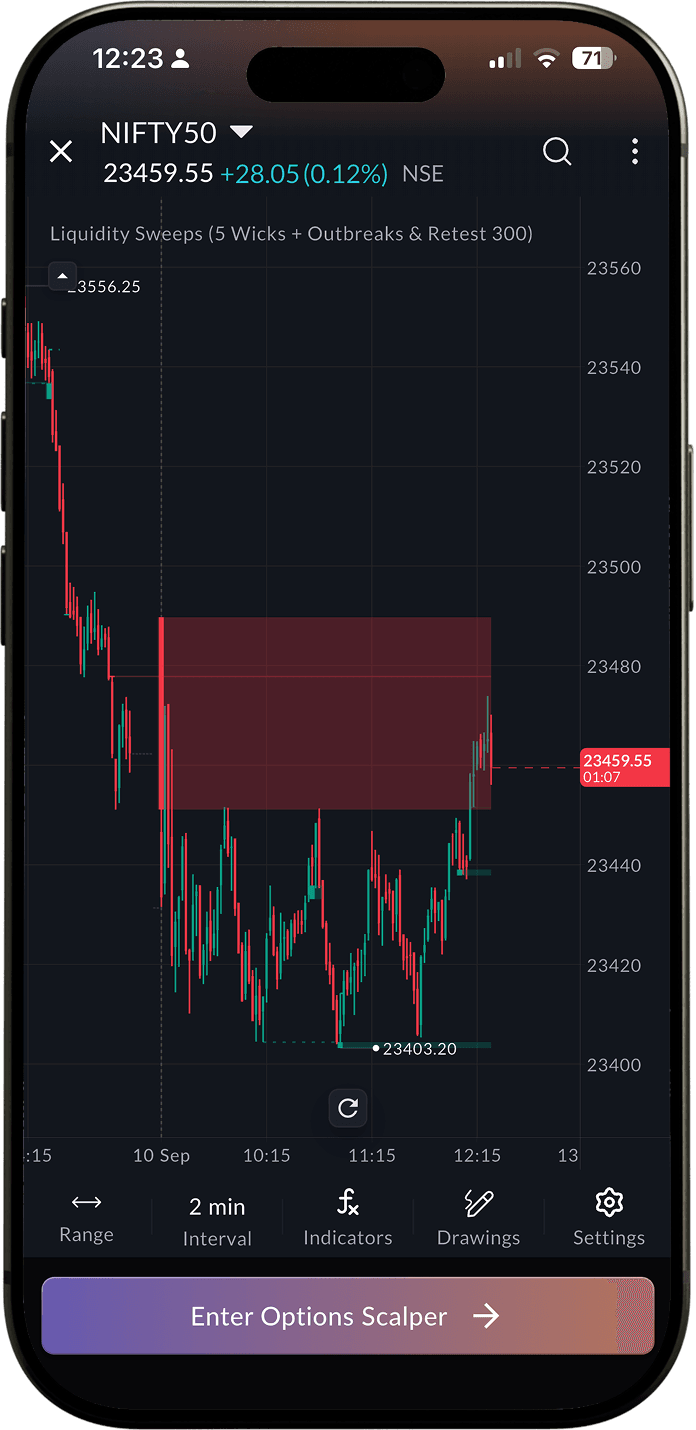
It identifies price points on your chart where stop hunts and reversals tend to occur, giving you a structured view of where sweeps have happened and where they are likely to happen next. If you trade around liquidity, this indicator gives you the context to do it with confidence rather than guesswork.
Tap Indicators on any chart and search for Liquidity Sweeps.
Pin Trade Panel
When you are mid-analysis, the last thing you want is to lose your trade panel. The pin feature fixes that.
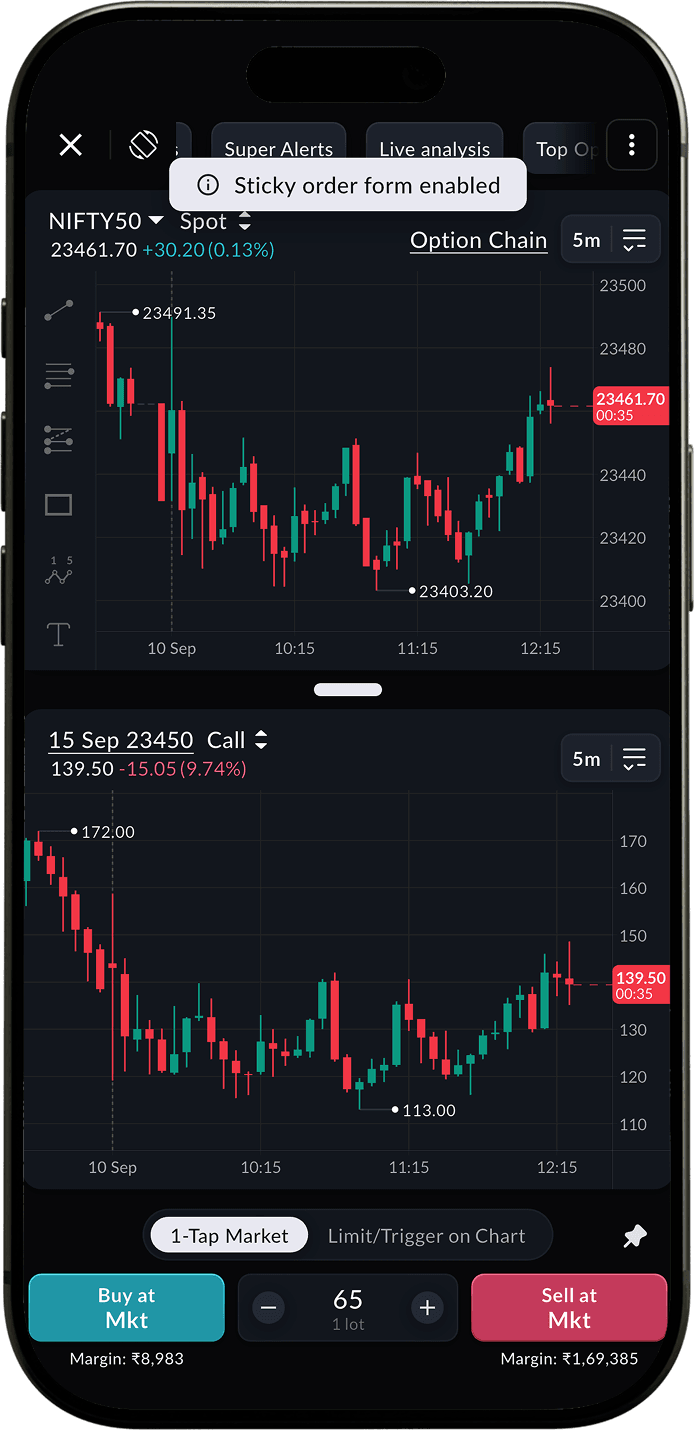
Tap the pin icon on the top right of the trade panel and it stays fixed on your screen. Your chart stays live, your panel stays open, and you can act the moment you see your setup, without toggling back and forth. Works in portrait mode so you get the full benefit on your phone without needing to rotate your screen.
Update to the latest version to start exploring.
All topics
Click the link, confirm the box next to sahi.com is checked — ignore any other results.