
Vedanta Q1 Results 2027: PAT Jumps 152% YoY, EBITDA Nearly Doubles
Vedanta reported a strong Q1 FY27 performance with sharp growth in revenue and profit, while EBITDA nearly doubled on the back of higher commodity prices and improved operating performance.

Vedanta Q1 Results 2027: Vedanta reported a robust performance for Q1 FY27, with Profit After Tax (PAT) rising to ₹5,294 crore and Revenue from Operations increasing to ₹24,205 crore. The company delivered strong profitability, supported by higher commodity prices and improved operating performance across its continuing businesses.
Vedanta Q1 Results FY2027: On 30 July 2026, Vedanta announced its financial results for the first quarter ended June 30, 2026. Revenue from Operations increased 53.64% YoY to ₹24,205 crore, while Profit After Tax (PAT) surged 151.86% YoY to ₹5,294 crore.
Vedanta share price closed 1.13 % higher on 30th July. The stock has lost 56% year-to-date and 39% over the past one year (30 July 2025 to 30 July 2026).
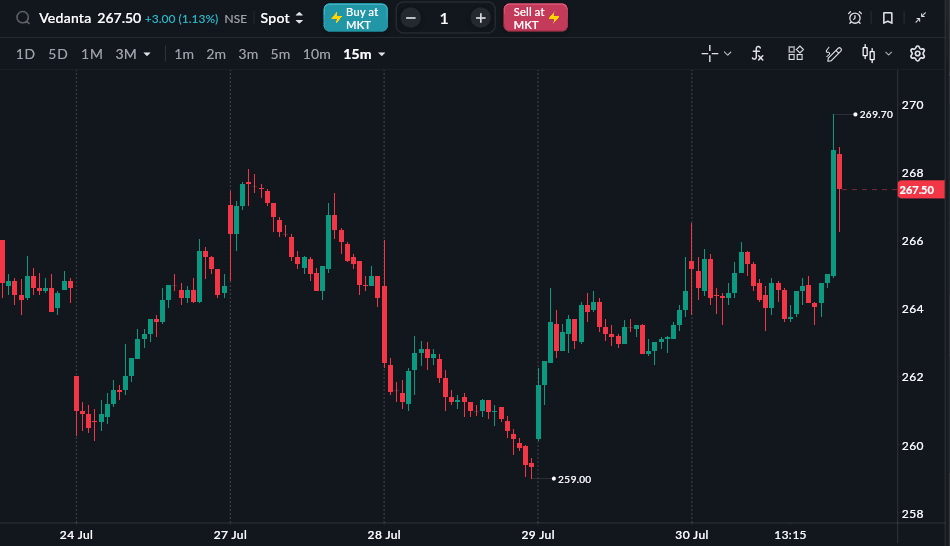
As of 30 July, 3:30 PM
READ THIS ALSO: Bajaj Finance Q1 Results 2027
Vedanta Q1 FY27 Results Highlights
-
Revenue from Operations stood at ₹24,205 crore, up 53.64% YoY from ₹15,754 crore. Compared with ₹24,609 crore in Q4 FY26, revenue declined 1.64% QoQ.
-
Total Revenue stood at ₹24,747 crore, registering a 53.37% YoY increase from ₹16,136 crore in Q1 FY26. Compared with ₹25,027 crore in Q4 FY26, total revenue declined 1.12% QoQ.
-
EBITDA (Excluding Other Income) stood at ₹8,501 crore, registering a 98.81% YoY increase from ₹4,276 crore. Compared with ₹7,559 crore in Q4 FY26, EBITDA increased 12.46% QoQ.
-
EBITDA Margin stood at 35.12%, compared with 27.14% in Q1 FY26 and 30.72% in Q4 FY26, improving by 7.98 percentage points YoY and 4.40 percentage points QoQ.
-
Profit After Tax (PAT) stood at ₹5,294 crore, compared with ₹2,102 crore in Q1 FY26, registering a 151.86% YoY increase. Compared with ₹4,267 crore in Q4 FY26, PAT increased 24.07% QoQ.
-
Profit attributable to owners of the company stood at ₹5,473 crore, compared with ₹3,185 crore in Q1 FY26, registering a 71.84% YoY increase. Compared with ₹8,430 crore in Q4 FY26, profit attributable to owners declined 35.08% QoQ.
-
PAT Margin stood at 21.87%, compared with 13.34% in Q1 FY26 and 17.34% in Q4 FY26, improving by 8.53 percentage points YoY and 4.53 percentage points QoQ.
-
EPS stood at ₹14.02, compared with ₹8.15 in Q1 FY26, increasing by ₹5.87 YoY. Compared with ₹17.15 in Q4 FY26, EPS declined by ₹3.13 QoQ.
|
Metric |
Q1 FY27 |
Q4 FY26 |
QoQ % |
Q1 FY26 |
YoY % |
|---|---|---|---|---|---|
|
Revenue from Operations (₹ Cr) |
24,205 |
24,609 |
-1.64% |
15,754 |
53.64% |
|
Total Revenue (₹ Cr) |
24,747 |
25,027 |
-1.12% |
16,136 |
53.37% |
|
EBITDA (₹ Cr) |
8,501 |
7,559 |
12.46% |
4,276 |
98.81% |
|
EBITDA Margin |
35.12% |
30.72% |
4.40% |
27.14% |
7.98% |
|
PAT (₹ Cr) |
5,294 |
4,267 |
24.07% |
2,102 |
151.86% |
|
Profit Attributable to Owners (₹ Cr) |
5,473 |
6,698 |
-18.29% |
3,185 |
71.84% |
|
PAT Margin |
21.87% |
17.34% |
4.53% |
13.34% |
8.53% |
|
EPS (₹) |
14.02 |
17.15 |
-18.25% |
8.15 |
72.02% |
Vedanta Q1 FY27 Segment-wise Revenue
Vedanta's continuing businesses were led by Zinc & Lead India and Copper during the quarter, while Silver India recorded the strongest year-on-year growth. The company has classified Aluminium, Oil & Gas, Iron Ore, Power and certain other businesses as discontinued operations, following the ongoing demerger process.
|
Segment Revenue |
Q1 FY27 |
Q4 FY26 |
QoQ % |
Q1 FY26 |
YoY % |
|---|---|---|---|---|---|
|
Zinc & Lead – India (₹ Cr) |
9,146 |
8,640 |
5.86% |
6,116 |
49.54% |
|
Silver – India (₹ Cr) |
3,839 |
4,032 |
-4.79% |
1,426 |
169.21% |
|
Zinc – International (₹ Cr) |
1,392 |
1,173 |
18.67% |
1,150 |
21.04% |
|
Copper (₹ Cr) |
8,538 |
9,448 |
-9.63% |
6,374 |
33.95% |
|
Other (₹ Cr) |
615 |
880 |
-30.11% |
482 |
27.59% |
Note: Aluminium, Oil & Gas, Iron Ore, Power and certain other businesses have been reported as discontinued operations and are therefore excluded from the continuing operations segment revenue table.
Source: Vedanta Q1 FY27 Financial Results.