
VBL Q1 Results 2027: PAT Rises 15% YoY; Revenue Grows 21%
Varun Beverages delivered strong double-digit growth in revenue and earnings during Q1 FY27, driven by higher sales volumes, although margins remained largely stable year-on-year.

Varun Beverages Q1 Results FY2027: Varun Beverages reported a strong Q1 FY27 performance, with Profit After Tax (PAT) rising 15.08% YoY to ₹1,525.36 crore and revenue from operations increasing 20.77% YoY to ₹8,650.57 crore. The company also delivered healthy growth in operating profit during the quarter.
Varun Beverages Q1 Results FY2027: On 28 July, Varun Beverages reported its financial performance for the first quarter of FY27. Revenue from operations increased 20.77% year-on-year to ₹8,650.57 crore, while Profit After Tax (PAT) rose 15.08% YoY to ₹1,525.36 crore.
Just after the results, VBL share price fell 4% at the time of writing. VBL stock is down 9.60% year-to-date and down 8.67% in one year from 28 July 2025 to 28 July 2026
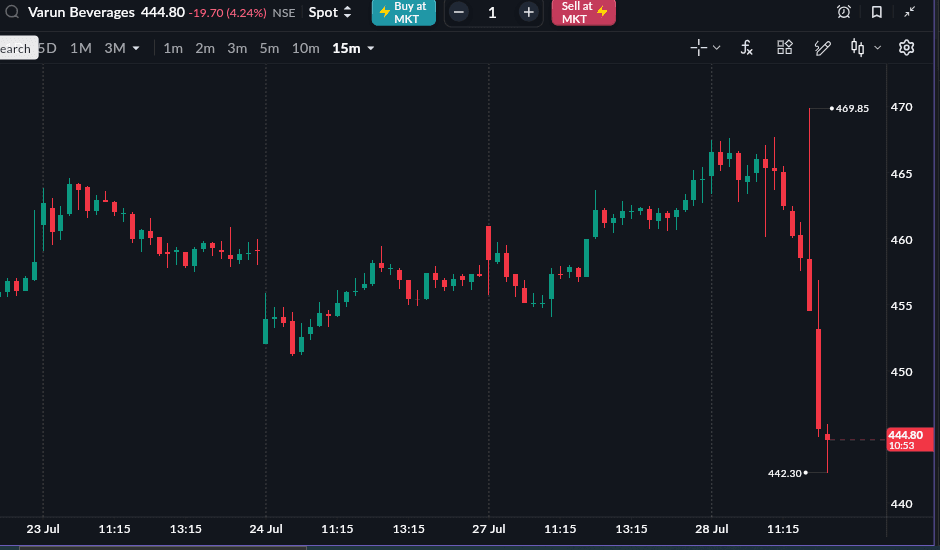
As of 28 July, 12:25 PM
READ THIS ALSO: Hindustan Unilever Q1 Results 2027
VBL Q1 FY27 Results Highlights
-
Revenue from Operations increased to ₹8,650.57 crore, up 20.77% YoY from ₹7,163.02 crore. Compared with ₹6,721.53 crore in Q4 FY26, revenue increased 28.70% QoQ.
-
Total Revenue stood at ₹8,754.95 crore in Q1 FY27, registering a 20.92% YoY increase from ₹7,240.17 crore in Q1 FY26. Compared with ₹6,765.05 crore in Q4 FY26, total revenue increased 29.41% QoQ.
-
EBITDA (Excluding Other Income) stood at ₹2,343.03 crore, registering 17.22% YoY growth from ₹1,998.77 crore. Compared with ₹1,528.92 crore in Q4 FY26, EBITDA increased 53.25% QoQ.
-
EBITDA Margin stood at 27.09%, compared with 27.90% in Q1 FY26 and 22.75% in Q4 FY26, declining by 0.82 percentage points YoY while improving by 4.34 percentage points QoQ.
-
Profit After Tax (PAT) stood at ₹1,525.36 crore, rising 15.08% YoY from ₹1,325.50 crore. Compared with ₹878.72 crore in Q4 FY26, PAT increased 73.59% QoQ.
-
PAT Margin stood at 17.63%, compared with 18.50% in Q1 FY26 and 13.07% in Q4 FY26, declining by 0.87 percentage points YoY while improving by 4.56 percentage points QoQ.
|
Metric |
Q1 FY27 |
Q4 FY26 |
QoQ % |
Q1 FY26 |
YoY % |
|---|---|---|---|---|---|
|
Revenue from Operations (₹ Cr) |
8,650.57 |
6,721.53 |
28.70% |
7,163.02 |
20.77% |
|
Total income (₹ Cr) |
8,754.95 |
6,765.05 |
29.41% |
7,240.17 |
20.92% |
|
EBITDA (Ex. Other Income) (₹ Cr) |
2,343.03 |
1,528.92 |
53.25% |
1,998.77 |
17.22% |
|
EBITDA Margin |
27.09% |
22.75% |
4.34% |
27.90% |
-0.82% |
|
PAT (₹ Cr) |
1,525.36 |
878.72 |
73.59% |
1,325.50 |
15.08% |
|
PAT Margin |
17.63% |
13.07% |
4.56% |
18.50% |
-0.87% |
|
EPS (₹) |
4.50 |
2.58 |
74.42% |
3.89 |
15.68% |
Source: Varun Beverages Q1 FY27 Financial Results.