
UltraTech Cement Q1 FY27 Results: PAT Rises 17% YoY, Revenue Grows 16%
UltraTech Cement reported a strong Q1 FY27 with revenue rising to ₹24,648 crore and PAT increasing to ₹2,604 crore.

UltraTech Cement Q1 2027: UltraTech Cement reported a strong Q1 FY27, with revenue from operations rising 15.85% YoY to ₹24,648 crore and PAT increasing 17.24% YoY to ₹2,604 crore. However, sequential profitability softened, with EBITDA and margins declining from Q4 FY26.
UltraTech Cement Q1 FY27 Results: On 20 July, UltraTech Cement reported a strong performance for the first quarter of FY27. Revenue from operations rose 15.85% YoY to ₹24,648 crore, while PAT increased 17.24% YoY to ₹2,604 crore, driven by healthy volume growth and improved operating performance.
However, profitability moderated quarterly. Here's a detailed breakdown of UltraTech Cement's Q1 results. 2027
UltraTech Cement Q1 FY27 Results Highlights
-
UltraTech Cement reported revenue from operations of ₹24,648.20 crore in Q1 FY27, registering 15.85% YoY growth from ₹21,275.45 crore in the same quarter last year. On a sequential basis, revenue from operations declined 4.46% from ₹25,799.47 crore reported in Q4 FY26.
-
Total revenue stood at ₹24,778.47 crore, up 15.49% YoY from ₹21,455.68 crore. Compared with the March quarter, total revenue declined 4.28%.
-
EBITDA (excluding other income) came in at ₹5,015.45 crore, compared with ₹4,410.34 crore in the year-ago quarter, reflecting 13.72% YoY growth. EBITDA declined 10.44% from ₹5,600.31 crore reported in Q4 FY26.
-
EBITDA margin stood at 20.35%, compared with 20.73% in Q1 FY26 and 21.71% in Q4 FY26.
-
PAT stood at ₹2,603.72 crore, up 17.24% YoY from ₹2,220.91 crore in Q1 FY26. Sequentially, PAT declined 13.21% from ₹3,000.02 crore reported in Q4 FY26.
-
EPS increased to ₹88.36, compared with ₹75.67 in Q1 FY26, reflecting 16.77% YoY growth. Sequentially, EPS declined 12.87% from ₹101.41 in Q4 FY26.
|
Metric |
Q1 FY27 |
Q4 FY26 |
QoQ % |
Q1 FY26 |
YoY % |
|---|---|---|---|---|---|
|
Revenue from Operations (₹ Cr) |
24,648.20 |
25,799.47 |
-4.46% |
21,275.45 |
15.85% |
|
Total Revenue (₹ Cr) |
24,778.47 |
25,887.03 |
-4.28% |
21,455.68 |
15.49% |
|
EBITDA (₹ Cr) |
5,015.45 |
5,600.31 |
-10.44% |
4,410.34 |
13.72% |
|
EBITDA Margin (%) |
20.35% |
21.71% |
-136 bps |
20.73% |
-38 bps |
|
Profit After Tax (PAT) (₹ Cr) |
2,603.72 |
3,000.02 |
-13.21% |
2,220.91 |
17.24% |
|
PAT Margin (%) |
10.56% |
11.63% |
-107 bps |
10.44% |
+12 bps |
|
EPS (₹) |
88.36 |
101.41 |
-12.87% |
75.67 |
16.77% |
Source: UltraTech Cement Q1 FY27 Consolidated Financial Results.
READ THIS ALSO: HDFC Bank Q1 FY27 Results
UltraTech Cement Share Price Today
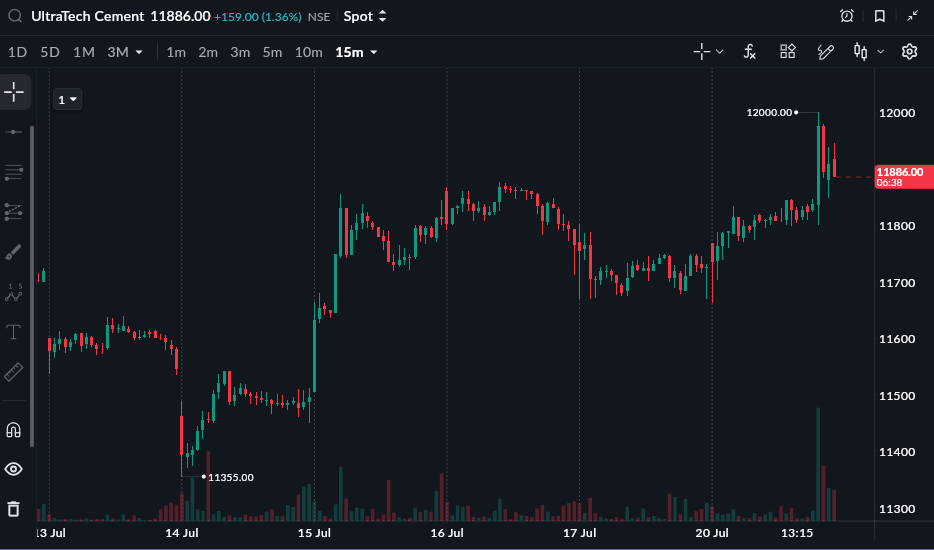
As of 20th July, 3 PM
Ultratech Cement is currently trading at ₹11913, 1.59% higher on 20 July 2026. The stock is up 0.15% year-to-date and down 4.63% over the last year from 20 July 2025 to 20 July 2026.
All topics
Click the link, confirm the box next to sahi.com is checked — ignore any other results.