
Triple Top & Triple Bottom Patterns: Meaning, Examples & How to Trade
Triple top and triple bottom are reversal chart patterns that form after three unsuccessful attempts to break a key support or resistance level. These patterns help traders identify potential trend reversals, confirm breakouts with volume, and plan entries, stop-losses, and profit targets.

Triple top and triple bottom are reversal chart patterns that signal a potential change in trend after three failed attempts to break a key support or resistance level. These patterns help traders identify possible entry, exit, stop-loss, and profit target levels after a confirmed breakout.
Triple top and triple bottom patterns are reversal formations that appear after an extended trend, signalling that the prevailing move may be running out of steam. Both patterns are built on the same underlying idea: price tests a level three times and fails to break through, but they sit on opposite ends of the trend spectrum.
A triple top forms after an uptrend and warns of a bearish reversal, while a triple bottom forms after a downtrend and warns of a bullish reversal. This may sound difficult; let's understand what is triple top and triple bottom pattern with real examples.
Real Examples of Triple Top and Triple Bottom Patterns
Below are examples to understand what the Triple Top and Triple Bottom patterns look like in practice. Let's examine Adani Ports & SEZ and Electronics Mart India in detail for such patterns.
Case Study 1: Adani Ports & SEZ (Triple Top)
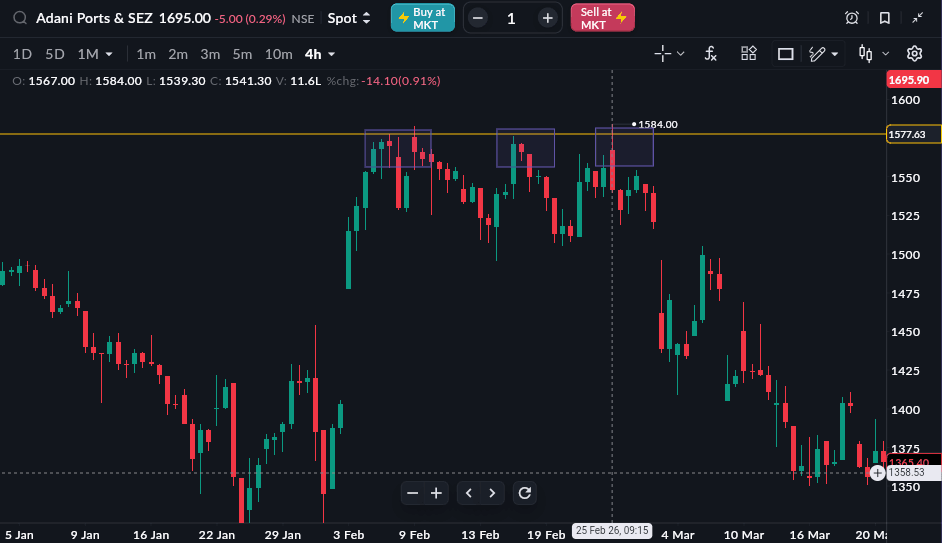
Adani Ports & Special Economic Zone had been on a steady rally when it formed a triple top on its four-hour chart in early 2026. The stock tried to break the same resistance zone three times.
The repeated inability to get above resistance showed buying momentum was waning, although the overall trend was positive. Traders pointed to the setup as a possible near-term bearish reversal; a break below the support line connecting the two intervening pullbacks (the "neckline") would confirm sellers were in control.
This is a good example of how you can get a triple top even in a stock that has good underlying fundamentals. The pattern itself is about exhaustion of short-term buying pressure, not necessarily the health of the business.
Case Study 2: Electronics Mart India (Triple Bottom)
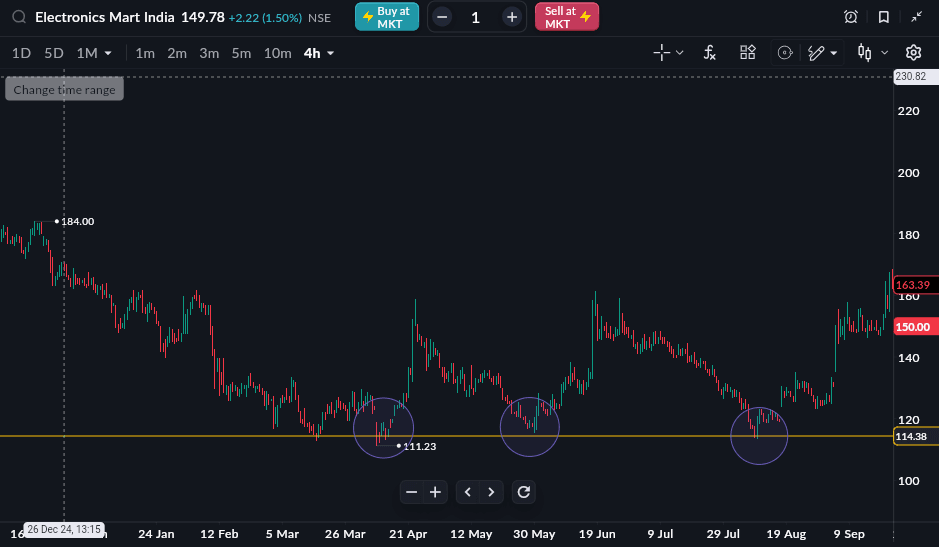
Electronics Mart India traded in a well-defined support band for several weeks after a corrective decline. The stock tested the same support zone on three separate occasions without breaking down further, with each dip attracting fresh buying interest.
The third low held, volume started to pick up, and the stock finally broke above the resistance of the minor pullbacks between the three lows. The stock finally broke above the resistance formed by the minor pullbacks between the three lows. The breakout should be confirmed with strong volume, as traders use this to validate a triple bottom pattern rather than a stock simply moving sideways.
What confirms a triple bottom pattern according to the article?
How Triple Top and Triple Bottom Patterns Form?
Both patterns can be broken down into stages that we will examine in detail:
Triple Top Formation
- Uptrend: The stock is in a definite uptrend, making higher highs as buyers remain in control.
- First Peak: Price moves up to resistance and some traders take profits and we see a pullback.
- Second Peak: Buyers again push price up to the same resistance level, but again fail to break through, and price pulls back a second time.
- Third Peak: The final rally tests the same resistance a 3rd time. The repeated rejection shows that buying pressure is weakening with every attempt.
- Break of neckline: The pattern is confirmed when price breaks through the line joining the two pullbacks (neckline). A downtrend is expected to follow.
READ THIS ALSO: Rectangle Pattern: Meaning, Formation, Types, and How to Trade It
Triple Bottom Formation
- Downtrend: The stock is in a clear downtrend, making lower lows as sellers stay in control.
- First low: Price hits a support zone and bounces.
- Second Low: Sellers push price back down to roughly the same support level, but again fail to break through, and price bounces a second time.
- Third Low: A final decline tests the same support a third time. The support holding firm shows that selling pressure is weakening with each attempt.
- Neckline Breakout: When the price breaks above the resistance level that connects the two pullbacks (neckline), then the pattern is confirmed, and an uptrend is expected to follow.
Difference Between Triple Top/Bottom and Double Top/Bottom
Triple top and triple bottom patterns are often compared to their more common cousins, the double top and double bottom, since all four patterns share the same reversal logic. Here are the key differences:
| Criteria | Triple Top / Bottom | Double Top / Bottom |
|---|---|---|
| Number of tests | Three tests of the same level | Two tests of the same level |
| Frequency | Less common, takes longer to form | More common, forms faster |
| Reliability | Considered more reliable due to the extra confirmation | Reliable, but slightly more prone to false signals |
| Breakout Direction | Below neckline (top) / above neckline (bottom) | Below neckline (top) / above neckline (bottom) |
| Trader Signals | Stronger conviction reversal signal | Earlier but slightly less confirmed signal |
How to Trade Triple Top and Triple Bottom Patterns
After you understand what triple top and triple bottom patterns are, you can use them to successfully trade. This is how to approach both:
- Entry point: With a triple top, most traders wait for a confirmed close below the neckline support before entering a short position. For a triple bottom, traders wait for a confirmed close above the neckline resistance before entering a long position. Entering before the breakout/breakdown confirms risks getting caught in a range.
- Volume Confirmation: During the formation of the three peaks or troughs there is usually a contraction of volume, which indicates a lack of confidence on the part of the prevailing side. A breakout or breakdown should be supported by an increase in volume or the move will more likely than not be a false signal.
- Stop-loss Placement: For a triple top, place your stop-loss just above the highest of the three peaks. For a triple bottom, place your stop-loss just below the lowest of the three troughs. This keeps risk well-defined in case the pattern fails.
- Locking In Your Profit Target: The measured-move technique can be used to set your target. Measure the pattern height (the distance between the peaks/troughs and the neckline) and project that distance from the breakout point. Suppose a triple bottom has formed at 400 and the breakout price at the neckline is 500, the height of the pattern is 100 and the target is 500 + 100 = 600.
Where should a stop-loss generally be placed for a triple top trade?
Common Mistakes Traders Make When Using Triple Top/Bottom Patterns
Traders should avoid some mistakes when using these patterns:
- Not all times that price tests a level three times sometimes it’s just sideways consolidation. Act only on a confirmed breakout or breakdown.
- A breakout signal without volume confirmation is more likely to trap you in a false move.
- If you assume the pattern is complete before the third test, you may enter too soon and be stopped out.
- A triple top or bottom is a technical signal on short-term momentum, not a verdict on the underlying business of a stock. The pattern can appear even in fundamentally strong names.
Conclusion
Triple top and triple bottom patterns offer traders a well-defined, relatively reliable way to spot potential trend reversals, precisely because they require three separate tests of a level before confirming. As with any chart pattern, patience is required don’t get in too early before the breakout or breakdown of the neckline is confirmed with volume, and always have a stop-loss in place to manage risk in case the pattern fails.
All topics
Click the link, confirm the box next to sahi.com is checked — ignore any other results.