
Suzlon Energy Q1 Results 2027: PAT Stands at ₹305 Cr, Revenue Grows 22.5% YoY
Suzlon Energy reported strong revenue growth in Q1 FY27, but lower margins and a high base led to a decline in quarterly profit, while the stock fell after the results.

Suzlon Energy Q1 Results FY2027: Suzlon Energy reported a mixed Q1 FY27 performance with revenue from operations rising 22.52% YoY to ₹3,819.36 crore. However, profit after tax declined 5.89% YoY to ₹305.22 crore as EBITDA margins moderated. The stock fell around 7% after the results.
Suzlon Energy Q1 Results FY2027: On 28 July, Suzlon Energy reported its financial performance for the first quarter of FY27. Revenue from operations increased 22.52% year-on-year to ₹3,819.36 crore, while Profit After Tax (PAT) stood at ₹305.22 crore.
Just after the results, Suzlon Energy share price fell 7% at the time of writing. Suzlon Energy stock is down 6.00% year-to-date and down 18.95% in one year from 28 July 2025 to 28 July 2026
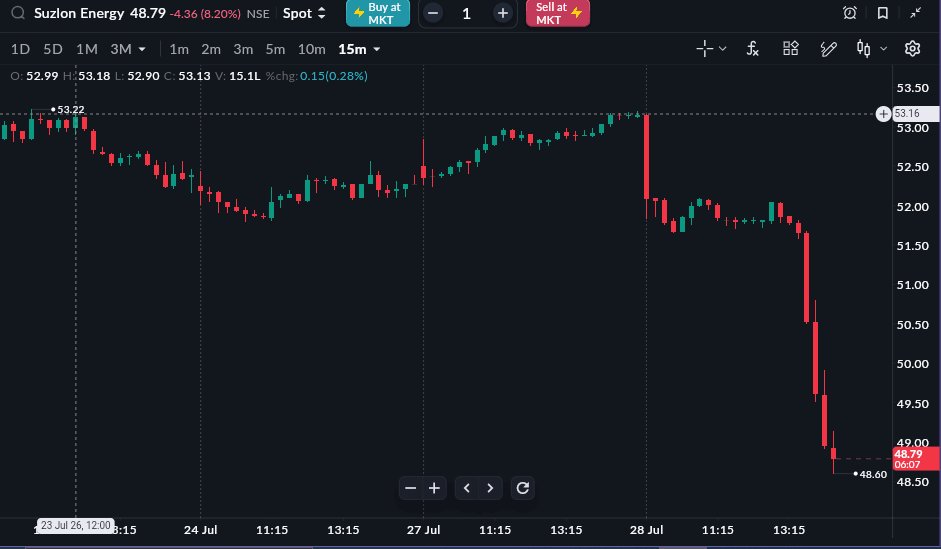
As of 28 July, 2:39 PM
READ THIS ALSO: Manipal Health Enterprises IPO GMP Today
Suzlon Energy Q1 FY27 Results Highlights
-
Revenue from Operations increased to ₹3,819.36 crore, up 22.52% YoY from ₹3,117.33 crore. Compared with ₹5,468.06 crore in Q4 FY26, revenue decreased 30.15% QoQ.
-
Total Revenue stood at ₹3,862.53 crore in Q1 FY27, registering a 22.03% YoY increase from ₹3,165.19 crore in Q1 FY26. Compared with ₹5,520.65 crore in Q4 FY26, total revenue decreased 30.03% QoQ.
-
EBITDA (Excluding Other Income) stood at ₹585.51 crore, registering 0.14% YoY growth from ₹584.68 crore. Compared with ₹938.79 crore in Q4 FY26, EBITDA decreased 37.63% QoQ.
-
Profit After Tax (PAT) stood at ₹305.22 crore, compared with ₹324.32 crore in Q1 FY26 (down 5.89% YoY). Compared with ₹1,114.35 crore in Q4 FY26, PAT decreased 72.61% QoQ.
- PAT Margin stood at 7.99%, compared with 10.40% in Q1 FY26 and 20.38% in Q4 FY26, declining by 2.41 percentage points YoY and by 12.39 percentage points QoQ.
|
Metric |
Q1 FY27 |
Q4 FY26 |
QoQ % |
Q1 FY26 |
YoY % |
|---|---|---|---|---|---|
|
Revenue from Operations (₹ Cr) |
3,819.36 |
5,468.06 |
-30.15% |
3,117.33 |
22.52% |
|
Total Income (₹ Cr) |
3,862.53 |
5,520.65 |
-30.03% |
3,165.19 |
22.03% |
|
EBITDA (₹ Cr) |
585.51 |
938.79 |
-37.63% |
584.68 |
0.14% |
|
EBITDA Margin |
15.33% |
17.17% |
-1.84% |
18.76% |
-3.43% |
|
PAT (₹ Cr) |
305.22 |
1,114.35 |
-72.61% |
324.32 |
-5.89% |
|
PAT Margin |
7.99% |
20.38% |
-12.39% |
10.40% |
-2.41% |
|
EPS (₹) |
0.22 |
0.81 |
-72.84% |
0.24 |
-8.33% |
Source: Company filing
All topics
Click the link, confirm the box next to sahi.com is checked — ignore any other results.