
Shriram Finance Q1 FY27 Results: PAT Surges 60% YoY, AUM Crosses ₹3.13 Lakh Crore
Shriram Finance reported a strong Q1 FY27 with healthy loan growth, lower finance costs, and a sharp rise in profitability, while assets under management crossed ₹3.13 lakh crore.

Shriram Finance Q1 Results FY2027: Shriram Finance reported a strong Q1 FY27 as total income increased 16.26% YoY to ₹13,418.74 crore and PAT surged 59.89% to ₹3,452.77 crore. AUM crossed ₹3.13 lakh crore, supported by broad-based loan growth, while Gold Loans emerged as the fastest-growing portfolio.
Shriram Finance Q1 Results FY2027: On 24 July, Shriram Finance reported a strong performance in the first quarter of FY27, driven by healthy loan growth, lower borrowing costs, and improved profitability. Total Income increased 16.26% year-on-year to ₹13,418.74 crore, while Profit After Tax (PAT) jumped 59.89% YoY to ₹3,452.77 crore.
Shriram Finance Q1 FY2027 Results Highlights
-
Interest Income stood at ₹12,916.27 crore in Q1 FY27, registering 15.60% YoY growth from ₹11,173.55 crore. Compared with ₹12,093.60 crore in Q4 FY26, interest income increased 6.80%.
-
Total Revenue from Operations came in at ₹13,400.43 crore, up 16.16% YoY from ₹11,536.32 crore and 7.09% from ₹12,513.43 crore in Q4 FY26.
-
Total Income stood at ₹13,418.74 crore, registering 16.26% YoY growth from ₹11,542.44 crore. Compared with ₹12,532.35 crore in Q4 FY26, total income increased 7.07%.
-
Profit After Tax (PAT) stood at ₹3,452.77 crore, compared with ₹2,159.39 crore in Q1 FY26, reflecting 59.89% YoY growth. Compared with ₹3,020.95 crore in Q4 FY26, PAT increased 14.29%.
-
Net Profit Margin improved to 25.73%, compared with 18.71% in Q1 FY26 and 24.11% in Q4 FY26, expanding by 702 basis points YoY and 162 basis points.
-
Net NPA remained stable at 2.33% in Q1 FY27, unchanged from 2.33% in Q4 FY26, while improving from 2.57% in Q1 FY26, reflecting a 24 basis point year-on-year decline
|
Metric |
Q1 FY27 |
Q4 FY26 |
QoQ % |
Q1 FY26 |
YoY % |
|---|---|---|---|---|---|
|
Interest Income (₹ Cr) |
12,916.27 |
12,093.60 |
6.80% |
11,173.55 |
15.60% |
|
Total Revenue from Operations (₹ Cr) |
13,400.43 |
12,513.43 |
7.09% |
11,536.32 |
16.16% |
|
Total Income (₹ Cr) |
13,418.74 |
12,532.35 |
7.07% |
11,542.44 |
16.26% |
|
PAT (₹ Cr) |
3,452.77 |
3,020.95 |
14.29% |
2,159.39 |
59.89% |
|
Net Profit Margin |
25.73% |
24.11% |
+162 bps |
18.71% |
+702 bps |
|
Basic EPS (₹) |
14.86 |
16.06 |
-7.47% |
11.48 |
29.44% |
|
Net NPA (%) |
2.33 |
2.33 |
+-0 bps |
2.57 |
-240bps |
Source: Shriram Finance Q1 FY27 Financial Results.
Shriram Finance Q1 FY27 Segment Performance
The company's asset growth remained broad-based across most lending segments, led by Commercial Vehicles, Passenger Vehicles, and MSME financing. Gold Loans delivered the fastest annual growth, while Construction Equipment remained the only major portfolio to witness a decline.
|
Segment |
Q1 FY27 |
Q4 FY26 |
QoQ % |
Q1 FY26 |
YoY % |
Share |
|---|---|---|---|---|---|---|
|
Commercial Vehicles |
1,47,034.28 |
1,41,666.60 |
3.79% |
1,23,131.89 |
19.41% |
46.86% |
|
Passenger Vehicles |
68,650.23 |
64,413.09 |
6.58% |
56,634.76 |
21.22% |
21.88% |
|
MSME |
41,962.42 |
41,244.61 |
1.74% |
38,824.26 |
8.08% |
13.37% |
|
Two Wheelers |
17,813.84 |
17,413.98 |
2.30% |
15,856.30 |
12.35% |
5.68% |
|
Construction Equipment |
12,372.66 |
13,309.51 |
-7.04% |
16,535.36 |
-25.17% |
3.94% |
|
Personal Loans |
11,420.65 |
10,716.96 |
6.57% |
10,284.91 |
11.04% |
3.64% |
|
Gold Loans |
7,513.72 |
6,622.48 |
13.46% |
5,154.05 |
45.78% |
2.39% |
|
Farm Equipment |
7,030.59 |
6,886.52 |
2.09% |
5,827.48 |
20.65% |
2.24% |
|
Total AUM |
3,13,798.39 |
3,02,273.75 |
3.81% |
2,72,249.01 |
15.26% |
100.00% |
Source: Shriram Finance Q1 FY27 Financial Results.
READ THIS : Dr. Lal PathLabs Q1 FY27 Results
Shriram Finance Share Price Today
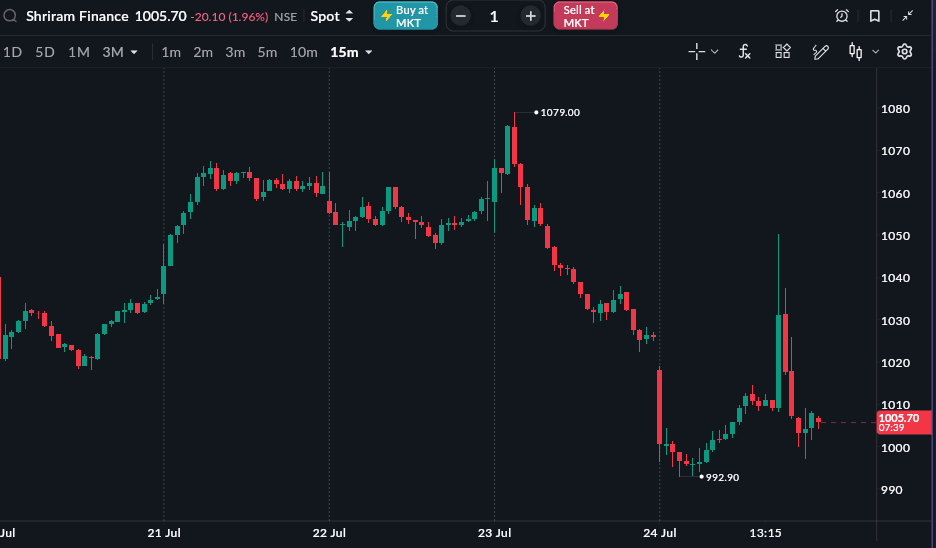
As of 24 July, 3:20 PM
Shriram Finance share price is trading at 1013.90 (-1.16%) on 23 July 2026. The stock is down 0.06% year-to-date and up 59.99% in one year from 24 July 2025 to 24 July 2026