
Session Volume Profile Explained: How Traders Use Volume-Based Price Levels to Understand Market Momentum
From Point of Control to VWAP alignment — here's what the Session Volume Profile actually shows and how intraday traders use it to read momentum and key price levels.
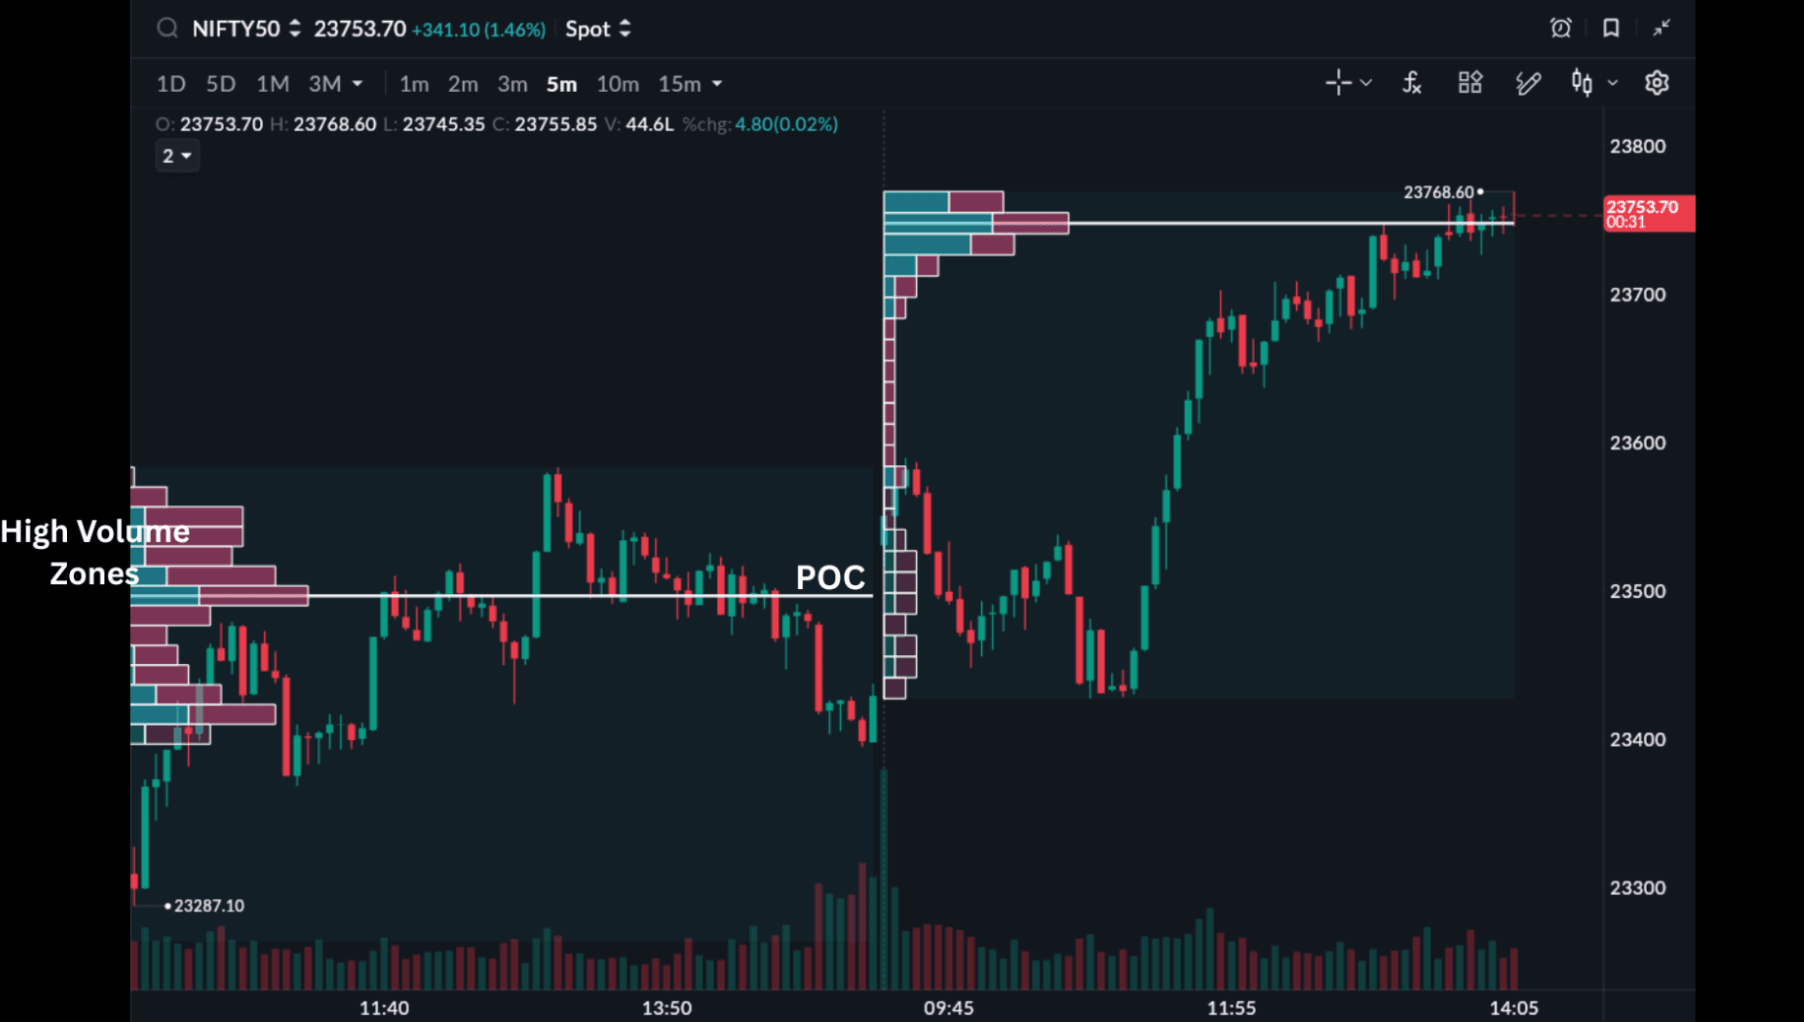
Session Volume Profile plots volume horizontally across price levels — not time — to show where the highest market participation happened in a trading session. The Point of Control (POC) is the price with the most traded volume and acts as a key support/resistance reference. When a historical POC aligns with VWAP, intraday traders treat it as a high-probability confluence zone for reversals or breakouts.
If you've ever looked at a stock chart and wondered why the price suddenly reversed from a particular level or why a breakout happened exactly near a certain zone, there's a good chance volume had something to do with it.
Not just normal volume bars that appear below the chart, but volume concentrated at specific price levels.
That's exactly what the Session Volume Profile tries to show.
Instead of focusing on when trading activity occurred, this indicator focuses on where the highest market participation occurred. It highlights the price zones where buyers and sellers were most active during a trading session, which is why many intraday traders use it to identify possible breakout areas, reversals, and momentum zones.
Watch this video if you want to learn more on how to identify breakouts more effectively.
Over the last few years, volume-based analysis has become increasingly popular among retail traders because it gives a slightly deeper view of market structure compared to traditional indicators alone. Earlier, tools like Session Volume Profile were usually available only on expensive professional terminals; SAHI has now made such indicators more accessible for everyday traders as well.
In this blog, we'll understand what the Session Volume Profile actually is, how the Point of Control (POC) works, why traders combine it with VWAP, and what its strengths and limitations are in real market conditions. More about it here.
What Is Session Volume Profile?
To understand Session Volume Profile properly, it's important to first understand how traditional volume indicators work.
On a normal trading chart, volume bars are displayed at the bottom. These bars simply show how much buying and selling happened during a particular time period. For example, on a 5-minute chart, the volume bar tells you how much trading activity happened between 10:00 AM and 10:05 AM.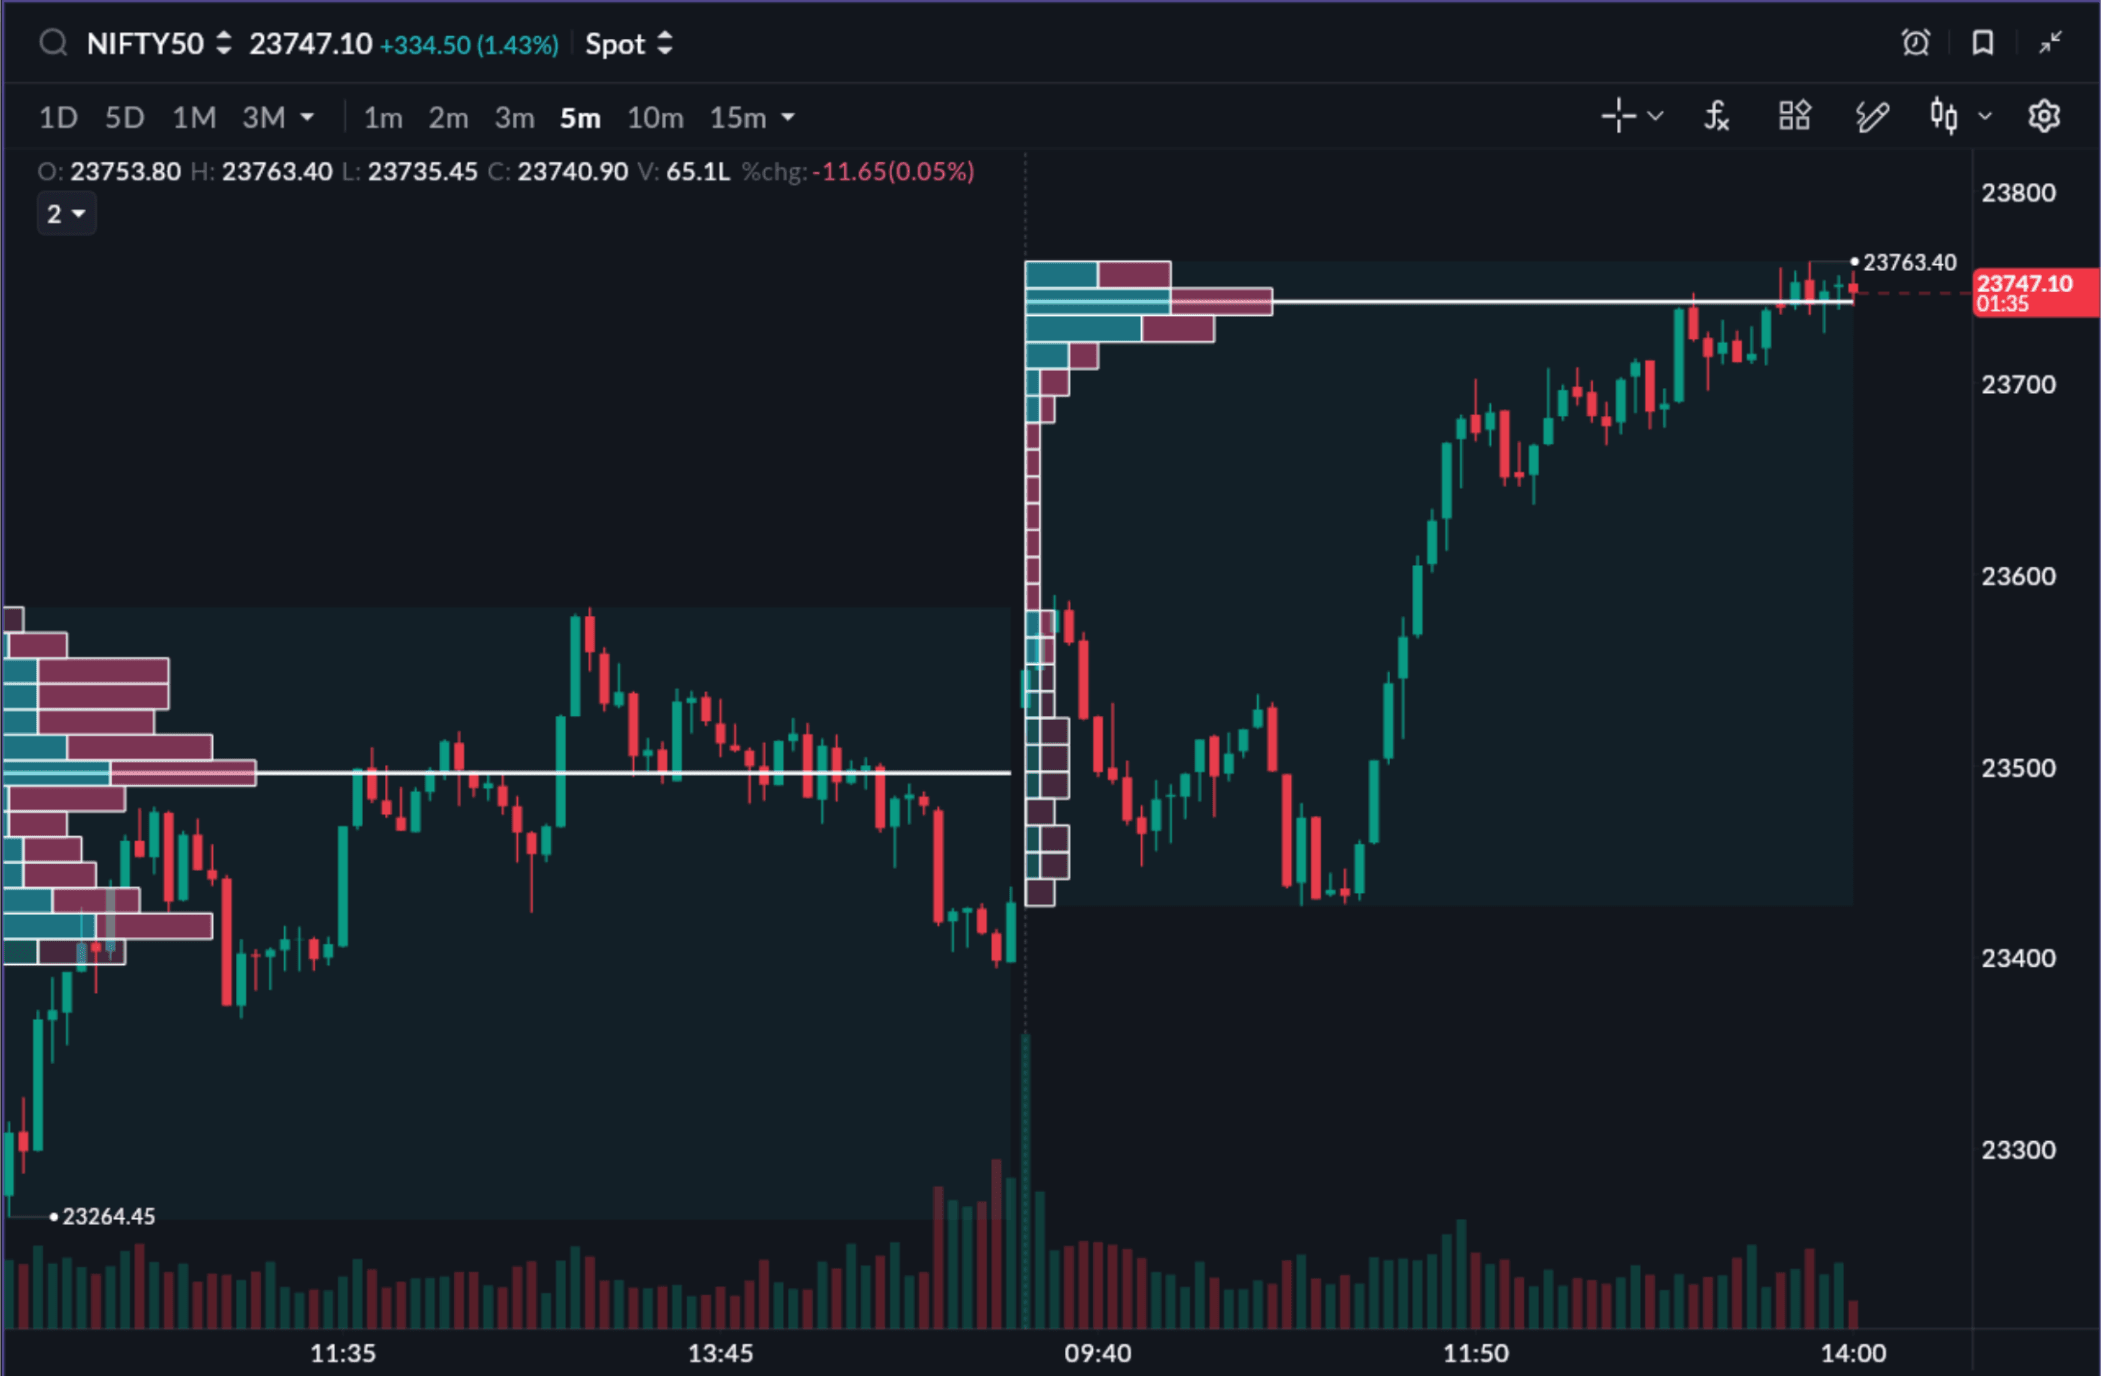
But here's the limitation.
Traditional volume indicators focus only on time. They don't clearly show which price levels attracted the highest participation from traders.
Session Volume Profile indicator on SAHI solves that problem.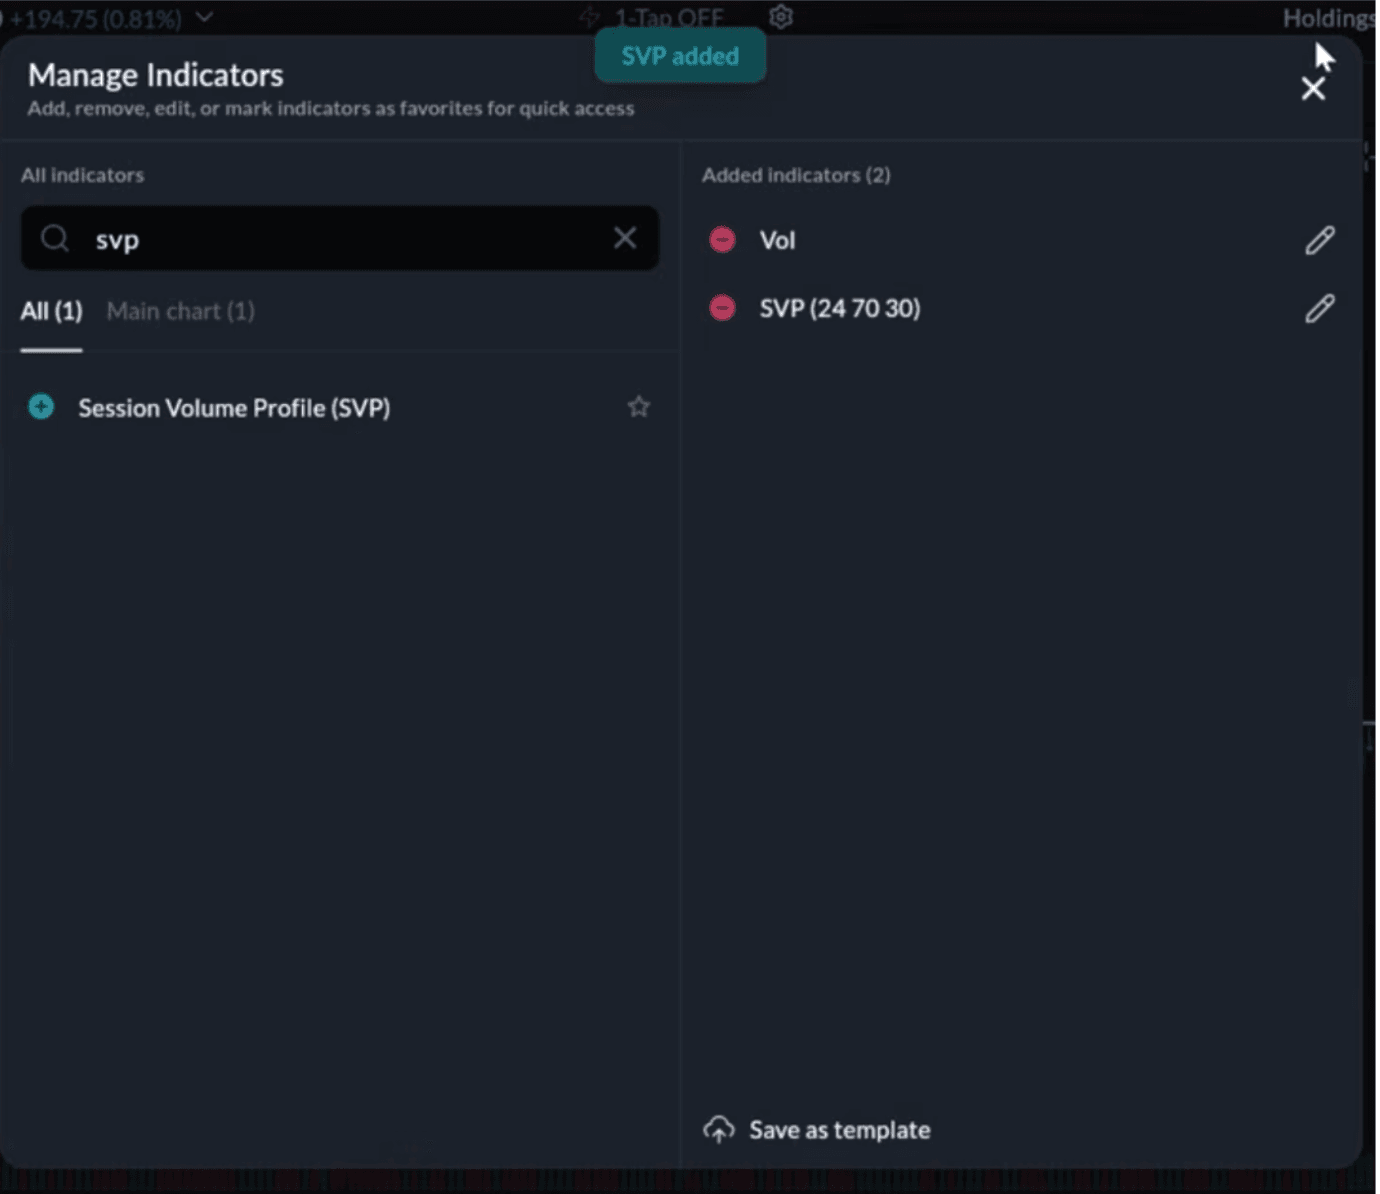
Instead of plotting volume vertically over time, it plots volume horizontally across different price levels. This creates a side histogram that highlights where the market saw the highest activity during a trading session.
In simple words:
- Traditional volume tells you when high activity happened.
- Session Volume Profile tells you where the highest activity happened.
And for many traders, that difference matters a lot.
Understanding Point of Control (POC)
One of the most important concepts inside Session Volume Profile is the Point of Control, commonly known as the POC.
The POC represents the price level where the highest trading volume occurred during a session. On most charts, it appears as a highlighted horizontal line.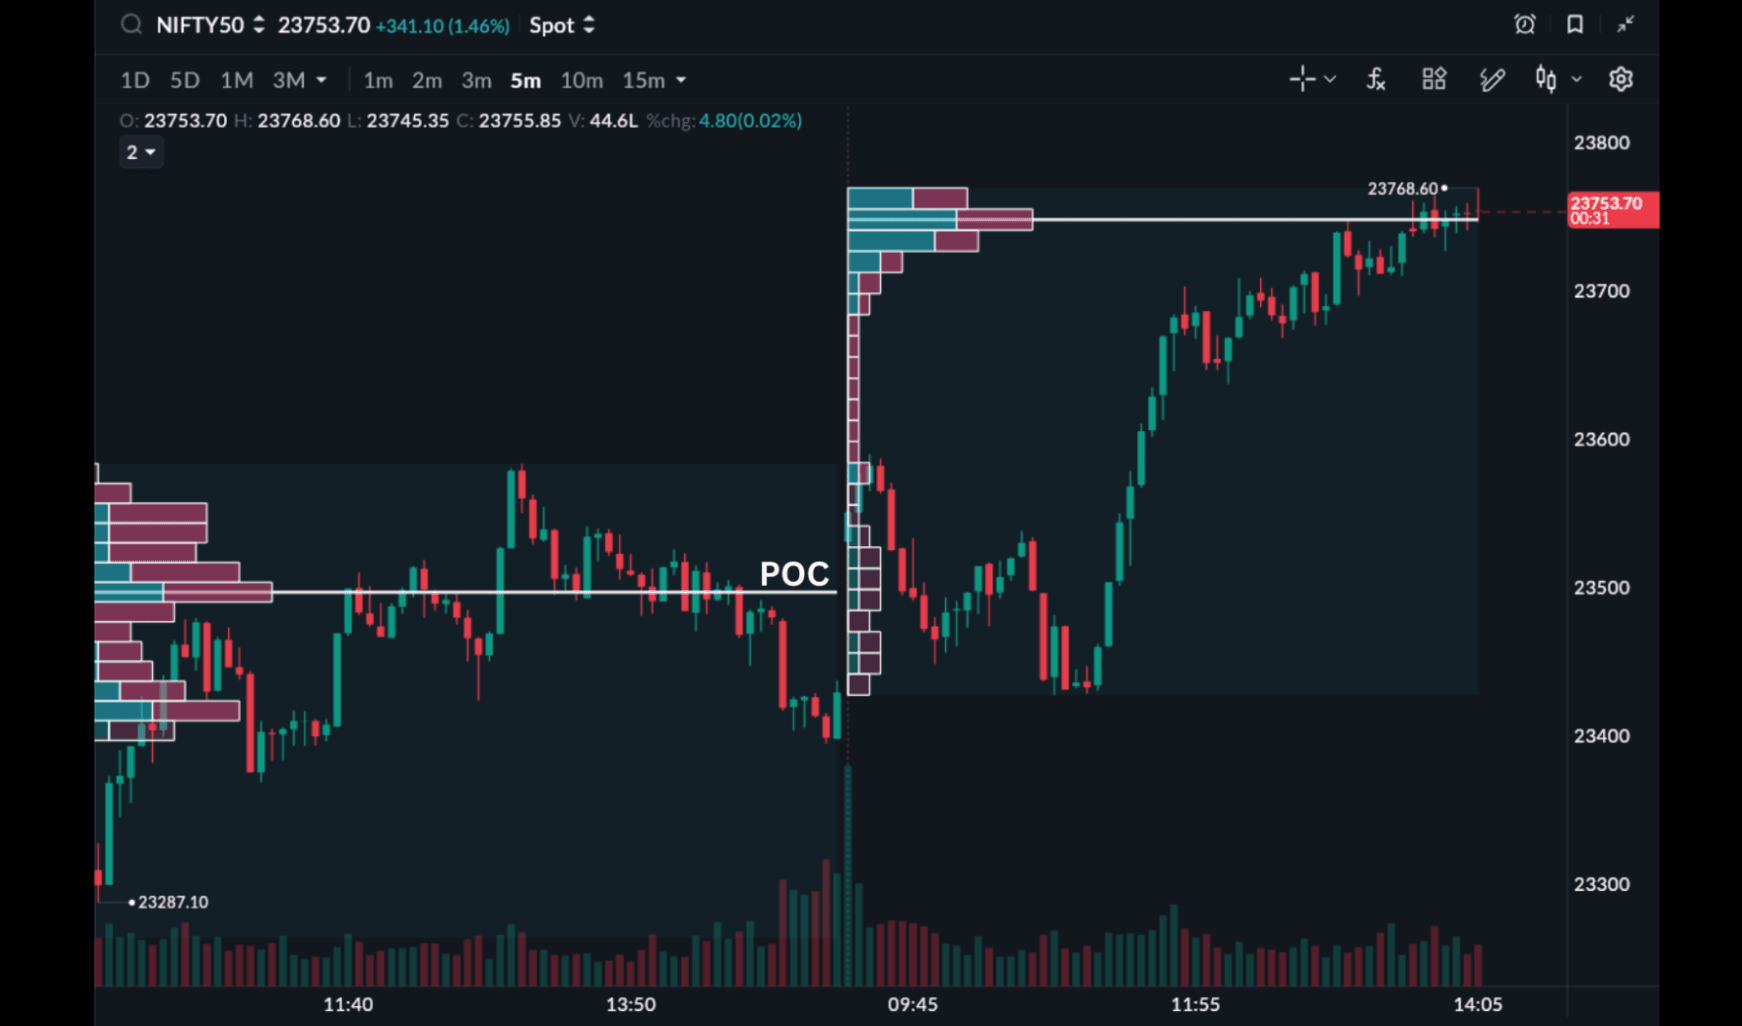
Why is this level important?
Because if a stock spends a large amount of volume around one particular price, it usually means buyers and sellers were highly active there. In other words, it becomes a zone of strong market participation.
That's why traders often treat old POC levels like important support and resistance zones. On SAHI, you can even mark the high and low of this high-volume zone.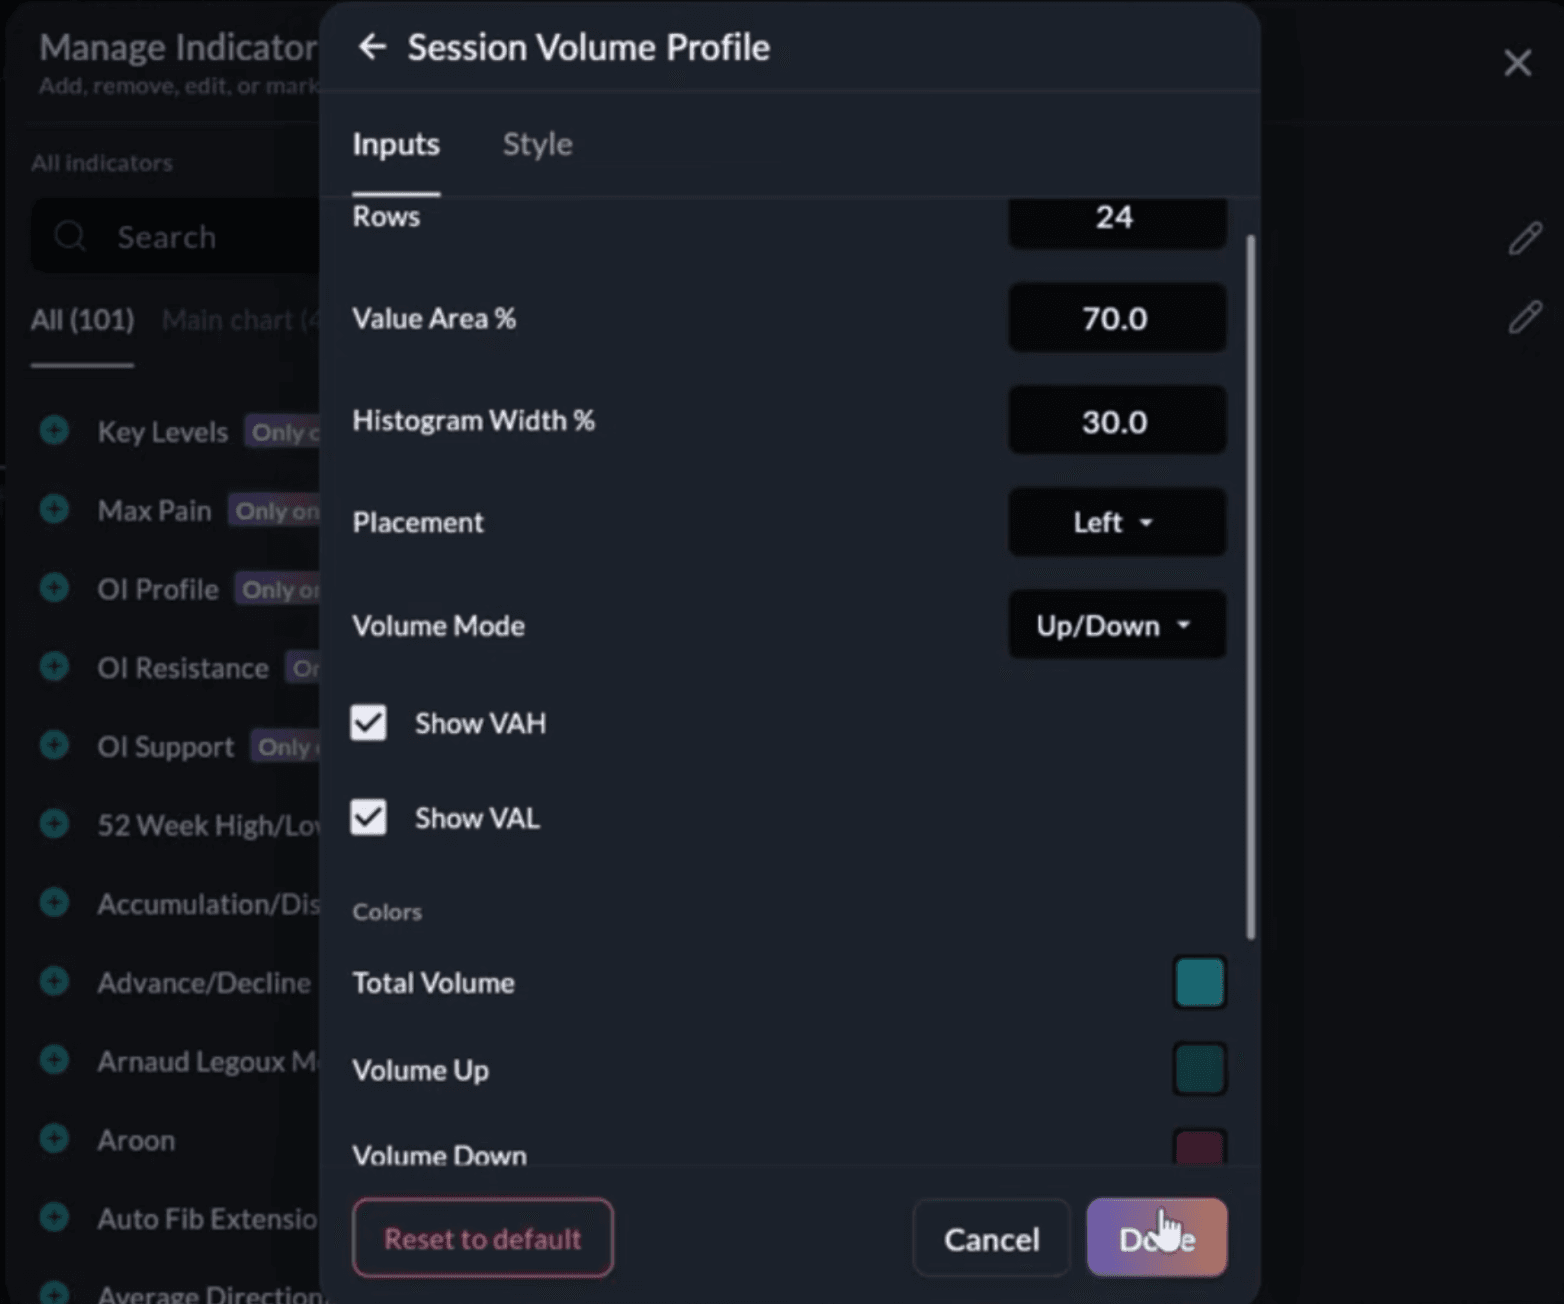
When price revisits these areas later, traders watch carefully because the market may either:
- Continue strongly from there
- Reject the level
- Consolidate before a breakout
- Reverse direction
This doesn't mean the POC guarantees a move. But it does indicate that the level previously attracted strong interest from market participants.
What Are High Volume Zones?
Apart from the POC, Session Volume Profile also highlights broader High Volume Zones.
These are areas surrounding the POC where a large percentage of the session's trading activity happened. In many setups, these zones represent nearly 70% of total traded volume.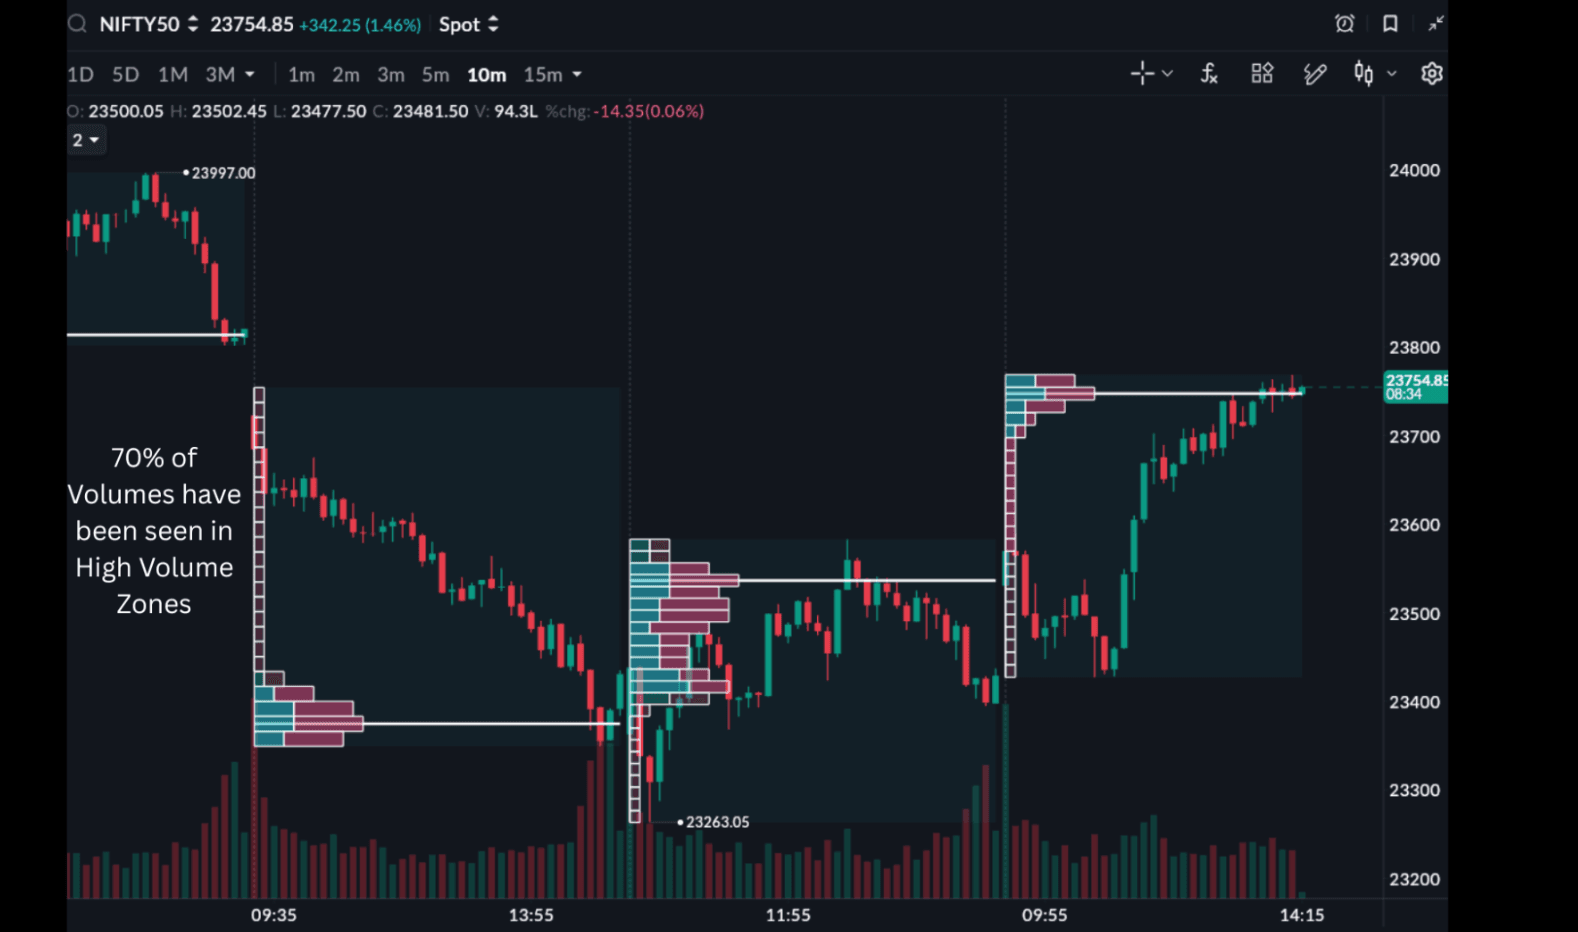
These zones are important because they often indicate areas where the market found "acceptance."
In trading language, acceptance simply means the market spent enough time and volume around those levels.
That's why traders usually don't treat these levels as exact lines. Instead, they look at them as broader price zones where reactions can happen.
Why Traders Focus on Previous Sessions Instead of the Current Session
One interesting thing many experienced traders avoid is relying heavily on the current session's volume profile.
The reason is simple.
The trading session is still forming.
As volume keeps changing throughout the day, the Point of Control and volume zones also keep shifting. This can create confusion or false signals if someone makes decisions too early.
Because of this, many traders prefer studying the previous four to five completed sessions instead.
Historical POCs tend to be more stable and can act as reference levels for the next trading day.
How Traders Use Session Volume Profile
A common approach among intraday traders is fairly straightforward.
They first identify and mark the previous session POCs on the chart. Then, when price approaches those levels again, they look for confirmation through price action.
That confirmation could come in different forms:
- Strong bullish or bearish candles
- Breakout structures
- Rejections from a zone
- Momentum continuation
- Trend confirmations
For example, if price approaches an old high-volume zone and then breaks out with strong momentum, traders may interpret it as a continuation move.
Similarly, if price repeatedly rejects the same zone, some traders may treat it as resistance.
The indicator itself doesn't generate magical signals. The real interpretation comes from how price behaves around those levels.
Why Sideways Markets Can Be Difficult
Like every technical indicator, Session Volume Profile also has limitations.
One of the biggest challenges appears during sideways or range-bound markets.
In such conditions, multiple POCs may form around the same price area, creating overlapping zones. This makes it difficult to understand whether the market is preparing for a breakout or simply continuing sideways.
As a result:
- Signals can become noisy
- Fake breakouts may increase
- Risk-reward setups may weaken
That's why many traders avoid using Session Volume Profile aggressively during low-momentum or sideways conditions.
Combining VWAP with Session Volume Profile
Many active traders combine the Session Volume Profile with another widely used indicator called VWAP.
VWAP stands for Volume Weighted Average Price.
It represents the average traded price of a stock throughout the day after considering trading volume.
Institutional traders often track VWAP because it helps them understand whether the price is trading above or below the average market participation level.
One common observation traders make is this:
Sometimes, the price moves far away from VWAP and later starts returning toward it. If, at the same time, price also reaches a historical POC or high-volume zone, traders start paying closer attention.
The logic is that when VWAP and historical volume zones align together, the price level may become more important.
However, traders usually still wait for confirmation through candlestick structure or momentum before taking positions.
Why Risk Management Still Matters
Even though the Session Volume Profile can help identify important market zones, it is still only a trading tool — not a guarantee.
No indicator can predict markets perfectly.
This is why traders using such setups often rely heavily on risk management practices such as:
- Stop-loss placement
- Risk-reward ratios
- Position sizing
- Trailing stop-loss systems
Trailing stop-loss mechanisms are particularly popular among intraday traders because they help protect profits during strong momentum moves while allowing traders to stay in the trend longer.
In reality, consistency in trading usually depends less on one indicator and more on discipline and execution.
Final Thoughts
Session Volume Profile is becoming one of the more widely discussed tools among active traders because it offers a different way of looking at the market.
Instead of focusing only on time-based volume, it helps traders identify price levels where significant participation happened. Concepts like Point of Control, High Volume Zones, and VWAP alignment can provide additional context while analysing momentum, reversals, and breakout structures.
At the same time, it's important to understand that indicators alone are never enough. Market conditions, volatility, trend structure, and risk management continue to play a major role in trading outcomes.
Still, as retail traders gain access to more sophisticated charting tools through SAHI, volume-based analysis is gradually becoming easier to learn and explore for a wider audience.