
SBI Cards Q1 FY27 Results: PAT Rises 20% YoY, Asset Quality Improves
Lower impairment charges and improving asset quality lifted SBI Cards' Q1 FY27 profitability, while fee income remained the company's key growth driver.

SBI Cards Q1 Results 2027: SBI Cards reported a steady Q1 FY27, with PAT rising 20% year-on-year on the back of lower impairment charges and improving asset quality. Fee income remained the key growth driver, while declining credit costs and a lower NNPA ratio supported overall profitability despite a modest decline in NIM
SBI Cards Q1 Results FY2027: SBI Cards and Payment Services Limited reported a steady performance in the first quarter of FY27, supported by lower credit costs and improving asset quality. Profit After Tax (PAT) increased 20% year-on-year to ₹664 crore, while impairment charges declined significantly, offsetting modest growth in total income.
SBI Cards Q1 FY2027 Results Highlights
-
Total Income stood at ₹5,205 crore in Q1 FY27, registering 3% YoY growth from ₹5,053 crore in Q1 FY26. Compared with ₹5,187 crore in Q4 FY26, Total Income remained broadly flat.
-
Profit After Tax (PAT) stood at ₹664 crore, compared with ₹553 crore in Q1 FY26, registering 20% YoY growth. Compared with ₹609 crore in Q4 FY26, PAT increased 9%.
-
Net Interest Margin (NIM) stood at 10.8%, compared with 11.21% in Q1 FY26 and 11.1% in Q4 FY26, contracting by 41 basis points YoY and 28 basis points from Q4 FY26.
-
Return on Assets (ROA) improved to 3.9%, compared with 3.39% in Q1 FY26 and 3.6% in Q4 FY26, expanding by 51 basis points YoY and 26 basis points from Q4 FY26.
-
Net Non-Performing Assets (NNPA) improved to 0.83%, compared with 1.42% in Q1 FY26 and 1.04% in Q4 FY26, declining by 59 basis points YoY and 21 basis points from Q4 FY26.
-
Earnings Per Share (EPS) stood at ₹6.98, compared with ₹5.84 in Q1 FY26, registering 19.52% YoY growth. Compared with ₹6.40 in Q4 FY26, EPS increased 9.06%.
|
Metric |
Q1 FY27 |
Q4 FY26 |
QoQ % |
Q1 FY26 |
YoY % |
|---|---|---|---|---|---|
|
Total Income (₹ Cr) |
5,205 |
5,187 |
0% |
5,053 |
3% |
|
PAT (₹ Cr) |
664 |
609 |
9% |
553 |
20% |
|
NIM |
10.8% |
11.1% |
-28 bps |
11.21% |
-41 bps |
|
ROA |
3.9% |
3.6% |
+26 bps |
3.39% |
+51 bps |
|
NPA |
0.83% |
1.04% |
-21 bps |
1.42% |
-59 bps |
|
EPS (₹) |
6.98 |
6.40 |
9.06% |
5.84 |
19.52% |
Source: SBI Cards and Payment Services Q1 FY27 Financial Results.
SBI Cards Segment-wise Performance
Revenue growth was supported by higher fee and commission income along with continued expansion in business development income. While interest income remained largely stable, the company's diversified revenue mix and lower impairment charges contributed to improved profitability during the quarter.
|
Segment |
Q1 FY27 |
Q4 FY26 |
QoQ % |
Q1 FY26 |
YoY % |
|---|---|---|---|---|---|
|
Interest Income |
2,420.63 |
2,381.76 |
1.63% |
2,493.15 |
-2.91% |
|
Fees & Commission Income |
2,405.54 |
2,342.98 |
2.67% |
2,191.15 |
9.78% |
|
Sale of Services |
9.72 |
6.04 |
60.93% |
25.99 |
-62.60% |
|
Business Development Income |
204.08 |
203.17 |
0.45% |
166.58 |
22.51% |
|
Insurance Commission Income |
0.85 |
0.55 |
54.55% |
0.05 |
1,600.00% |
|
Revenue from Operations |
5,040.80 |
4,934.50 |
2.15% |
4,876.90 |
3.36% |
Source: SBI Cards and Payment Services Q1 FY27 Financial Results
READ THIS ALSO: Tata Consumer Products Q1 FY27
SBI Cards and Payment Services Share Price Today
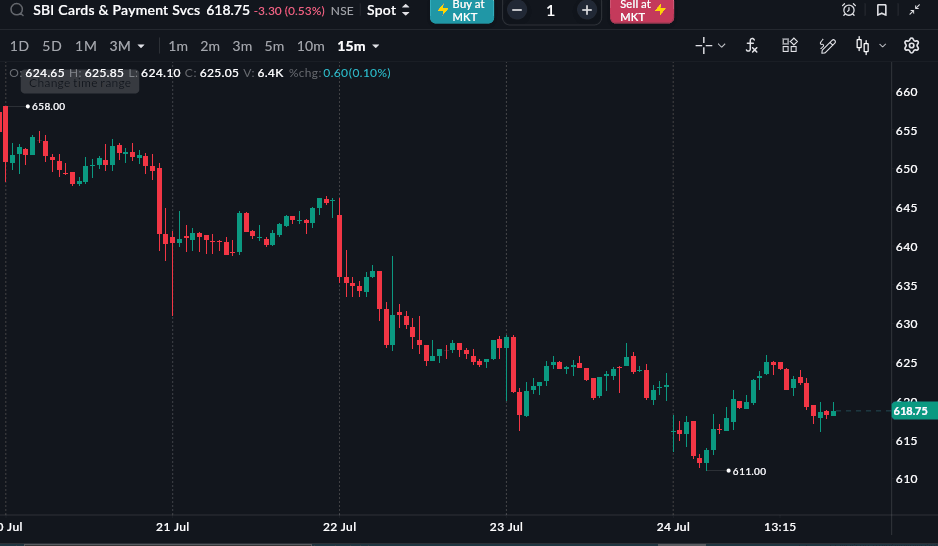
As of 24 July, 3:30 PM
SBI Cards and Payment Services share price closed at 618.75 (-0.53%) on 24 July 2026. The stock is down 28.07% year-to-date and down 30.21% in one year from 24 July 2025 to 24 July 2026