
Samvardhana Motherson Q1 Results 2027: Revenue Rises 17% YoY, PAT Jumps 77% to ₹1,076 Cr
Samvardhana Motherson reported strong Q1 FY27 results with double-digit revenue growth and a sharp rise in net profit, led by broad-based growth across its key business segments.

Samvardhana Motherson Q1 Results FY2027: Samvardhana Motherson International reported a strong performance in Q1 FY27, driven by healthy revenue growth across key business segments. Improved operating performance and robust sequential growth in profitability supported a sharp increase in net profit during the quarter.
Samvardhana Motherson Q1 Results FY2027: On 6 August 2026, Samvardhana Motherson announced its financial results for the first quarter ended 30 June 2026. Revenue from Operations increased 16.65% YoY to ₹35,244 crore compared with ₹30,212 crore in Q1 FY26.
While Profit After Tax (PAT) increased 77.48% YoY to ₹1,076 crore compared with ₹606 crore in Q1 FY26. EBITDA Margin stood at 8.79% during the quarter.
Samvardhana Motherson share price is trading 0.36% lower on 6 August 2026 at the time of writing this article. The stock has delivered 25% returns year-to-date and 61% returns over the one year from 6 August 2025 to 6 August 2026.
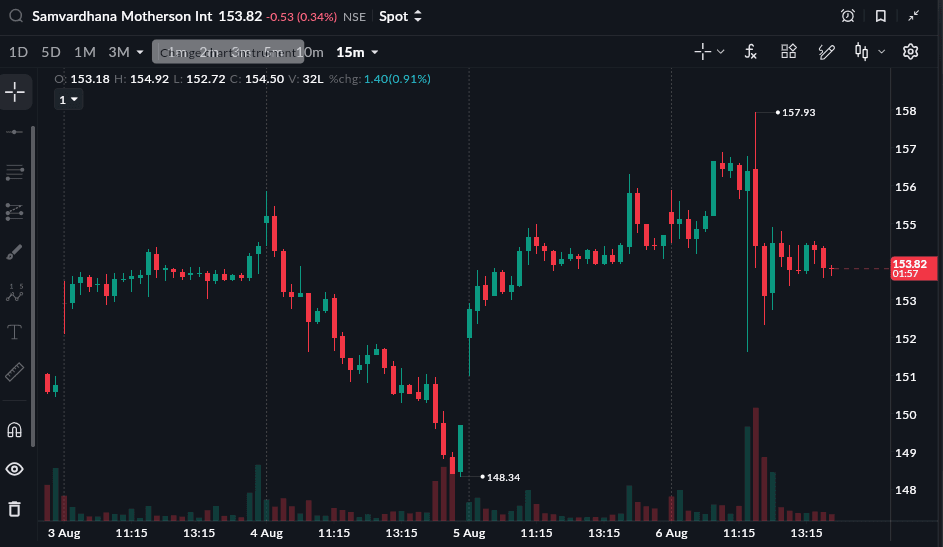
As of 6 Aug, 2:10 PM
READ THIS: P&G Health Q1 Results 2027
Samvardhana Motherson Q1 FY27 Results Highlights
-
Revenue from Operations stood at ₹35,244 crore, registering a 16.65% YoY increase from ₹30,212 crore in Q1 FY26. Compared with ₹34,309 crore in Q4 FY26, revenue increased 2.72% QoQ.
-
Total Revenue stood at ₹35,325 crore, registering a 16.61% YoY increase from ₹30,292 crore in Q1 FY26. Compared with ₹34,367 crore in Q4 FY26, total revenue increased 2.79% QoQ.
-
EBITDA (Excluding Other Income) stood at ₹3,096 crore, compared with ₹2,458 crore in Q1 FY26, registering a 25.95% YoY increase. Compared with ₹3,791 crore in Q4 FY26, EBITDA declined 18.32% QoQ.
-
EBITDA Margin stood at 8.79%, compared with 8.14% in Q1 FY26 and 11.05% in Q4 FY26, improving by 0.65 percentage points YoY and declining by 2.26 percentage points QoQ.
-
Profit After Tax (PAT) stood at ₹1,076 crore, compared with ₹606 crore in Q1 FY26, registering a 77.48% YoY increase. Compared with ₹1,562 crore in Q4 FY26, PAT declined 31.12% QoQ.
-
PAT Margin stood at 3.05%, compared with 2.01% in Q1 FY26 and 4.55% in Q4 FY26, improving by 1.05 percentage points YoY and declining by 1.50 percentage points QoQ.
-
Profit After Tax attributable to owners of the company stood at ₹1,032 crore, compared with ₹512 crore in Q1 FY26, registering a 101.64% YoY increase. Compared with ₹1,497 crore in Q4 FY26, PAT attributable to owners declined 31.07% QoQ.
-
EPS stood at ₹0.98, compared with ₹0.48 in Q1 FY26 and ₹1.42 in Q4 FY26, increasing 104.17% YoY and declining 30.99% QoQ.
|
Metric |
Q1 FY27 |
Q4 FY26 |
QoQ % |
Q1 FY26 |
YoY % |
|---|---|---|---|---|---|
|
Revenue from Operations (₹ Cr) |
35,244 |
34,309 |
2.72% |
30,212 |
16.65% |
|
Total Revenue (₹ Cr) |
35,325 |
34,367 |
2.79% |
30,292 |
16.61% |
|
EBITDA (Excl. Other Income) (₹ Cr) |
3,096 |
3,791 |
-18.32% |
2,458 |
25.95% |
|
EBITDA Margin |
8.79% |
11.05% |
-2.26 pp |
8.14% |
+0.65 pp |
|
PAT (₹ Cr) |
1,076 |
1,562 |
-31.12% |
606 |
77.48% |
|
PAT Margin |
3.05% |
4.55% |
-1.50 pp |
2.01% |
+1.05 pp |
|
PAT (Owners) (₹ Cr) |
1,032 |
1,497 |
-31.07% |
512 |
101.64% |
|
EPS (₹) |
0.98 |
1.42 |
-30.99% |
0.48 |
104.17% |
Samvardhana Motherson Q1 Segment-wise Performance
Samvardhana Motherson reported broad-based growth across its major business segments during Q1 FY27. Wiring Harness recorded the strongest growth, while Modules and Polymer Products remained the largest contributors to revenue. Vision Systems and Integrated Assemblies also posted healthy growth during the quarter.
|
Segment (₹ Cr) |
Q1 FY27 |
Q4 FY26 |
QoQ % |
Q1 FY26 |
YoY % |
|---|---|---|---|---|---|
|
Wiring Harness |
11,279.76 |
10,235.62 |
10.20% |
8,640.00 |
30.55% |
|
Modules and Polymer Products |
16,694.72 |
16,736.71 |
-0.25% |
15,008.00 |
11.24% |
|
Vision Systems |
5,654.26 |
5,532.96 |
2.19% |
5,137.00 |
10.07% |
|
Integrated Assemblies |
2,949.59 |
2,877.25 |
2.51% |
2,819.00 |
4.63% |
|
Emerging Business |
4,795.28 |
5,150.49 |
-6.90% |
3,702.00 |
29.54% |
|
Total Revenue from Operations |
35,243.77 |
34,309.31 |
2.72% |
30,212.00 |
16.65% |
Source: Company Filing
All topics
Click the link, confirm the box next to sahi.com is checked — ignore any other results.